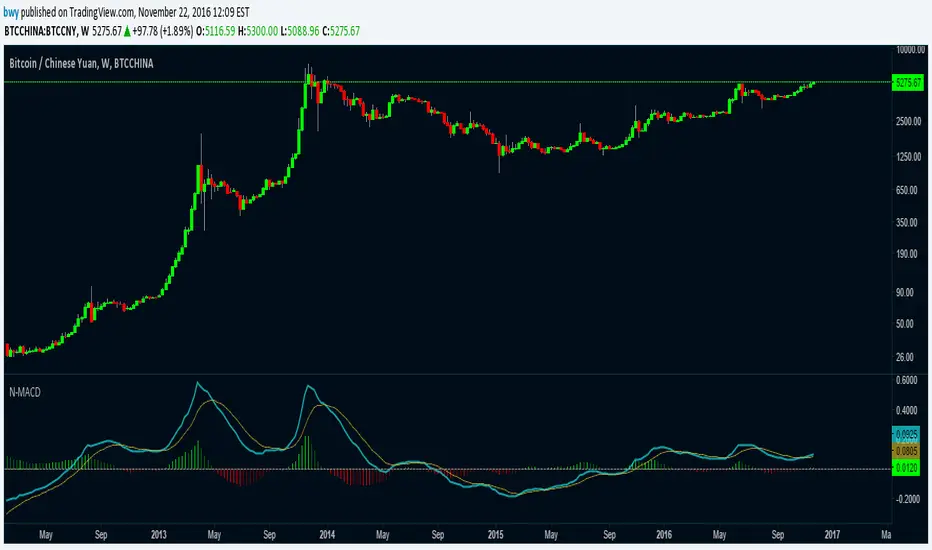
Normalized Moving Average Convergence/DivergenceThis MACD normalizes the price so that it can be compared against moves that took place at prices of significant difference.
There are also options to change if the MACD and the signal line are computed using EMA or SMA.
Tìm kiếm tập lệnh với "MACD"
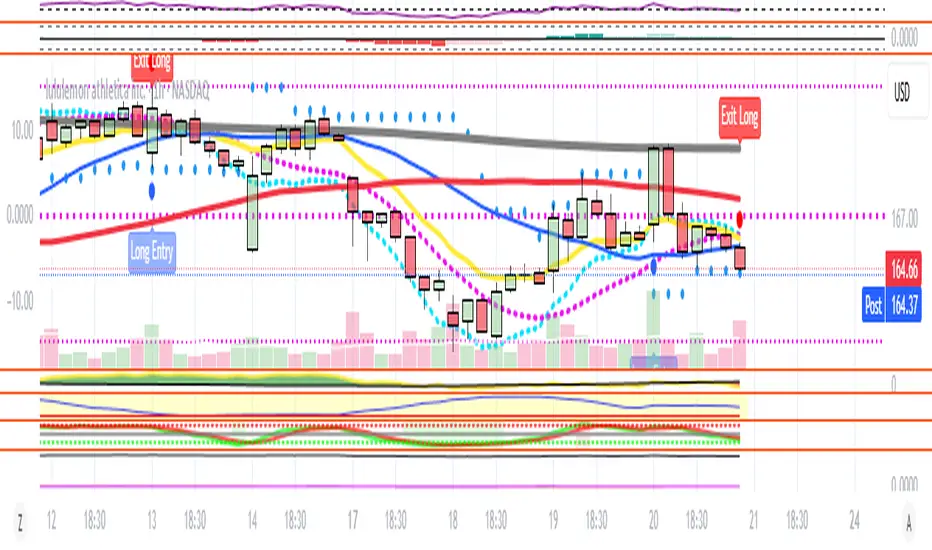
Heiken Ashi zero lag EMA v1.1 by JustUncleLI originally wrote this script earlier this year for my own use. This released version is an updated version of my original idea based on more recent script ideas. As always with my Alert scripts please do not trade the CALL/PUT indicators blindly, always analyse each position carefully. Always test indicator in DEMO mode first to see if it profitable for your trading style.
DESCRIPTION:
This Alert indicator utilizes the Heiken Ashi with non lag EMA was a scalping and intraday trading system
that has been adapted also for trading with binary options high/low. There is also included
filtering on MACD direction and trend direction as indicated by two MA: smoothed MA(11) and EMA(89).
The the Heiken Ashi candles are great as price action trending indicator, they shows smooth strong
and clear price fluctuations.
Financial Markets: any.
Optimsed settings for 1 min, 5 min and 15 min Time Frame;
Expiry time for Binary options High/Low 3-6 candles.
Indicators used in calculations:
- Exponential moving average, period 89
- Smoothed moving average, period 11
- Non lag EMA, period 20
- MACD 2 colour (13,26,9)
Generate Alerts use the following Trading Rules
Heiken Ashi with non lag dot
Trade only in direction of the trend.
UP trend moving average 11 period is above Exponential moving average 89 period,
Doun trend moving average 11 period is below Exponential moving average 89 period,
CALL Arrow appears when:
Trend UP SMA11>EMA89 (optionally disabled),
Non lag MA blue dot and blue background.
Heike ashi green color.
MACD 2 Colour histogram green bars (optional disabled).
PUT Arrow appears when:
Trend UP SMA11

Oscillator Moving Average (OsMA)This code for Oscillator of Moving Averages (OsMA) is based on MACD 4C indicator code published by vkno422 . Many thanks to vkno422. I have borrowed the concept of 4 colours which I find very useful.
For those who are not familiar with OsMA, it is histogram of difference between MACD (oscillator) and its MA (signal line). The zero line cross over of this indicator is used in many strategies.
This version includes MACD & its signal line together with OsMA histogram. I have programmed flexibility for switching OFF/ON individual indicator components as well as changing the periods for various moving averages.
I am dedicating this indicator to the TV trading community hoping that people will find it useful.


MACD Trend Count ScoreThis indicator is designed to confirm potential future trends in an asset’s price by analyzing the MACD histogram in the past. It works by counting positive and negative MACD bars within the selected chart timeframe to calculate a Strength Index, which reflects the past trend direction and intensity.
Summarizing the predominance of positive or negative bars across higher timeframes in the past such as daily, weekly, bi-weekly, and quarterly, it provides insight to anticipate how the trend may evolve in upcoming periods, according to the predetermined range scales Strong Bullish, Moderate Bullish, Neutral, Moderate Bearish and Strong Bearish.
Additionally, a dedicated module linked to the strength index is optimized for short-term charts (2-minute, 5-minute and 15-minute timeframes), making it a valuable tool for day trading strategies.

MACD-V (ATR Normalized)Per Financial Wisdom (YT):
Adjusted MACD = (EMA 12 - EMA 26 / ATR 26) x 100
Objective:
Mathematical definitions work universally across all markets and all timeframes
Improves readability and usability (values resemble RSI/MACD ranges instead of tiny decimals)
Makes threshold-based rules cleaner (e.g., ±50, ±100).
No change to signal quality — purely a scaling transformation.


MACD Bounce Strategy for CryptohopperSell and Buy alerts based on MACD crossover values for automated triggers in Cryptohopper

MACD Backtesting IndicatorThis Pine Script v5 indicator replicates TradingView's standard MACD with full backtesting capabilities. Traders can adjust all parameters (12,26,9 defaults) through inputs and see real-time performance metrics in the table. Buy/sell signals appear as labeled arrows, matching classic MACD crossover strategy while providing visual backtest results for strategy evaluation.


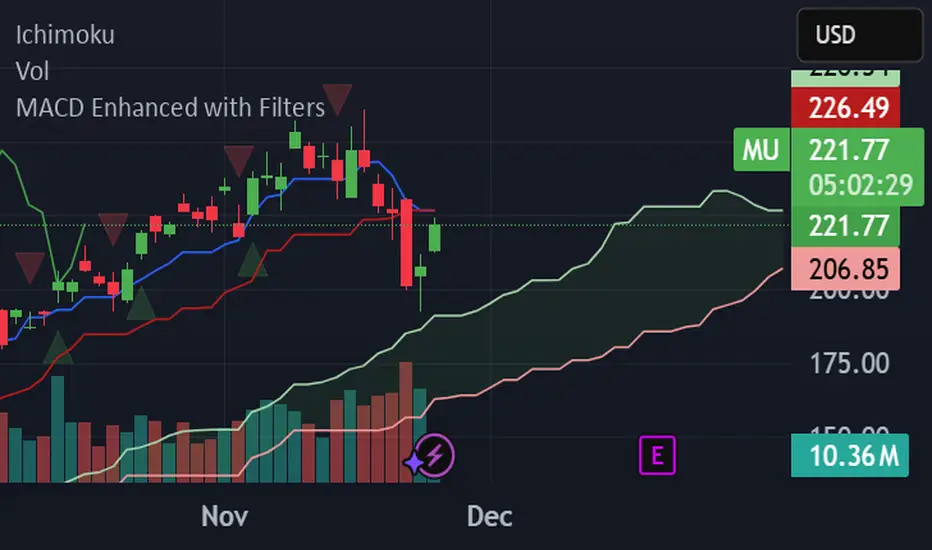
MACD Enhanced with FiltersProfessional MACD indicator with buy/sell signals and real-time alerts. Features:\n\n✅ MACD crossover signals with triangles\n✅ Green buy triangles (below bars)\n✅ Red sell triangles (above bars)\n✅ Real-time browser/email/Slack alerts\n✅ Signal strength analysis\n✅ Customizable parameters\n\nPerfect for active traders managing multiple accounts. Supports Webull, Interactive Brokers, and other platforms.
MACD Cross Above Zero Alert (Any Timeframe)For use on a large list to spot MACD cross overs in a bullish phase or bearish phase

LBR Oscillator with Signals & AlertsLinda Bradford Raschke MacD indicator. Has alerts and can be used in the pine screener on different timeframes.


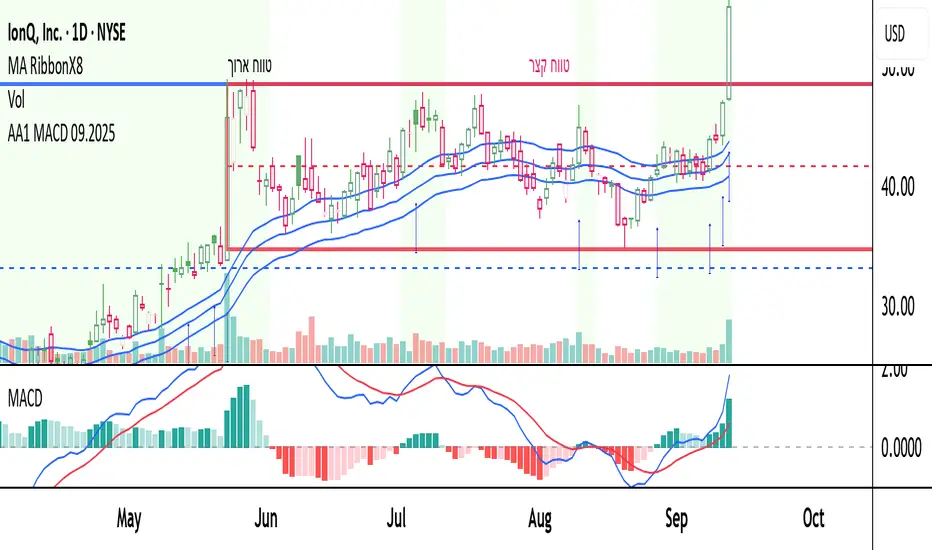
AA1 MACD 09.2025this is a learing project i want to share
the script is open for anyone
I combain some ema's mcad and more indicators to help find stocks in momentum
MACD Momentum Slowdown Alert (Bullish + Bearish)little arrows showing on chart when MACD histogram has a slowdown (change of color) in momentum

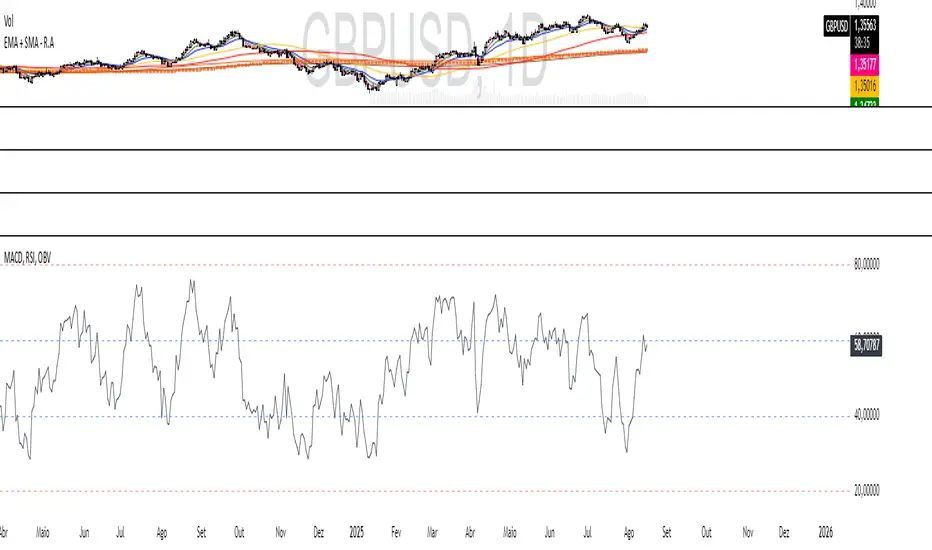
MACD, RSI, OBV - R.A TraderRudá Alves Trader - Custom Indicator
This indicator was developed for the students of Rudá Alves trader. It combines the OBV, RSI, and MACD oscillators into a single tool.
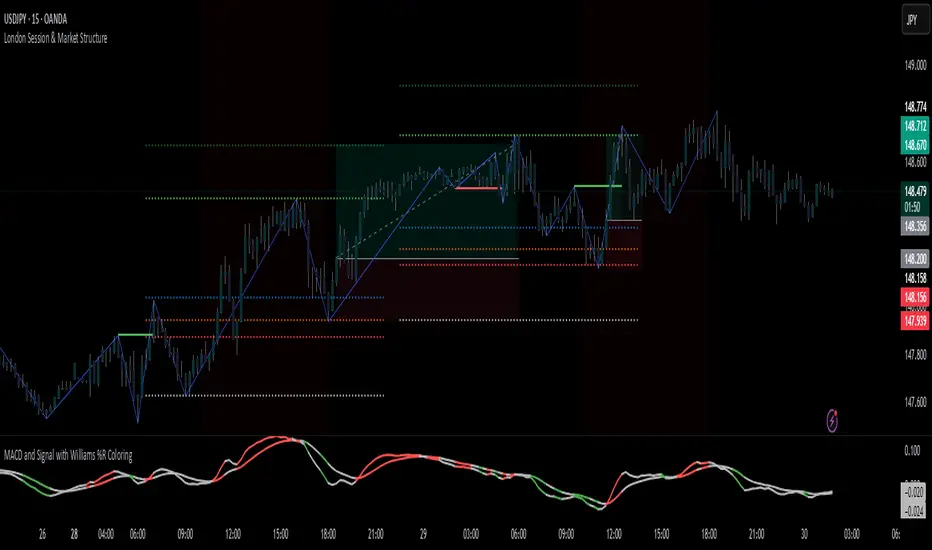
MACD Signal with Williams %R ColoringA simple fused indicator of 2, 1) MACD signal lines made colouring when 2) Williams % R is in overbought or oversold. not my own coding, just took two readily available indicators and coded them together.
Universal Sentiment Oscillator with Trade RecommendationsUniversal Sentiment Oscillator & Strategy Guide
Summary
This all-in-one indicator is designed to be a comprehensive co-pilot for your trading journey. It moves beyond simple buy/sell signals by analyzing the underlying market sentiment and providing a dynamic, risk-assessed guide of potential trading strategies. Whether you're a novice learning the ropes or an expert seeking confirmation, this tool provides a structured framework for making smarter, more informed decisions in stocks, options, and futures.
How It Works
The core of the indicator is the Sentiment Oscillator, which calculates a score from -5 (Extremely Bearish) to +5 (Extremely Bullish) on every bar. This isn't just a single measurement; it's a weighted aggregate of several key technical conditions:
Trend Analysis: Price position relative to the 20, 50, and 200 EMAs.
Momentum Analysis: The current RSI value.
Hybrid Analysis: The state of the MACD and its signal line.
These factors are intelligently combined and normalized to produce a single, intuitive sentiment score, giving you an at-a-glance understanding of the market's pulse.
Core Features
Dynamic Trade Recommendation Table:
The informational heart of the indicator. This on-chart table provides a list of potential trades perfectly aligned with the current sentiment score.
Risk-Ranked Strategies:
All suggested trades are logically ordered by risk, helping you quickly identify strategies that match your comfort level.
Adjusted Trade Suggestions:
The indicator analyzes sentiment momentum (the score vs. its signal line) to provide proactive, forward-looking trade ideas based on where the market might be heading next.
Customizable Trading Styles:
Tell the indicator if you are a Conservative, Neutral, or Aggressive trader, and the "Adjusted Trade Suggestion" will automatically tailor its recommendations to your personal risk preference.
Context-Aware Futures Mode:
When viewing a futures contract, enable this mode to switch all recommendations from stock/options to futures-specific actions (e.g., "Cautious Long," "Monitor Range").
Predictive Sentiment Cone:
Visualize the potential short-term path of sentiment based on current momentum, helping you anticipate future conditions.
Fully Customizable:
Every parameter—from EMA lengths to trade filters—can be adjusted, allowing you to fine-tune the indicator to your exact specifications.
How to Use This Indicator
This tool is flexible and can be integrated into many trading systems. Here is a powerful, professional approach:
Top-Down Analysis (for Swing or Position Trading):
Establish the Trend: Start on the higher timeframes (Monthly, Weekly, Daily). Use the oscillator's color and score to define the dominant, long-term market sentiment. You only want to look for trades that align with this macro trend.
Refine the Entry: Drop down to the medium timeframes (4-Hour, 1-Hour). Wait for the sentiment on these charts to come into alignment with the higher-timeframe trend. This pullback or consolidation is your "zone of interest."
Pinpoint the Execution: Move to a lower timeframe (e.g., 15-Minute). Use the Adjusted Trade Suggestion and Sentiment Momentum to find a precise entry as momentum begins to shift back in the direction of the primary trend. You can set alerts on the oscillator's zero-line for early warnings of a sentiment shift.
As a Confirmation Tool: If you have an existing trade idea, use the indicator to validate it. Does the sentiment score align with your bullish or bearish thesis? Does the momentum confirm that now is a good time to enter?
As an Idea Generation Tool: Unsure what to trade? Browse different assets and let the indicator's "Primary Trades" and "Adjusted Trade Suggestion" present you with a list of risk-assessed ideas that you can then investigate further.
Disclaimer: This is an analysis tool and should not be considered financial advice. All forms of trading involve substantial risk. You should not trade with money you cannot afford to lose. Always perform your own due diligence and use this indicator as one component of a complete trading plan.

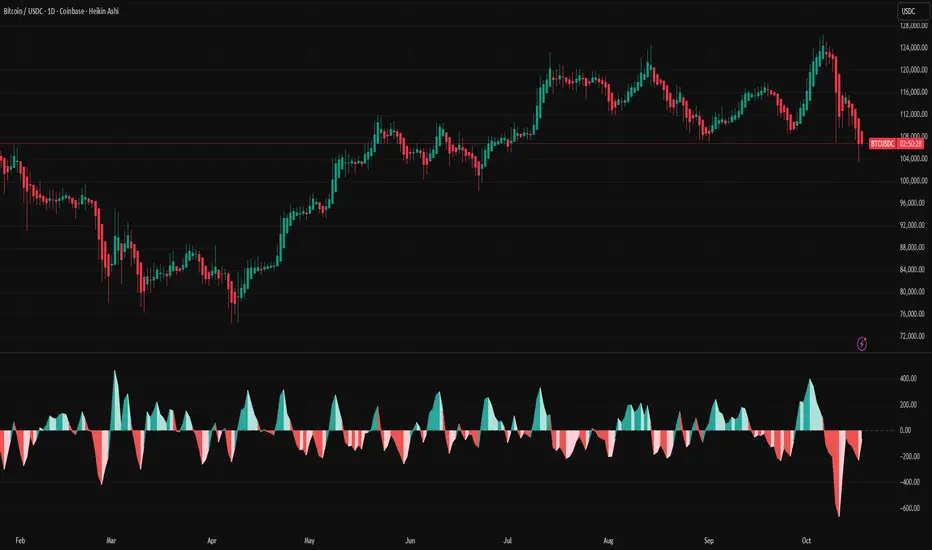
New Momentum H/LNew Momentum H/L shows when momentum, defined as the rate of price change over time, exceeds the highest or lowest values observed over a user-defined period. These events shows points where momentum reaches new extremes relative to that period, and the indicator plots a column to mark each occurrence.
Increase in momentum could indicate the start of a trend phase from a low volatile or balanced state. However in developed trends, extreme momentum could also mark potential climaxes which can lead to trend termination. This reflects the dual nature of the component.
This indicator is based on the MACD calculated as the difference between a 3-period and a 10-period simple moving average. New highs are indicated when this value exceeds all previous values within the lookback window; new lows when it drops below all previous values. The default lookback period is set to 40 bars, which corresponds with two months on a daily chart.
The indicator also computes a z-score of the MACD line over the past 100 bars. This standardization helps compare momentum across different periods and normalizes the values of current moves relative to recent history.
In practice, use the indicator to confirm presence of momentum at the start of a move from a balanced state (often following a volatility expansion), track how momentum develops inside of a trend structure and locate potential climactic events.
Momentum should in preference be interpreted from price movement. However, to measure and standardize provides structure and helps build more consistent models. This should be used in context of price structure and broader market conditions; as all other tools.
