FlowScape PredictorFlowScape Predictor is a non-repainting, regime-aware entry qualifier that turns complex market context into two readiness scores (Long & Short, each 0/25/50/75/100) and clean, confirmed-bar signals. It blends three orthogonal pillars so you act only when trend energy, momentum, and location agree:
Regime (energy): ATR-normalized linear-regression slope of a smooth HMA → EMA baseline, gated by ADX to confirm when pressure is meaningful.
Momentum (push): RSI slope alignment so price has directional follow-through, not just drift.
Structure (location): proximity to pivot-confirmed swings, scaled by ATR, so “ready” appears near constructive pullbacks—not mid-trend chases.
A soft ATR cloud wraps the baseline for context. A yellow Predictive Baseline extends beyond the last bar to visualize near-term trajectory. It is visual-only: scores/alerts never use it.
What you see
Baseline line that turns green/red when regime is strong in that direction; gray when weak.
ATR cloud around the baseline (context for stretch and pullbacks).
Scores (Long & Short, 0–100 in steps of 25) and optional “L/S” icons on bar close.
Yellow Predictive Baseline that extends to the right for a few bars (visual trajectory of the smoothed baseline).
The scoring system (simple and transparent)
Each side (Long/Short) sums four binary checks, 25 points each:
Regime aligned: trendStrong is true and LR slope sign favors that side.
Momentum aligned: RSI side (>50 for Long, <50 for Short) and RSI slope confirms direction.
Baseline side: price is above (Long) / below (Short) the baseline.
Location constructive: distance from the last confirmed pivot is healthy (ATR-scaled; not overstretched).
Valid totals are 0, 25, 50, 75, 100.
Best-quality signal: 100/0 (your side/opposite) on bar close.
Good, still valid: 75/0, especially when the missing block is only “location” right as price re-engages the cloud/baseline.
Avoid: 75/25 or any opposition > 0 in a weak (gray) regime.
The Predictive (Kalman) line — what it is and isn’t
The yellow line is a visual forward extension of the smoothed baseline to help you see the current trajectory and time pullback resumptions. It does not predict price and is excluded from scores and alerts.
How it’s built (plain English):
We maintain a one-dimensional Kalman state x as a smoothed estimate of the baseline. Each bar we observe the current baseline z.
The filter adjusts its trust using the Kalman gain K = P / (P + R) and updates:
x := x + K*(z − x), then P := (1 − K)*P + Q.
Q (process noise): Higher Q → expects faster change → tracks turns quicker (less smoothing).
R (measurement noise): Higher R → trusts raw baseline less → smoother, steadier projection.
What you control:
Lead (how many bars forward to draw).
Kalman Q/R (visual smoothness vs. responsiveness).
Toggle the line on/off if you prefer a minimal chart.
Important: The predictive line extends the baseline, not price. It’s a visual timing aid—don’t automate off it.
How to use (step-by-step)
Keep the chart clean and use a standard OHLC/candlestick chart.
Read the regime: Prefer trades with green/red baseline (trendStrong = true).
Check scores on bar close:
Take Long 100 / Short 0 or Long 75 / Short 0 when the chart shows a tidy pullback re-engaging the cloud/baseline.
Mirror the logic for shorts.
Confirm location: If price is > ~1.5 ATR from its reference pivot, let it come back—avoid chasing.
Set alerts: Add an alert on Long Ready or Short Ready; these fire on closed bars only.
Risk management: Use ATR-buffered stops beyond the recent pivot; target fixed-R multiples (e.g., 1.5–3.0R). Manage the trade with the baseline/cloud if you trail.
Best-practice playbook (quick rules)
Green light: 100/0 (best) or 75/0 (good) on bar close in a colored (non-gray) regime.
Location first: Prefer entries near the baseline/cloud right after a pullback, not far above/below it.
Avoid mixed signals: Skip 75/25 and anything with opposition while the baseline is gray.
Use the yellow line with discretion: It helps you see rhythm; it’s not a signal source.
Timeframes & tuning (practical defaults)
Intraday indices/FX (5m–15m): Demand 100/0 in chop; allow 75/0 when ADX is awake and pullback is clean.
Crypto intraday (15m–1h): Prefer 100/0; 75/0 on the first pullback after a regime turn.
Swing (1h–4h/D1): 75/0 is often sufficient; 100/0 is excellent (fewer but cleaner signals).
If choppy: raise ADX threshold, raise the readiness bar (insist on 100/0), or lengthen the RSI slope window.
What makes FlowScape different
Energy-first regime filter: ATR-normalized LR slope + ADX gate yields a consistent read of trend quality across symbols and timeframes.
Location-aware entries: ATR-scaled pivot proximity discourages mid-air chases, encouraging pullback timing.
Separation of concerns: The predictive line is visual-only, while scores/alerts are confirmed on close for non-repainting behavior.
One simple score per side: A single 0–100 readiness figure is easier to tune than juggling multiple indicators.
Transparency & limitations
Scores are coarse by design (25-point blocks). They’re a gatekeeper, not a promise of outcomes.
Pivots confirm after right-side bars, so structure signals appear after swings form (non-repainting by design).
Avoid using non-standard chart types (Heikin Ashi, Renko, Range, etc.) for signals; use a clean, standard chart.
No lookahead, no higher-timeframe requests; alerts fire on closed bars only.
Tìm kiếm tập lệnh với "OHLC"

Cumulative Volume Delta (SB-1) 2.0
📈 Cumulative Volume Delta (CVD) — Stair-Step + Threshold Alerts
🔍 Overview
This Cumulative Volume Delta (CVD) tool visualizes aggressive buying and selling pressure in the market by plotting candlestick-style bars based on volume delta. It helps traders understand which side — buyers or sellers — is exerting more control on lower timeframes and highlights momentum shifts through stair-step patterns and delta threshold breaks. Resets to zero at EOD
Ideal for futures traders, scalpers, and intraday strategists looking for orderflow-based confirmation.
🧠 What Is CVD?
CVD (Cumulative Volume Delta) measures the difference between market buys and sells over a specific timeframe. When the delta is rising, it suggests buyers are being more aggressive. Falling delta suggests seller dominance.
This script aggregates volume delta from a lower timeframe and plots it in a higher timeframe context, allowing you to track microstructure shifts within larger candles.
📊 Features
✅ CVD Candlesticks
Each bar represents volume delta as an OHLC-style candle using:
Open: Delta at the start of the bar
High/Low: Peak delta range
Close: Final delta value at bar close
Teal candles = Net buying pressure
Red candles = Net selling pressure
✅ Threshold Levels (Key Visual Zones)
The script includes horizontal dashed lines at:
+5,000 and +10,000 → Signify strong buying pressure
-5,000 and -10,000 → Signify strong selling pressure
0 line → Neutrality line (no net pressure)
These levels act as volume-based support/resistance zones and breakout confirmation tools. For example:
A CVD cross above +5,000 shows buyers taking control
A CVD cross above +10,000 implies strong bullish momentum
A CVD cross below -5,000 or -10,000 signals intense selling pressure
📈 Stair-Step Pattern Detection
Detects two specific volume-based continuation setups:
Bullish Stair-Step: Both the high and low of the CVD candle are higher than the previous candle
Bearish Stair-Step: Both the high and low of the CVD candle are lower than the previous candle
These patterns often appear during trending moves and serve as confirmation of strength or continuation.
Visual markers:
🟢 Green triangles below bars = Bullish stair-step
🔴 Red triangles above bars = Bearish stair-step
🔔 Alert Conditions
Get real-time alerts when:
Bullish Stair-Step is detected
Bearish Stair-Step is detected
CVD crosses above +5,000
CVD crosses below -5,000
📢 Alerts only trigger on crossover, not every time CVD remains above or below. This avoids repetitive notifications.
⚙️ Inputs & Customization
Anchor Timeframe: The higher timeframe to which CVD data is applied (default: 1D)
Lower Timeframe: The timeframe used to calculate the CVD delta (default: 5 minutes)
Optional Override: Use custom timeframe toggle to force your own micro timeframe
📌 How to Use This CVD Indicator (Step-by-Step Guide)
✅ 1. Confirm Bias Using the Zero Line
The zero line (0 CVD) represents neutral pressure — neither buyers nor sellers are dominating.
Use it as your first filter:
🔼 If CVD is above 0 and rising → Buyer control
🔽 If CVD is below 0 and falling → Seller control
🧠 Tip: CVD rising while price is consolidating may signal hidden buyer interest.
✅ 2. Watch for Crosses of Key Levels: +5,000 and +10,000
These levels act as momentum thresholds:
Level Signal Type What It Means
+5,000 Buyer breakout Buyers are starting to dominate
+10,000 Strong bull bias Strong institutional or algorithmic buying flow
-5,000 Seller breakout Sellers are taking control
-10,000 Strong bear bias Heavy selling pressure is entering the market
Wait for CVD to cross above +5K or below -5K to confirm the active side.
Use these crossovers as entry triggers, breakout confirmations, or trade filters.
🔔 Alerts fire only when the level is first crossed, not every bar above/below.
✅ 3. Use Stair-Step Patterns for Continuation Confirmation
The indicator shows stair-step patterns using triangle signals:
🟢 Green triangle below bar = Bullish stair-step
Suggests a higher high and higher low in delta → buyers stepping up
🔴 Red triangle above bar = Bearish stair-step
Suggests lower highs and lower lows in delta → selling pressure building
Use stair-step signals:
To confirm a continuation of trend
As an entry or add-on signal
Especially after a threshold breakout
🧠 Example: If CVD breaks above +5K and forms bullish stairs → confirms strong trend, ideal for momentum entries.
✅ 4. Combine with Price Action or Structure
CVD works best when used with price, not in isolation. For example:
📉 Price makes a new low but CVD doesn’t → potential bullish divergence
📈 CVD surges while price lags → buyers are absorbing, breakout likely
Use it with:
VWAP
Orderblocks
Liquidity sweeps
Break of market structure/MSS/BOS
✅ 5.
Set Anchor Timeframe = Daily
Set Lower Timeframe = 5 minutes (default)
This lets you:
See intraday flow inside daily bars
Confirm whether a daily candle is being built on net buying or selling
🧠 You’re essentially seeing intra-bar aggression within a bigger time structure.
🧭 Example Trading Setup
Bullish Scenario:
CVD is rising and above 0
CVD crosses above +5,000 → alert fires
Green stair-step appears
Price breaks local resistance or liquidity sweep completes
✅ Consider long entry with structure and CVD alignment
🎯 Place stops below last stair-step or structural low
📌 Final Notes
This tool does not repaint and is designed to work in real-time across all futures, crypto, and equity instruments that support volume data. If your symbol does not provide volume, the script will notify you.
Use it in confluence with VWAP, liquidity zones, or structure breaks for high-confidence trades.

Heikin Ashi VolumeHeikin Ashi candles decrease market noise so that broader trends can be more easily visualized. In a typical chart utilizing Heikin Ashi candles, volume bars are colored in such a way that they also allow for the visualization of trends during a bullish/bearish move.
The Heikin Ashi Volume indicator allows the trader to continue to use the same volume bar coloring technique to visualize trends without having to utilize the Heikin Ashi candles, since a Heikin Ashi candle’s OHLC values are not true prices but instead based on calculations in order to provide the ‘denoising’ effect they are known for.
In addition to providing the Heikin Ashi Volume coloring effects, the Heikin Ashi Volume indicator also allows the user to set a volume threshold level where the bar colors will be darker unless volume is beyond that threshold, helping traders quickly determine if there is enough participation in the market at that time to justify taking risk in a trade when the market isn’t very active. The user has the option to show or hide the threshold line, change the colors of the bullish/bearish colors (for both above and below threshold volumes) and the option for the indicator to gradually brighten the bar colors are they approach the threshold instead of having a clear line of demarcation showing volume above or below the set threshold.

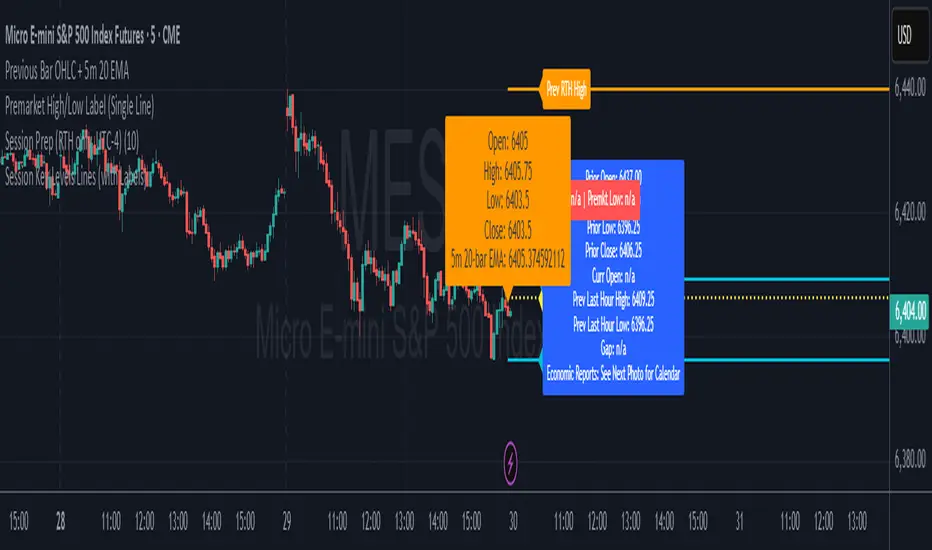
Session Prep (RTH only, UTC-4)This shows what you have to prepare before each session, including Previous session's OHLC, how much is being gapped up...etc. hope it helps :)
Date Marker GPTDate Marker GPT
By Jimmy Dimos (corrected by ChatGPT-o3)
Description
This overlay indicator automatically plots vertical lines at each weekly option-expiration timestamp (Friday at 3 PM CST) for both historical and upcoming periods, helping you visualize key expiration dates alongside your price action and regression tools. Shown is my Date Maker GPT vertical blue Lines, Linear Regression Channel(not part of my script) and zigzag++ also not part of my script.
⸻
Key Features
• Past Expirations: Draws 12 past Friday markers at 3 PM CST
• Future Expirations: Projects 12 upcoming Friday markers at 3 PM CST
• Timezone Handling: Uses UTC internally (21:00 UTC = 3 PM CST)
• Customizable: num_fridays_past and num_fridays_future inputs let you adjust how many weeks to display
⸻
How It Works
1. Timestamp Calculation
• Uses Pine Script’s dayofweek() and timestamp() functions to find each Friday at the target hour.
• Two helper functions, get_previous_friday() and get_next_friday(), compute offsets in days/weeks based on the current bar’s date.
2. Drawing Lines
• Loops through the specified number of weeks in the past and future.
• Calls line.new() for each expiration timestamp, extending lines across the entire chart.
⸻
Usage Tips
• Overlay this script on any OHLC chart to see how price tends to cluster around option expirations.
• Combine with a linear regression or trend-channel indicator to anticipate likely trading ranges leading into expiration.
• Tweak the num_fridays_past and num_fridays_future parameters to focus on shorter or longer horizons.
⸻
Disclaimer: This tool is provided for educational and analytical purposes only. It is not financial advice. Always conduct your own research and risk management.
BARTRADINGPREDV4Please note, that all of the indicators on the chart are working together. I am showing all of the indicators so that you might see the benefits of these indicators working as one. Do your own research. Trade smart. I code tools not advice. So please make decisions based on your trading style and knowledge. Use my scripts freely but please note they are protected by Mozilla.
Script Summary: BARTRADINGPREDV4
This Pine Script indicator is a comprehensive trading tool that overlays on your TradingView chart. It combines moving averages, regression channels, volume analysis, RSI filtering, and pattern recognition to assist in making trading decisions. It also provides a forward-looking projection to help anticipate future price movement.
Key Features & Logic
1. Moving Averages
HMA (High Moving Average): Simple moving average of the high price over a user-defined lookback period.
LMA (Low Moving Average): Simple moving average of the low price over the same period.
HLMA (High-Low Moving Average): The average of HMA and LMA, providing a midline reference.
2. RSI Filtering
Optionally enables a Relative Strength Index (RSI) filter to help avoid trades when the market is not trending strongly.
Only allows buy signals if RSI is above 50, and sell signals if RSI is below 50 (if enabled).
3. Signal Generation
BUY Signal: Triggered when HL2 (average of OHLC) crosses over LMA and (optionally) RSI > 50.
SELL Signal: Triggered when HL2 crosses under HMA and (optionally) RSI < 50.
XSB (Extra Strong Buy): HL2 crosses over HMA, is above HLMA, up volume is greater than down volume, and (optionally) RSI > 50.
XBS (Extra Strong Sell): HL2 crosses under LMA, is below HLMA, down volume is greater than up volume, and (optionally) RSI < 50.
Enable/Disable XSB/XBS: You can turn these signals on or off via script inputs.
4. Take Profit (TP) and Stop Loss (SL) Levels
TP and SL are dynamically calculated based on the difference between HMA and LMA, providing contextually relevant exit levels.
5. Regression Channel and Prediction
Linear Regression Line: Plots a regression line over the lookback period to show the underlying trend.
ATR Channel: Adds an upper and lower channel around the regression line using ATR (Average True Range) for a realistic prediction envelope.
Forward Projection: Projects the regression line forward by a user-defined number of bars, visually showing where the trend could extend if current momentum persists.
6. Pattern Recognition
Higher Highs/Lows and Lower Highs/Lows: Marks bars where new higher highs/lows or lower highs/lows are set, helping you spot trend continuation or reversal points.
7. Status Table
A table shows the current price’s relationship to HMA, HLMA, and LMA, color-coded for quick visual interpretation.
User Instructions
Inputs
Number of Lookback Bars: Sets the period for all moving averages and regression calculations.
Prediction Length: (Legacy; not used in current logic.)
TURN ON OR OFF XSB/XBS Signal: Toggle extra strong buy/sell signals.
Enable RSI Filter: Only allow signals when RSI is in the correct zone.
RSI Period: Sets the sensitivity of the RSI filter.
Table Position: Choose where the status table appears on your chart.
ATR Length & Multiplier: Control the width of the regression prediction channel.
Bars Forward (Projection): Number of bars to project the regression line into the future.
How to Use
Add the script to your TradingView chart.
Adjust inputs to suit your asset and timeframe.
Interpret signals:
BUY (B) and SELL (S): Appear as green/red labels below/above bars.
XSB (blue) and XBS (orange): Indicate extra strong buy/sell conditions.
HH/HL (green triangles): New higher highs/lows.
LH/LL (red triangles): New lower highs/lows.
Watch the regression channel: The yellow regression line shows the trend; the shaded band indicates expected volatility.
Check the projection: The dashed magenta line projects the regression trend forward, giving a visual target for price continuation.
Use the table: Quickly see if price is above or below each moving average.
Interpreting the Prediction Aspects
Regression Line & Channel
Regression Line (Yellow): Represents the best-fit line of price over the lookback period, showing overall trend direction.
ATR Channel: The upper and lower bands (yellow, semi-transparent) account for typical volatility, suggesting a range where price is likely to stay if the trend continues.
Forward Projection
Dashed Magenta Line: Projects the regression line forward by the specified number of bars, using the current slope. This is a trend continuation forecast—not a guarantee, but a statistically reasonable path if current conditions persist.
How to use: If price is respecting the regression trend and within the channel, the projection provides a visual target for where price might go in the near future.
TP/SL Levels
TP (Take Profit): Suggests a price target above the current HL2, based on recent volatility.
SL (Stop Loss): Suggests a protective stop below HL2.
Best Practices & Warnings
No indicator is perfect! Always combine signals with your own analysis and risk management.
Regression projection is not a crystal ball: It simply extends the current trend, which can and will change, especially after big news or at support/resistance.
Use on liquid, trending assets for best results.
Adjust lookback and ATR settings for your market and timeframe.
Summary Table Example
Price vs HMA vs HLMA vs LMA
43000 +100 +50 -20
Green: Price is above average (bullish).
Red: Price is below average (bearish).
Yellow: Price is very close to the average (neutral).
Final Notes
This script is designed to be a multi-tool for trend trading and prediction, combining classic and modern techniques. The forward projection helps visualize possible future price action, while signals and overlays keep you informed of trend shifts and trade opportunities.

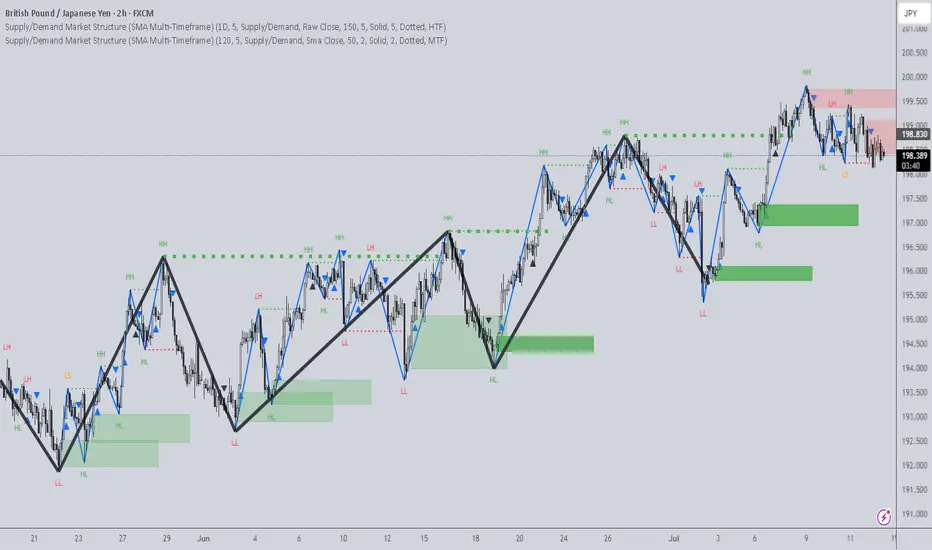
Supply/Demand Market Structure (SMA Multi-Timeframe)Supply/Demand Based Market Structure
Structure + Order Blocks from Synthetic SMA Candles
Overview:
The SMA Supply/Demand Market Structure indicator combines market structure analysis with supply/demand logic, powered by SMA-based synthetic candles . Instead of relying on raw candle data, this tool generates smoothed higher-timeframe candles using simple moving averages to identify more stable zones and cleaner structure shifts.
It detects bullish and bearish breaks of structure (BoS) , highlights swing points like HH, HL, LH, LL , and plots institutional-style supply and demand zones formed from aggressive rallies or drops. The result is a precise and noise-filtered view of market intent, perfect for trend-following or smart money strategies.
How It Works:
- Synthetic candles are created using SMA of OHLC values on your selected timeframe (HTF).
- A bullish break occurs when price closes above the high of the last bearish synthetic candle.
- A bearish break occurs when price closes below the low of the last bullish synthetic candle.
- Upon break confirmation:
- A demand zone is drawn using the last bearish candle.
- A supply zone is drawn using the last bullish candle.
- Each zone is extended forward for a user-defined number of bars and optionally deleted upon mitigation.
- Zigzag-based internal structure connects valid swing points and classifies them as HH, HL, LH, LL , including Liquidity Sweeps (LS) .
- BoS levels are highlighted with lines that automatically reset when new structure forms.
Key Features:
- Synthetic SMA Candles : Smooth and reliable structure from average-based HTF candles
- Break Modes : Choose between raw HTF closes or SMA closes for break logic
- Custom Timeframe Selection : Analyze structure across any HTF you choose
- Dynamic Supply/Demand Zones : Auto-plot boxes from valid rallies/drops
- Mitigation Detection : Optionally fade or delete zones when price trades through
- Zigzag Structure Mapping : Automatically connect structural highs/lows
- BoS Detection : Real-time breakout of swing points with visual confirmation
- Smart Labels : Marks HH, HL, LH, LL, and LS directly on the chart
- Multi-timeframe Alert System : Notify for all structural changes, BoS, and new zones
How to Use:
- Set your desired HTF and SMA Length for synthetic candle smoothing.
- Use SMA=1 for raw candles
- Select a Break Mode :
- Raw Close : Uses standard HTF close values
- SMA Close : Uses smoothed closes from SMA
- Watch for bullish or bearish breaks — zones are plotted when price confirms breakout structure.
- Use demand zones as long entry areas and supply zones as short setups on retests.
- Rely on internal shifts and zigzag swings to monitor structure continuity.
- Enable alerts for swing formations, BoS, and liquidity sweeps to trade hands-free.
Recommended Strategies:
- Smart Money & ICT Models : Use synthetic demand/supply + BoS for mitigation or continuation plays
- Swing Trading : Align with higher timeframe structure and use zones for entry triggers
- Trend Trading : Confirm structure alignment and wait for pullbacks into zones
- Reversal Entries : Trade structure breaks when zones fail and a BoS confirms the shift
Customization Options:
- Timeframe input for custom HTF control
- SMA Length to adjust candle smoothing
- Zone Style : Control zone color, transparency, and duration
- Structure Display : Toggle swing labels and zigzag visuals
- Alert Mode : Choose between LTF, MTF, or HTF alerts
Summary:
SMA Supply/Demand Market Structure provides a clean, flexible view of price structure and institutional intent by fusing market structure with SMA-based synthetic candles. It’s ideal for anyone seeking reduced noise, visually guided entries, and rule-based trading based on structural shifts and real-time demand/supply dynamics.
Fibonacci Retracement levels Automatically D/W/MIndicator Description: Fibonacci Retracement levels Automatically
Fibonacci retracement levels based on the day, week, month High Low range and Fibonacci retracement levels draws automatically .This Pine Script indicator is designed to plot Fibonacci retracement levels based on the high and low prices of a user-selected timeframe (Daily, Weekly, or Monthly). It identifies bullish or bearish candles in the chosen timeframe, draws key price levels, and overlays Fibonacci retracement lines and semi-transparent colored boxes to highlight potential support and resistance zones. The indicator dynamically updates with each new period and extends lines, labels, and boxes to the current bar for real-time visualization. Key Features
1. Timeframe Selection: Users can choose the timeframe for analysis: Daily, Weekly, or Monthly via an input dropdown. The indicator retrieves the open, high, low, and close prices for the selected timeframe using `request.security`.
2. High and Low Tracking : Tracks the highest high and lowest low within the selected timeframe. Stores these values and their corresponding bar indices in arrays (`whigh`, `wlow`, `whighIdx`,`wlowIdx`). Limits the array size to the most recent period to optimize performance.
3. Bullish and Bearish Candle Detection : Identifies whether the previous period’s candle is bullish (`close > open`) or bearish (`close < open`). Uses this to determine the direction for Fibonacci retracement calculations. Bullish candle: Fibonacci levels are drawn from low to high
Bearish candle: Fibonacci levels are drawn from high to low
4. Fibonacci Retracement Levels : Plots Fibonacci levels at 0.236, 0.382, 0.5, 0.618, and 0.786 between the high and low of the period. For bullish candles, levels are calculated from the low (support) to the high (resistance). For bearish candles, levels are calculated from the high (resistance) to the low (support). Each Fibonacci level is drawn as a horizontal line with a unique color:
- 0.236: Blue
- 0.382: Purple
- 0.5: Yellow
- 0.618: Teal
- 0.786: Fuchsia
5. Visual Elements: - High/Low Lines and Labels: Draws a red line and label for the previous period’s high. Draws a green line and label for the previous period’s low. Fibonacci Lines and Labels: Each Fibonacci level has a horizontal line and a label displaying the ratio.
Colored Boxes: Semi-transparent boxes are drawn between consecutive Fibonacci levels (including high and low) to highlight zones.
6. Dynamic Updates:
- At the start of a new period (e.g., new week for Weekly timeframe), the indicator:
- Clears previous Fibonacci lines, labels, and boxes.
- Recalculates the high and low for the new period.
- Redraws lines, labels, and boxes based on the new data.
- Extends all lines, labels, and boxes to the current bar index for real-time tracking.
7. Performance Optimization:
- Deletes old lines, labels, and boxes to prevent clutter.
- Limits the storage of highs and lows to the most recent period.
How It Works
1. Initialization: Defines variables for tracking bullish/bearish candles, lines, labels, and arrays for Fibonacci levels and boxes. Sets up color arrays for Fibonacci lines and boxes with distinct, semi-transparent colors.
2. Data Collection: Fetches the previous period’s OHLC (open, high, low, close) using `request.security`. Detects new periods (e.g., new week or month) using `ta.change(time(tf))`.
3. Fibonacci Calculation: On a new period, stores the high and low prices and their bar indices.
- Identifies the maximum high and minimum low from the stored data. - Calculates Fibonacci levels based on the range (`maxHigh - minLow`) and the direction (bullish or bearish).
4. Drawing:
- Draws high/low lines and labels at the identified price levels. Plots Fibonacci retracement lines and labels for each ratio. Creates semi-transparent boxes between Fibonacci levels to visually distinguish zones.
5. Updates:
- Extends all lines, labels, and boxes to the current bar index when a new period is detected. Clears old Fibonacci elements to avoid overlap and ensure clarity.
Usage
- Purpose: This indicator is useful for traders who use Fibonacci retracement levels to identify potential support and resistance zones in financial markets.
- Application:
- Select the desired timeframe (Daily, Weekly, Monthly) via the input settings.
- The indicator automatically plots the previous period’s high/low and Fibonacci levels on the chart.
- Use the labeled Fibonacci levels and colored boxes to identify key price zones for trading decisions.
- Customization:
- Modify the `timeframe` input to switch between Daily, Weekly, or Monthly analysis.
- Adjust the `fibLineColors` and `fibFillColors` arrays to change the visual appearance of lines and boxes.
- The indicator is designed for use on TradingView with Pine Script.
- The maximum array size for highs/lows is limited to 1 period in this version (can be adjusted by modifying the `array.shift` logic).
- The indicator dynamically updates with each new period, ensuring real-time relevance.
This indicator make educational purpose use only

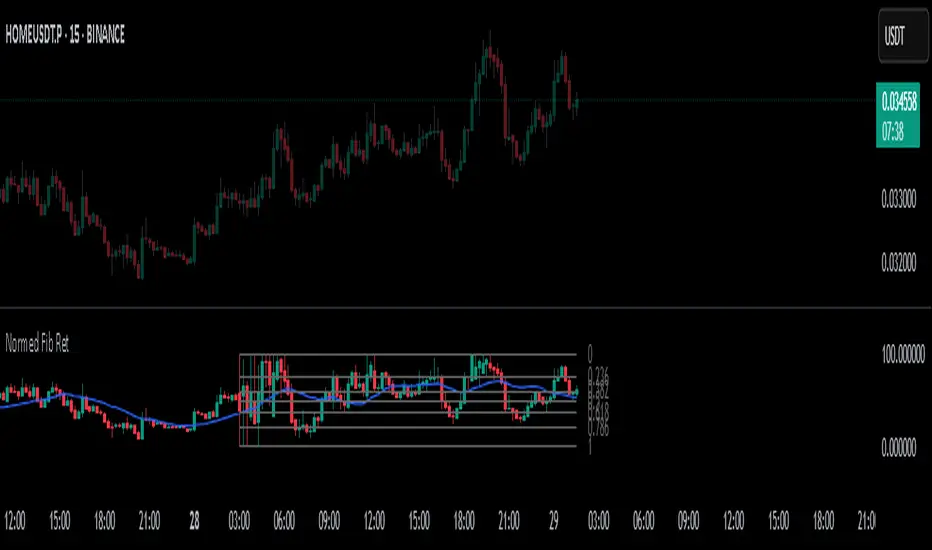
Normalized Fibonacci Retracement (MTF/LOG)A question: Instead of creating indicators that constantly plot Fibonacci Retracement levels in a visually overwhelming way, why don't we redefine them on a different scale? 🤨
Overview
The Normalized Fibonacci Retracement indicator converts price data to a 0-100 scale based on the selected timeframe's high-low range, displaying normalized candlesticks alongside standard Fibonacci levels (23.6%, 38.2%, 50%, 61.8%, 78.6%). This normalization reveals patterns that may be hidden in absolute price charts and allows consistent analysis across different instruments.
Originality
By normalizing prices to percentages, this indicator enables pattern recognition independent of absolute price levels. The same formation at $10-$20 and $1000-$2000 appears identical on the normalized scale, helping traders identify recurring structures across various assets and timeframes.
Concepts
The indicator uses a simple formula to transform price data into percentages. This creates a bounded scale where patterns become comparable regardless of the underlying asset's price range. The normalized view often reveals symmetries and relationships not visible in traditional price charts.
Mechanics
The system tracks highs and lows within the selected timeframe as anchor points. When a new period begins, fresh boundaries are established and prices recalculated. Trend direction is determined by timing of extremes. Linear scaling uses direct percentage calculation, while logarithmic scaling applies exponential interpolation for assets with large percentage moves.
Functions
Timeframe Selection: Higher timeframe analysis on any chart resolution
Normalized Display: OHLC data converted to 0-100 percentage scale
Fibonacci Levels: Standard retracement levels plotted automatically
Scaling Options: Linear or logarithmic calculation methods
Pattern Recognition: Reveals formations hidden in absolute price charts
Moving Average: Optional 20-period SMA overlay
Notes
Ensure chart data covers the full selected timeframe for accurate calculations. Use logarithmic scaling for volatile assets with large percentage moves. The normalized scale is effective at revealing patterns and structures that remain consistent across different price ranges, making it particularly useful for comparative analysis and pattern-based trading strategies.
I hope it helps everyone. Do not forget to manage your risk. And trade as safely as possible. Best of luck!
Volume-Confirmed Price Momentum# **Volume-Confirmed Price Momentum (VCPM) Indicator**
## **🔍 Overview**
Introducing the **Volume-Confirmed Price Momentum (VCPM)**, a sophisticated dual-metric indicator designed to identify high-probability momentum moves by analyzing the relationship between price action and volume dynamics. This indicator combines correlation analysis with volume strength validation to filter out weak signals and highlight institutional-backed movements.
---
## **⚙️ Core Mechanics**
**Price-Volume Correlation Engine:**
- Calculates real-time correlation between price movements and volume
- Configurable lookback period (default: 8 bars)
- Option to use price changes or absolute values
- Correlation range: -1.0 (perfect negative) to +1.0 (perfect positive)
**Volume Strength Analyzer:**
- Compares current volume against its moving average (default: 128 periods)
- Normalizes volume ratio to 0-1 scale for consistent interpretation
- Identifies when volume significantly exceeds historical norms
---
## **📊 Signal Generation**
### **🟢 Bullish Confirmation Signal**
**Trigger:** Positive correlation > 0.6 + Volume ratio > 0.5
- Price and volume moving in harmony upward
- Above-average volume confirms the move
- Indicates strong institutional buying interest
### **🔴 Bearish Confirmation Signal**
**Trigger:** Negative correlation < -0.6 + Volume ratio > 0.5
- Price declining with increasing volume
- Suggests distribution or institutional selling
- High-confidence bearish momentum
---
## **🎯 Trading Applications**
**Breakout Validation:**
Filter false breakouts by requiring volume confirmation before entering positions.
**Trend Continuation:**
Identify when existing trends have strong volume backing for continuation plays.
**Distribution Detection:**
Spot potential tops when price struggles despite high volume (negative correlation).
**Entry Timing:**
Built-in alert system notifies when both conditions align for optimal entry points.
---
## **🔧 Customization Features**
- **Correlation Period:** Adjust sensitivity (2-500 bars)
- **Volume Averaging:** Modify volume comparison timeframe
- **Alert Thresholds:** Fine-tune correlation and volume ratio triggers
- **Visual Options:** Toggle volume histogram display
- **Price Source:** Choose from OHLC or custom sources
---
## **💡 Why VCPM Works**
Traditional momentum indicators often generate false signals during low-volume periods. VCPM solves this by requiring **dual confirmation**: price momentum must be supported by corresponding volume activity. This approach:
- Reduces whipsaws and false breakouts
- Identifies institutional participation
- Provides higher conviction trade setups
- Works across all timeframes and markets
---
## **📈 Best Use Cases**
✅ **Crypto markets** (high volatility, volume-driven)
✅ **Stock breakouts** (earnings, news events)
✅ **Forex majors** (during high-impact news)
✅ **Futures trading** (momentum confirmation)
---
## **⚠️ Important Notes**
- Works best in liquid markets with consistent volume data
- Combine with support/resistance levels for enhanced accuracy
- Consider market context (trending vs. ranging conditions)
- Not recommended for extremely low-volume periods
---
## **🚀 Getting Started**
1. Add VCPM to your chart as a sub-panel indicator
2. Configure correlation threshold (start with 0.6)
3. Set volume ratio threshold (start with 0.5)
4. Enable alerts for automated signal detection
5. Backtest on your preferred timeframe and instrument
---
**Ready to enhance your momentum trading with volume confirmation? Try VCPM and experience the difference institutional-backed signals can make in your trading results.**
*Available in Pine Script v6 - Compatible with all TradingView accounts*

Catnobi Neon ThemeCatnobi Neon Theme 80 — A Purely Visual Candle-Glow Overlay (Open-Source)
What the script does
Catnobi Neon Theme 80 swaps the regular candle view for a vivid neon-glow style:
Candles (body + wicks) show up in bright turquoise when the bar closes up and in bright amber when it closes down.
Glow halo A soft, semi-transparent outline surrounds every candle, giving the impression of neon light.
Volume histogram Bars use the same palette as the candles so the entire chart keeps a consistent, cyber-punk colour scheme.
The script contains no trading signals, alerts, or calculations—it is purely decorative.
How it works (high-level)
Dual plot() technique – Each candle is drawn twice:
an enlarged, low-opacity outline creates the halo;
a second, normal-width layer renders the actual candle.
plotcandle() core – Price is still displayed with Pine’s built-in candle plotting, so the visual effect never distorts OHLC values.
Volume overlay – A simple plot() of volume with the same colour map keeps chart styling unified.
Because only basic Pine primitives are used, the script is light on resources and responsive even on lower-end machines.
Inputs / Settings
Input name Purpose Range / type Default
Theme Pick one of five curated colour sets 1 – 5 3
Glow width Thickness of the halo line (pixels) 1 – 10 4 px
Glow opacity Halo transparency 0 – 100 % 70 %
Hide volume Toggle neon volume bars true/false false
All colours are defined in HSL space, so you can easily tweak hues without losing contrast.
How to use it
Switch to a dark chart background – The glow effect is optimised for dark hex #0e0e0e, but any dark theme works.
Add Catnobi Neon Theme 80 as an overlay indicator.
(Optional) Hide the native candles via Chart settings ▸ Symbol ▸ Bar color opacity = 0 %.
Experiment with Theme, Glow width, and Glow opacity until the style matches your preference.
Why it qualifies for publication
Open-source – Code is fully visible, so the script does not fall under the “closed-source needs unique logic” rule.
Originality is visual, not trading – There are many indicator strategies, but very few lightweight, purely aesthetic glow overlays that rely solely on stock Pine functions.
Clear description – Users know exactly what to expect (no hidden buy/sell logic) and how the glow is generated.
MIT License
This script is released under the MIT licence. Feel free to fork, adapt, or redistribute—just keep the original author attribution somewhere in your code header.
The script is intended for traders who enjoy a cyber-punk vibe on their charts without compromising clarity or performance. Happy glowing!
Aftershock Playbook: Stock Earnings Drift EngineStrategy type
Event-driven post-earnings momentum engine (long/short) built for single-stock charts or ADRs that publish quarterly results.
What it does
Detects the exact earnings bar (request.earnings, lookahead_off).
Scores the surprise and launches a position on that candle’s close.
Tracks PnL: if the first leg closes green, the engine automatically re-enters on the very next bar, milking residual drift.
Blocks mid-cycle trades after a loss until the next earnings release—keeping the risk contained to one cycle.
Think of it as a sniper that fires on the earnings pop, reloads once if the shot lands, then goes silent until the next report.
Core signal inputs
Component Default Purpose
EPS Surprise % +0 % / –5 % Minimum positive / negative shock to trigger longs/shorts.
Reverse signals? Off Quick flip for mean-reversion experiments.
Time Risk Mgt. Off Optional hard exit after 45 calendar days (auto-scaled to any TF).
Risk engine
ATR-based stop (ATR × 2 by default, editable).
Bar time stop (15-min → Daily: Have to select the bar value ).
No pyramiding beyond the built-in “double-tap”.
All positions sized as % of equity via Strategy Properties.
Visual aids
Yellow triangle marks the earnings bar.
Diagnostics table (top-right) shows last Actual, Estimate, and Surprise %.
Status-line tool-tips on every input.
Default inputs
Setting Value
Positive surprise ≥ 0 %
Negative surprise ≤ –5 %
ATR stop × 2
ATR length 50
Hold horizon 350 ( 1h timeframe chart bars)
Back-test properties
Initial capital 10 000
Order size 5 % of equity
Pyramiding 1 (internal re-entry only)
Commission 0.03 %
Slippage 5 ticks
Fills Bar magnifier ✔ · On bar close ✔ · Standard OHLC ✔
How to use
Add the script to any earnings-driven stock (AAPL, MSFT, TSLA…).
Turn on Time Risk Management if you want stricter risk management
Back-test different ATR multipliers to fit the stock’s volatility.
Sync commission & slippage with your broker before forward-testing.
Important notes
Works on every timeframe from 15 min to 1 D. Sweet spot around 30min/1h
All request.earnings() & request.security() calls use lookahead_off—zero repaint.
The “double-tap” re-entry occurs once per winning cycle to avoid drift-chasing loops.
Historical stats ≠ future performance. Size positions responsibly.

Percent Change of Range Candles - FullPercent Change of Range Candles – Full (PCR Full)
Description:
PCR Full is a custom momentum indicator that measures the percentage price change relative to a defined range, offering traders a unique way to evaluate strength, direction, and potential reversals in price movement.
How it works:
The main value (PCR) is calculated by comparing the price change over a selected number of candles (length) to the range between the highest high and lowest low in the same period.
This percentage change is normalized and visualized with dynamic candles on the subgraph.
Reference levels at +100, +50, 0, -50, and -100 serve as key zones to indicate potential overbought/oversold conditions, continuation, or neutrality.
How to read the indicator:
1. Trend continuation:
When PCR breaks above +50 and holds, it often confirms a strong bullish move.
Similarly, values below -50 and staying low signal a bearish continuation.
2. Wick behavior (volatility insight):
Long wicks on PCR candles suggest uncertainty or failed breakout attempts.
Short or no wicks with strong body color show stable momentum and conviction.
On the chart, multiple long wicks near -50 suggest bulls are attempting to push price upward, but lack the strength — until a confirmed breakout.
3. Polarity transition (Bearish to Bullish or vice versa):
A transition from negative PCR values to above zero shows that the market is possibly turning.
Especially if PCR climbs gradually and stabilizes above zero, it indicates a developing bullish phase.
Components:
Main PCR line: Color-coded (green for rising, red for falling).
Open Average (gray line): Smooths recent PCR values, indicating balance.
High/Low adaptive bands: Adjust dynamically to PCR polarity.
PCR Candles: Visualize OHLC of PCR data for enhanced interpretation.
Suggested use cases:
Enter trend trades when PCR crosses +50 or -50 with volume or price confirmation.
Watch for reversal signs near ±100 if PCR fails to break further.
Use 0 line as a neutral zone — markets hovering near 0 are often in consolidation.
Combine with price action or oscillators like RSI/MACD for additional signals.
Customization:
The length input allows users to define the range for PCR calculations, making it adjustable to various timeframes and strategies (scalping, intraday, swing).

Faster Heikin AshiFaster Heikin Ashi
The Faster Heikin Ashi improves traditional Heikin Ashi candles by introducing advanced weighting mechanisms and lag reduction techniques. While maintaining the price smoothing benefits of standard Heikin Ashi, this enhanced version delivers faster signals and responsiveness.
Key Features
Unified Responsiveness Control
Single parameter (0.1 - 1.0) controls all responsiveness aspects
Eliminates conflicting settings found in other enhanced HA indicators
Intuitive scaling from conservative (0.1) to highly responsive (1.0)
Advanced Weighted Calculations
Smart Close Weighting: Close prices receive 2-3x more influence for faster trend detection
Dynamic OHLC Processing: All price components are intelligently weighted based on responsiveness setting
Balanced High/Low Emphasis: Maintains price level accuracy while improving speed
Enhanced Open Calculation
Transition Speed: Open prices "catch up" to market movements faster
Lag Reduction Algorithm: Eliminates the typical delay in Heikin Ashi open calculations
Smooth Integration: Maintains visual continuity while improving responsiveness
Four-Color Scheme
- 🟢 **Lime**: Strong bullish momentum
- 🔴 **Red**: Strong bearish momentum
- 🟢 **Green**: Moderate bullish
- 🔴 **Maroon**: Moderate bearish
How It Works
Traditional Heikin Ashi smooths price action but often lags behind real market movements. This enhanced version:
1. Weights price components based on their predictive value
2. Accelerates trend transitions through advanced open calculations
3. Scales all enhancements through a single responsiveness parameter
4. Maintains smoothing benefits while reducing lag
Responsiveness (0.1 - 1.0)
0.1 - 0.3: Conservative, maximum smoothing
0.4 - 0.6: Balanced, good for swing trading and trend following
0.7 - 1.0: Aggressive, fast signals, suitable for scalping and active trading

light_logLight Log - A Defensive Programming Library for Pine Script
Overview
The Light Log library transforms Pine Script development by introducing structured logging and defensive programming patterns typically found in enterprise languages like C#. This library addresses a fundamental challenge in Pine Script: the lack of sophisticated error handling and debugging tools that developers expect when building complex trading systems.
At its core, Light Log provides three transformative capabilities that work together to create more reliable and maintainable code. First, it wraps all native Pine Script types in error-aware containers, allowing values to carry validation state alongside their data. Second, it offers a comprehensive logging system with severity levels and conditional rendering. Third, it includes defensive programming utilities that catch errors early and make code self-documenting.
The Philosophy of Errors as Values
Traditional Pine Script error handling relies on runtime errors that halt execution, making it difficult to build resilient systems that can gracefully handle edge cases. Light Log introduces a paradigm shift by treating errors as first-class values that flow through your program alongside regular data.
When you wrap a value using Light Log's type system, you're not just storing data – you're creating a container that can carry both the value and its validation state. For example, when you call myNumber.INT() , you receive an INT object that contains both the integer value and a Log object that can describe any issues with that value. This approach, inspired by functional programming languages, allows errors to propagate through calculations without causing immediate failures.
Consider how this changes error handling in practice. Instead of a calculation failing catastrophically when it encounters invalid input, it can produce a result object that contains both the computed value (which might be na) and a detailed log explaining what went wrong. Subsequent operations can check has_error() to decide whether to proceed or handle the error condition gracefully.
The Typed Wrapper System
Light Log provides typed wrappers for every native Pine Script type: INT, FLOAT, BOOL, STRING, COLOR, LINE, LABEL, BOX, TABLE, CHART_POINT, POLYLINE, and LINEFILL. These wrappers serve multiple purposes beyond simple value storage.
Each wrapper type contains two fields: the value field v holds the actual data, while the error field e contains a Log object that tracks the value's validation state. This dual nature enables powerful programming patterns. You can perform operations on wrapped values and accumulate error information along the way, creating an audit trail of how values were processed.
The wrapper system includes convenient methods for converting between wrapped and unwrapped values. The extension methods like INT() , FLOAT() , etc., make it easy to wrap existing values, while the from_INT() , from_FLOAT() methods extract the underlying values when needed. The has_error() method provides a consistent interface for checking whether any wrapped value has encountered issues during processing.
The Log Object: Your Debugging Companion
The Log object represents the heart of Light Log's debugging capabilities. Unlike simple string concatenation for error messages, the Log object provides a structured approach to building, modifying, and rendering diagnostic information.
Each Log object carries three essential pieces of information: an error type (info, warning, error, or runtime_error), a message string that can be built incrementally, and an active flag that controls conditional rendering. This structure enables sophisticated logging patterns where you can build up detailed diagnostic information throughout your script's execution and decide later whether and how to display it.
The Log object's methods support fluent chaining, allowing you to build complex messages in a readable way. The write() and write_line() methods append text to the log, while new_line() adds formatting. The clear() method resets the log for reuse, and the rendering methods ( render_now() , render_condition() , and the general render() ) control when and how messages appear.
Defensive Programming Made Easy
Light Log's argument validation functions transform how you write defensive code. Instead of cluttering your functions with verbose validation logic, you can use concise, self-documenting calls that make your intentions clear.
The argument_error() function provides strict validation that halts execution when conditions aren't met – perfect for catching programming errors early. For less critical issues, argument_log_warning() and argument_log_error() record problems without stopping execution, while argument_log_info() provides debug visibility into your function's behavior.
These functions follow a consistent pattern: they take a condition to check, the function name, the argument name, and a descriptive message. This consistency makes error messages predictable and helpful, automatically formatting them to show exactly where problems occurred.
Building Modular, Reusable Code
Light Log encourages a modular approach to Pine Script development by providing tools that make functions more self-contained and reliable. When functions validate their inputs and return wrapped values with error information, they become true black boxes that can be safely composed into larger systems.
The void_return() function addresses Pine Script's requirement that all code paths return a value, even in error handling branches. This utility function provides a clean way to satisfy the compiler while making it clear that a particular code path should never execute.
The static log pattern, initialized with init_static_log() , enables module-wide error tracking. You can create a persistent Log object that accumulates information across multiple function calls, building a comprehensive diagnostic report that helps you understand complex behaviors in your indicators and strategies.
Real-World Applications
In practice, Light Log shines when building sophisticated trading systems. Imagine developing a complex indicator that processes multiple data streams, performs statistical calculations, and generates trading signals. With Light Log, each processing stage can validate its inputs, perform calculations, and pass along both results and diagnostic information.
For example, a moving average calculation might check that the period is positive, that sufficient data exists, and that the input series contains valid values. Instead of failing silently or throwing runtime errors, it can return a FLOAT object that contains either the calculated average or a detailed explanation of why the calculation couldn't be performed.
Strategy developers benefit even more from Light Log's capabilities. Complex entry and exit logic often involves multiple conditions that must all be satisfied. With Light Log, each condition check can contribute to a comprehensive log that explains exactly why a trade was or wasn't taken, making strategy debugging and optimization much more straightforward.
Performance Considerations
While Light Log adds a layer of abstraction over raw Pine Script values, its design minimizes performance impact. The wrapper objects are lightweight, containing only two fields. The logging operations only consume resources when actually rendered, and the conditional rendering system ensures that production code can run with logging disabled for maximum performance.
The library follows Pine Script best practices for performance, using appropriate data structures and avoiding unnecessary operations. The var keyword in init_static_log() ensures that persistent logs don't create new objects on every bar, maintaining efficiency even in real-time calculations.
Getting Started
Adopting Light Log in your Pine Script projects is straightforward. Import the library, wrap your critical values, add validation to your functions, and use Log objects to track important events. Start small by adding logging to a single function, then expand as you see the benefits of better error visibility and code organization.
Remember that Light Log is designed to grow with your needs. You can use as much or as little of its functionality as makes sense for your project. Even simple uses, like adding argument validation to key functions, can significantly improve code reliability and debugging ease.
Transform your Pine Script development experience with Light Log – because professional trading systems deserve professional development tools.
Light Log Technical Deep Dive: Advanced Patterns and Architecture
Understanding Errors as Values
The concept of "errors as values" represents a fundamental shift in how we think about error handling in Pine Script. In traditional Pine Script development, errors are events – they happen at a specific moment in time and immediately interrupt program flow. Light Log transforms errors into data – they become information that flows through your program just like any other value.
This transformation has profound implications. When errors are values, they can be stored, passed between functions, accumulated, transformed, and inspected. They become part of your program's data flow rather than exceptions to it. This approach, popularized by languages like Rust with its Result type and Haskell with its Either monad, brings functional programming's elegance to Pine Script.
Consider a practical example. Traditional Pine Script might calculate a momentum indicator like this:
momentum = close - close
If period is invalid or if there isn't enough historical data, this calculation might produce na or cause subtle bugs. With Light Log's approach:
calculate_momentum(src, period)=>
result = src.FLOAT()
if period <= 0
result.e.write("Invalid period: must be positive", true, ErrorType.error)
result.v := na
else if bar_index < period
result.e.write("Insufficient data: need " + str.tostring(period) + " bars", true, ErrorType.warning)
result.v := na
else
result.v := src - src
result.e.write("Momentum calculated successfully", false, ErrorType.info)
result
Now the function returns not just a value but a complete computational result that includes diagnostic information. Calling code can make intelligent decisions based on both the value and its associated metadata.
The Monad Pattern in Pine Script
While Pine Script lacks the type system features to implement true monads, Light Log brings monadic thinking to Pine Script development. The wrapped types (INT, FLOAT, etc.) act as computational contexts that carry both values and metadata through a series of transformations.
The key insight of monadic programming is that you can chain operations while automatically propagating context. In Light Log, this context is the error state. When you have a FLOAT that contains an error, operations on that FLOAT can check the error state and decide whether to proceed or propagate the error.
This pattern enables what functional programmers call "railway-oriented programming" – your code follows a success track when all is well but can switch to an error track when problems occur. Both tracks lead to the same destination (a result with error information), but they take different paths based on the validity of intermediate values.
Composable Error Handling
Light Log's design encourages composition – building complex functionality from simpler, well-tested components. Each component can validate its inputs, perform its calculation, and return a result with appropriate error information. Higher-level functions can then combine these results intelligently.
Consider building a complex trading signal from multiple indicators:
generate_signal(src, fast_period, slow_period, signal_period) =>
log = init_static_log(ErrorType.info)
// Calculate components with error tracking
fast_ma = calculate_ma(src, fast_period)
slow_ma = calculate_ma(src, slow_period)
// Check for errors in components
if fast_ma.has_error()
log.write_line("Fast MA error: " + fast_ma.e.message, true)
if slow_ma.has_error()
log.write_line("Slow MA error: " + slow_ma.e.message, true)
// Proceed with calculation if no errors
signal = 0.0.FLOAT()
if not (fast_ma.has_error() or slow_ma.has_error())
macd_line = fast_ma.v - slow_ma.v
signal_line = calculate_ma(macd_line, signal_period)
if signal_line.has_error()
log.write_line("Signal line error: " + signal_line.e.message, true)
signal.e := log
else
signal.v := macd_line - signal_line.v
log.write("Signal generated successfully")
else
signal.e := log
signal.v := na
signal
This composable approach makes complex calculations more reliable and easier to debug. Each component is responsible for its own validation and error reporting, and the composite function orchestrates these components while maintaining comprehensive error tracking.
The Static Log Pattern
The init_static_log() function introduces a powerful pattern for maintaining state across function calls. In Pine Script, the var keyword creates variables that persist across bars but are initialized only once. Light Log leverages this to create logging objects that can accumulate information throughout a script's execution.
This pattern is particularly valuable for debugging complex strategies where you need to understand behavior across multiple bars. You can create module-level logs that track important events:
// Module-level diagnostic log
diagnostics = init_static_log(ErrorType.info)
// Track strategy decisions across bars
check_entry_conditions() =>
diagnostics.clear() // Start fresh each bar
diagnostics.write_line("Bar " + str.tostring(bar_index) + " analysis:")
if close > sma(close, 20)
diagnostics.write_line("Price above SMA20", false)
else
diagnostics.write_line("Price below SMA20 - no entry", true, ErrorType.warning)
if volume > sma(volume, 20) * 1.5
diagnostics.write_line("Volume surge detected", false)
else
diagnostics.write_line("Normal volume", false)
// Render diagnostics based on verbosity setting
if debug_mode
diagnostics.render_now()
Advanced Validation Patterns
Light Log's argument validation functions enable sophisticated precondition checking that goes beyond simple null checks. You can implement complex validation logic while keeping your code readable:
validate_price_data(open_val, high_val, low_val, close_val) =>
argument_error(na(open_val) or na(high_val) or na(low_val) or na(close_val),
"validate_price_data", "OHLC values", "contain na values")
argument_error(high_val < low_val,
"validate_price_data", "high/low", "high is less than low")
argument_error(close_val > high_val or close_val < low_val,
"validate_price_data", "close", "is outside high/low range")
argument_log_warning(high_val == low_val,
"validate_price_data", "high/low", "are equal (no range)")
This validation function documents its requirements clearly and fails fast with helpful error messages when assumptions are violated. The mix of errors (which halt execution) and warnings (which allow continuation) provides fine-grained control over how strict your validation should be.
Performance Optimization Strategies
While Light Log adds abstraction, careful design minimizes overhead. Understanding Pine Script's execution model helps you use Light Log efficiently.
Pine Script executes once per bar, so operations that seem expensive in traditional programming might have negligible impact. However, when building real-time systems, every optimization matters. Light Log provides several patterns for efficient use:
Lazy Evaluation: Log messages are only built when they'll be rendered. Use conditional logging to avoid string concatenation in production:
if debug_mode
log.write_line("Calculated value: " + str.tostring(complex_calculation))
Selective Wrapping: Not every value needs error tracking. Wrap values at API boundaries and critical calculation points, but use raw values for simple operations:
// Wrap at boundaries
input_price = close.FLOAT()
validated_period = validate_period(input_period).INT()
// Use raw values internally
sum = 0.0
for i = 0 to validated_period.v - 1
sum += close
Error Propagation: When errors occur early, avoid expensive calculations:
process_data(input) =>
validated = validate_input(input)
if validated.has_error()
validated // Return early with error
else
// Expensive processing only if valid
perform_complex_calculation(validated)
Integration Patterns
Light Log integrates smoothly with existing Pine Script code. You can adopt it incrementally, starting with critical functions and expanding coverage as needed.
Boundary Validation: Add Light Log at the boundaries of your system – where user input enters and where final outputs are produced. This catches most errors while minimizing changes to existing code.
Progressive Enhancement: Start by adding argument validation to existing functions. Then wrap return values. Finally, add comprehensive logging. Each step improves reliability without requiring a complete rewrite.
Testing and Debugging: Use Light Log's conditional rendering to create debug modes for your scripts. Production users see clean output while developers get detailed diagnostics:
// User input for debug mode
debug = input.bool(false, "Enable debug logging")
// Conditional diagnostic output
if debug
diagnostics.render_now()
else
diagnostics.render_condition() // Only shows errors/warnings
Future-Proofing Your Code
Light Log's patterns prepare your code for Pine Script's evolution. As Pine Script adds more sophisticated features, code that uses structured error handling and defensive programming will adapt more easily than code that relies on implicit assumptions.
The type wrapper system, in particular, positions your code to take advantage of potential future features or more sophisticated type inference. By thinking in terms of wrapped values and error propagation today, you're building code that will remain maintainable and extensible tomorrow.
Light Log doesn't just make your Pine Script better today – it prepares it for the trading systems you'll need to build tomorrow.
Library "light_log"
A lightweight logging and defensive programming library for Pine Script.
Designed for modular and extensible scripts, this utility provides structured runtime validation,
conditional logging, and reusable `Log` objects for centralized error propagation.
It also introduces a typed wrapping system for all native Pine values (e.g., `INT`, `FLOAT`, `LABEL`),
allowing values to carry errors alongside data. This enables functional-style flows with built-in
validation tracking, error detection (`has_error()`), and fluent chaining.
Inspired by structured logging patterns found in systems like C#, it reduces boilerplate,
enforces argument safety, and encourages clean, maintainable code architecture.
method INT(self, error_type)
Wraps an `int` value into an `INT` struct with an optional log severity.
Namespace types: series int, simple int, input int, const int
Parameters:
self (int) : The raw `int` value to wrap.
error_type (series ErrorType) : Optional severity level to associate with the log. Default is `ErrorType.error`.
Returns: An `INT` object containing the value and a default Log instance.
method FLOAT(self, error_type)
Wraps a `float` value into a `FLOAT` struct with an optional log severity.
Namespace types: series float, simple float, input float, const float
Parameters:
self (float) : The raw `float` value to wrap.
error_type (series ErrorType) : Optional severity level to associate with the log. Default is `ErrorType.error`.
Returns: A `FLOAT` object containing the value and a default Log instance.
method BOOL(self, error_type)
Wraps a `bool` value into a `BOOL` struct with an optional log severity.
Namespace types: series bool, simple bool, input bool, const bool
Parameters:
self (bool) : The raw `bool` value to wrap.
error_type (series ErrorType) : Optional severity level to associate with the log. Default is `ErrorType.error`.
Returns: A `BOOL` object containing the value and a default Log instance.
method STRING(self, error_type)
Wraps a `string` value into a `STRING` struct with an optional log severity.
Namespace types: series string, simple string, input string, const string
Parameters:
self (string) : The raw `string` value to wrap.
error_type (series ErrorType) : Optional severity level to associate with the log. Default is `ErrorType.error`.
Returns: A `STRING` object containing the value and a default Log instance.
method COLOR(self, error_type)
Wraps a `color` value into a `COLOR` struct with an optional log severity.
Namespace types: series color, simple color, input color, const color
Parameters:
self (color) : The raw `color` value to wrap.
error_type (series ErrorType) : Optional severity level to associate with the log. Default is `ErrorType.error`.
Returns: A `COLOR` object containing the value and a default Log instance.
method LINE(self, error_type)
Wraps a `line` object into a `LINE` struct with an optional log severity.
Namespace types: series line
Parameters:
self (line) : The raw `line` object to wrap.
error_type (series ErrorType) : Optional severity level to associate with the log. Default is `ErrorType.error`.
Returns: A `LINE` object containing the value and a default Log instance.
method LABEL(self, error_type)
Wraps a `label` object into a `LABEL` struct with an optional log severity.
Namespace types: series label
Parameters:
self (label) : The raw `label` object to wrap.
error_type (series ErrorType) : Optional severity level to associate with the log. Default is `ErrorType.error`.
Returns: A `LABEL` object containing the value and a default Log instance.
method BOX(self, error_type)
Wraps a `box` object into a `BOX` struct with an optional log severity.
Namespace types: series box
Parameters:
self (box) : The raw `box` object to wrap.
error_type (series ErrorType) : Optional severity level to associate with the log. Default is `ErrorType.error`.
Returns: A `BOX` object containing the value and a default Log instance.
method TABLE(self, error_type)
Wraps a `table` object into a `TABLE` struct with an optional log severity.
Namespace types: series table
Parameters:
self (table) : The raw `table` object to wrap.
error_type (series ErrorType) : Optional severity level to associate with the log. Default is `ErrorType.error`.
Returns: A `TABLE` object containing the value and a default Log instance.
method CHART_POINT(self, error_type)
Wraps a `chart.point` value into a `CHART_POINT` struct with an optional log severity.
Namespace types: chart.point
Parameters:
self (chart.point) : The raw `chart.point` value to wrap.
error_type (series ErrorType) : Optional severity level to associate with the log. Default is `ErrorType.error`.
Returns: A `CHART_POINT` object containing the value and a default Log instance.
method POLYLINE(self, error_type)
Wraps a `polyline` object into a `POLYLINE` struct with an optional log severity.
Namespace types: series polyline, series polyline, series polyline, series polyline
Parameters:
self (polyline) : The raw `polyline` object to wrap.
error_type (series ErrorType) : Optional severity level to associate with the log. Default is `ErrorType.error`.
Returns: A `POLYLINE` object containing the value and a default Log instance.
method LINEFILL(self, error_type)
Wraps a `linefill` object into a `LINEFILL` struct with an optional log severity.
Namespace types: series linefill
Parameters:
self (linefill) : The raw `linefill` object to wrap.
error_type (series ErrorType) : Optional severity level to associate with the log. Default is `ErrorType.error`.
Returns: A `LINEFILL` object containing the value and a default Log instance.
method from_INT(self)
Extracts the integer value from an INT wrapper.
Namespace types: INT
Parameters:
self (INT) : The wrapped INT instance.
Returns: The underlying `int` value.
method from_FLOAT(self)
Extracts the float value from a FLOAT wrapper.
Namespace types: FLOAT
Parameters:
self (FLOAT) : The wrapped FLOAT instance.
Returns: The underlying `float` value.
method from_BOOL(self)
Extracts the boolean value from a BOOL wrapper.
Namespace types: BOOL
Parameters:
self (BOOL) : The wrapped BOOL instance.
Returns: The underlying `bool` value.
method from_STRING(self)
Extracts the string value from a STRING wrapper.
Namespace types: STRING
Parameters:
self (STRING) : The wrapped STRING instance.
Returns: The underlying `string` value.
method from_COLOR(self)
Extracts the color value from a COLOR wrapper.
Namespace types: COLOR
Parameters:
self (COLOR) : The wrapped COLOR instance.
Returns: The underlying `color` value.
method from_LINE(self)
Extracts the line object from a LINE wrapper.
Namespace types: LINE
Parameters:
self (LINE) : The wrapped LINE instance.
Returns: The underlying `line` object.
method from_LABEL(self)
Extracts the label object from a LABEL wrapper.
Namespace types: LABEL
Parameters:
self (LABEL) : The wrapped LABEL instance.
Returns: The underlying `label` object.
method from_BOX(self)
Extracts the box object from a BOX wrapper.
Namespace types: BOX
Parameters:
self (BOX) : The wrapped BOX instance.
Returns: The underlying `box` object.
method from_TABLE(self)
Extracts the table object from a TABLE wrapper.
Namespace types: TABLE
Parameters:
self (TABLE) : The wrapped TABLE instance.
Returns: The underlying `table` object.
method from_CHART_POINT(self)
Extracts the chart.point from a CHART_POINT wrapper.
Namespace types: CHART_POINT
Parameters:
self (CHART_POINT) : The wrapped CHART_POINT instance.
Returns: The underlying `chart.point` value.
method from_POLYLINE(self)
Extracts the polyline object from a POLYLINE wrapper.
Namespace types: POLYLINE
Parameters:
self (POLYLINE) : The wrapped POLYLINE instance.
Returns: The underlying `polyline` object.
method from_LINEFILL(self)
Extracts the linefill object from a LINEFILL wrapper.
Namespace types: LINEFILL
Parameters:
self (LINEFILL) : The wrapped LINEFILL instance.
Returns: The underlying `linefill` object.
method has_error(self)
Returns true if the INT wrapper has an active log entry.
Namespace types: INT
Parameters:
self (INT) : The INT instance to check.
Returns: True if an error or message is active in the log.
method has_error(self)
Returns true if the FLOAT wrapper has an active log entry.
Namespace types: FLOAT
Parameters:
self (FLOAT) : The FLOAT instance to check.
Returns: True if an error or message is active in the log.
method has_error(self)
Returns true if the BOOL wrapper has an active log entry.
Namespace types: BOOL
Parameters:
self (BOOL) : The BOOL instance to check.
Returns: True if an error or message is active in the log.
method has_error(self)
Returns true if the STRING wrapper has an active log entry.
Namespace types: STRING
Parameters:
self (STRING) : The STRING instance to check.
Returns: True if an error or message is active in the log.
method has_error(self)
Returns true if the COLOR wrapper has an active log entry.
Namespace types: COLOR
Parameters:
self (COLOR) : The COLOR instance to check.
Returns: True if an error or message is active in the log.
method has_error(self)
Returns true if the LINE wrapper has an active log entry.
Namespace types: LINE
Parameters:
self (LINE) : The LINE instance to check.
Returns: True if an error or message is active in the log.
method has_error(self)
Returns true if the LABEL wrapper has an active log entry.
Namespace types: LABEL
Parameters:
self (LABEL) : The LABEL instance to check.
Returns: True if an error or message is active in the log.
method has_error(self)
Returns true if the BOX wrapper has an active log entry.
Namespace types: BOX
Parameters:
self (BOX) : The BOX instance to check.
Returns: True if an error or message is active in the log.
method has_error(self)
Returns true if the TABLE wrapper has an active log entry.
Namespace types: TABLE
Parameters:
self (TABLE) : The TABLE instance to check.
Returns: True if an error or message is active in the log.
method has_error(self)
Returns true if the CHART_POINT wrapper has an active log entry.
Namespace types: CHART_POINT
Parameters:
self (CHART_POINT) : The CHART_POINT instance to check.
Returns: True if an error or message is active in the log.
method has_error(self)
Returns true if the POLYLINE wrapper has an active log entry.
Namespace types: POLYLINE
Parameters:
self (POLYLINE) : The POLYLINE instance to check.
Returns: True if an error or message is active in the log.
method has_error(self)
Returns true if the LINEFILL wrapper has an active log entry.
Namespace types: LINEFILL
Parameters:
self (LINEFILL) : The LINEFILL instance to check.
Returns: True if an error or message is active in the log.
void_return()
Utility function used when a return is syntactically required but functionally unnecessary.
Returns: Nothing. Function never executes its body.
argument_error(condition, function, argument, message)
Throws a runtime error when a condition is met. Used for strict argument validation.
Parameters:
condition (bool) : Boolean expression that triggers the runtime error.
function (string) : Name of the calling function (for formatting).
argument (string) : Name of the problematic argument.
message (string) : Description of the error cause.
Returns: Never returns. Halts execution if the condition is true.
argument_log_info(condition, function, argument, message)
Logs an informational message when a condition is met. Used for optional debug visibility.
Parameters:
condition (bool) : Boolean expression that triggers the log.
function (string) : Name of the calling function.
argument (string) : Argument name being referenced.
message (string) : Informational message to log.
Returns: Nothing. Logs if the condition is true.
argument_log_warning(condition, function, argument, message)
Logs a warning when a condition is met. Non-fatal but highlights potential issues.
Parameters:
condition (bool) : Boolean expression that triggers the warning.
function (string) : Name of the calling function.
argument (string) : Argument name being referenced.
message (string) : Warning message to log.
Returns: Nothing. Logs if the condition is true.
argument_log_error(condition, function, argument, message)
Logs an error message when a condition is met. Does not halt execution.
Parameters:
condition (bool) : Boolean expression that triggers the error log.
function (string) : Name of the calling function.
argument (string) : Argument name being referenced.
message (string) : Error message to log.
Returns: Nothing. Logs if the condition is true.
init_static_log(error_type, message, active)
Initializes a persistent (var) Log object. Ideal for global logging in scripts or modules.
Parameters:
error_type (series ErrorType) : Initial severity level (required).
message (string) : Optional starting message string. Default value of ("").
active (bool) : Whether the log should be flagged active on initialization. Default value of (false).
Returns: A static Log object with the given parameters.
method new_line(self)
Appends a newline character to the Log message. Useful for separating entries during chained writes.
Namespace types: Log
Parameters:
self (Log) : The Log instance to modify.
Returns: The updated Log object with a newline appended.
method write(self, message, flag_active, error_type)
Appends a message to a Log object without a newline. Updates severity and active state if specified.
Namespace types: Log
Parameters:
self (Log) : The Log instance being modified.
message (string) : The text to append to the log.
flag_active (bool) : Whether to activate the log for conditional rendering. Default value of (false).
error_type (series ErrorType) : Optional override for the severity level. Default value of (na).
Returns: The updated Log object.
method write_line(self, message, flag_active, error_type)
Appends a message to a Log object, prefixed with a newline for clarity.
Namespace types: Log
Parameters:
self (Log) : The Log instance being modified.
message (string) : The text to append to the log.
flag_active (bool) : Whether to activate the log for conditional rendering. Default value of (false).
error_type (series ErrorType) : Optional override for the severity level. Default value of (na).
Returns: The updated Log object.
method clear(self, flag_active, error_type)
Clears a Log object’s message and optionally reactivates it. Can also update the error type.
Namespace types: Log
Parameters:
self (Log) : The Log instance being cleared.
flag_active (bool) : Whether to activate the log after clearing. Default value of (false).
error_type (series ErrorType) : Optional new error type to assign. If not provided, the previous type is retained. Default value of (na).
Returns: The cleared Log object.
method render_condition(self, flag_active, error_type)
Conditionally renders the log if it is active. Allows overriding error type and controlling active state afterward.
Namespace types: Log
Parameters:
self (Log) : The Log instance to evaluate and render.
flag_active (bool) : Whether to activate the log after rendering. Default value of (false).
error_type (series ErrorType) : Optional error type override. Useful for contextual formatting just before rendering. Default value of (na).
Returns: The updated Log object.
method render_now(self, flag_active, error_type)
Immediately renders the log regardless of `active` state. Allows overriding error type and active flag.
Namespace types: Log
Parameters:
self (Log) : The Log instance to render.
flag_active (bool) : Whether to activate the log after rendering. Default value of (false).
error_type (series ErrorType) : Optional error type override. Allows dynamic severity adjustment at render time. Default value of (na).
Returns: The updated Log object.
render(self, condition, flag_active, error_type)
Renders the log conditionally or unconditionally. Allows full control over render behavior.
Parameters:
self (Log) : The Log instance to render.
condition (bool) : If true, renders only if the log is active. If false, always renders. Default value of (false).
flag_active (bool) : Whether to activate the log after rendering. Default value of (false).
error_type (series ErrorType) : Optional error type override passed to the render methods. Default value of (na).
Returns: The updated Log object.
Log
A structured object used to store and render logging messages.
Fields:
error_type (series ErrorType) : The severity level of the message (from the ErrorType enum).
message (series string) : The text of the log message.
active (series bool) : Whether the log should trigger rendering when conditionally evaluated.
INT
A wrapped integer type with attached logging for validation or tracing.
Fields:
v (series int) : The underlying `int` value.
e (Log) : Optional log object describing validation status or error context.
FLOAT
A wrapped float type with attached logging for validation or tracing.
Fields:
v (series float) : The underlying `float` value.
e (Log) : Optional log object describing validation status or error context.
BOOL
A wrapped boolean type with attached logging for validation or tracing.
Fields:
v (series bool) : The underlying `bool` value.
e (Log) : Optional log object describing validation status or error context.
STRING
A wrapped string type with attached logging for validation or tracing.
Fields:
v (series string) : The underlying `string` value.
e (Log) : Optional log object describing validation status or error context.
COLOR
A wrapped color type with attached logging for validation or tracing.
Fields:
v (series color) : The underlying `color` value.
e (Log) : Optional log object describing validation status or error context.
LINE
A wrapped line object with attached logging for validation or tracing.
Fields:
v (series line) : The underlying `line` value.
e (Log) : Optional log object describing validation status or error context.
LABEL
A wrapped label object with attached logging for validation or tracing.
Fields:
v (series label) : The underlying `label` value.
e (Log) : Optional log object describing validation status or error context.
BOX
A wrapped box object with attached logging for validation or tracing.
Fields:
v (series box) : The underlying `box` value.
e (Log) : Optional log object describing validation status or error context.
TABLE
A wrapped table object with attached logging for validation or tracing.
Fields:
v (series table) : The underlying `table` value.
e (Log) : Optional log object describing validation status or error context.
CHART_POINT
A wrapped chart point with attached logging for validation or tracing.
Fields:
v (chart.point) : The underlying `chart.point` value.
e (Log) : Optional log object describing validation status or error context.
POLYLINE
A wrapped polyline object with attached logging for validation or tracing.
Fields:
v (series polyline) : The underlying `polyline` value.
e (Log) : Optional log object describing validation status or error context.
LINEFILL
A wrapped linefill object with attached logging for validation or tracing.
Fields:
v (series linefill) : The underlying `linefill` value.
e (Log) : Optional log object describing validation status or error context.

Cumulative Volume Delta📊 Indicator Name:
Cumulative Volume Delta (CVD) + Candle Divergence (Color DIfference)
📌 Purpose:
This indicator visualizes volume delta over a user-defined time anchor and highlights divergence between volume-based momentum and price movement. It's especially useful for identifying potential reversals, fakeouts, or hidden buying/selling pressure.
🔍 How It Works:
1. Volume Delta Calculation (CVD Candles):
The script uses ta.requestVolumeDelta() to approximate volume delta data over a chosen anchor period (e.g., 1D).
Volume delta = Buy Volume – Sell Volume
Each candle on the CVD chart represents changes in cumulative volume delta, with OHLC-style values:
openVolume: cumulative delta at the start of the bar
lastVolume: cumulative delta at the end of the bar
maxVolume, minVolume: intra-bar high and low
2. Visual Representation (CVD Candles):
Green/Teal candle: Delta is increasing (buying pressure dominates)
Red candle: Delta is decreasing (selling pressure dominates)
3. Divergence Detection:
The script compares the direction of the price candle with the direction of the CVD candle:
Price Up + CVD Down → Possible hidden selling (bearish divergence)
Price Down + CVD Up → Possible hidden buying (bullish divergence)
4. Color Highlighting:
Orange candle on the CVD chart signals divergence between price and volume delta.
This color override helps you quickly spot potential discrepancies between price movement and underlying volume pressure.
5. Alerting:
An alertcondition is added so you can receive a notification whenever a divergence occurs.
⚙️ User Inputs:
Anchor period (e.g., 1D): Timeframe over which the CVD is anchored.
Use custom timeframe: Allows you to override and define the internal lower timeframe used for volume estimation (e.g., 1-min).
📈 How to Use It:
✅ Bullish Divergence (Price down, CVD up)
This may indicate:
Buyers absorbing selling pressure.
A potential reversal to the upside.
Hidden accumulation.
🚫 Bearish Divergence (Price up, CVD down)
This may indicate:
Sellers stepping in despite upward price.
A potential reversal to the downside.
Hidden distribution.
🧠 Trading Insights:
CVD is often used by order flow traders or those analyzing market depth and volume imbalances.
This version lets you visually align price action with underlying volume, improving decision-making.
The divergence signal can be combined with other technical tools like support/resistance, candlestick patterns, or trendlines for confirmation.

LRCLRC (Linear Regression Candle)
Overview
The LRC (Linear Regression Candle) indicator applies linear regression to the open, high, low, and close prices, creating smoothed "candles" that help filter market noise. It provides trend-confirmation signals and highlights potential reversal points based on regression crossovers.
Key Features
Smoothed Candles: Uses linear regression to calculate synthetic OHLC values, reducing noise.
Multi-Timeframe Support: Optional higher timeframe analysis for better trend confirmation.
Visual Signals: Color-coded candles and labels highlight bullish/bearish control zones.
Customizable Settings: Adjustable regression length, colors, and timeframe options.
How to Use
Signals & Interpretation
🟢 Bullish Signal (BUY): When the regression open crosses above the regression close (green candle).
🔴 Bearish Signal (SELL): When the regression open crosses below the regression close (red candle).
Control Zones:
Strong Bullish (Controlbull): Confirmed uptrend (bright green).
Bullish (Bull): Regular uptrend (light green).
Strong Bearish (Controlbear): Confirmed downtrend (dark red).
Bearish (Bear): Regular downtrend (orange).
Neutral (Gray): No clear trend.
Recommended Settings
Linear Regression Length: Default 8 (adjust for sensitivity).
Timeframe: Default current chart, but can switch to higher timeframes (e.g., 1D, 1W).
Bar Colors: Toggle on/off for visual clarity.
Labels: Displays "Control" markers at key reversal points.
Example Use Cases
Trend Confirmation: Use higher timeframe LRC to validate the primary trend.
Reversal Signals: Watch for BUY/SELL crossovers with strong color confirmation.
Noise Reduction: Helps avoid false breakouts in choppy markets.

Heikin-Ashi Mean Reversion Oscillator [Alpha Extract]The Heikin-Ashi Mean Reversion Oscillator combines the smoothing characteristics of Heikin-Ashi candlesticks with mean reversion analysis to create a powerful momentum oscillator. This indicator applies Heikin-Ashi transformation twice - first to price data and then to the oscillator itself - resulting in smoother signals while maintaining sensitivity to trend changes and potential reversal points.
🔶 CALCULATION
Heikin-Ashi Transformation: Converts regular OHLC data to smoothed Heikin-Ashi values
Component Analysis: Calculates trend strength, body deviation, and price deviation from mean
Oscillator Construction: Combines components with weighted formula (40% trend strength, 30% body deviation, 30% price deviation)
Double Smoothing: Applies EMA smoothing and second Heikin-Ashi transformation to oscillator values
Signal Generation: Identifies trend changes and crossover points with overbought/oversold levels
Formula:
HA Close = (Open + High + Low + Close) / 4
HA Open = (Previous HA Open + Previous HA Close) / 2
Trend Strength = Normalized consecutive HA candle direction
Body Deviation = (HA Body - Mean Body) / Mean Body * 100
Price Deviation = ((HA Close - Price Mean) / Price Mean * 100) / Standard Deviation * 25
Raw Oscillator = (Trend Strength * 0.4) + (Body Deviation * 0.3) + (Price Deviation * 0.3)
Final Oscillator = 50 + (EMA(Raw Oscillator) / 2)
🔶 DETAILS Visual Features:
Heikin-Ashi Candlesticks: Smoothed oscillator representation using HA transformation with vibrant teal/red coloring
Overbought/Oversold Zones: Horizontal lines at customizable levels (default 70/30) with background highlighting in extreme zones
Moving Averages: Optional fast and slow EMA overlays for additional trend confirmation
Signal Dashboard: Real-time table showing current oscillator status (Overbought/Oversold/Bullish/Bearish) and buy/sell signals
Reference Lines: Middle line at 50 (neutral), with 0 and 100 boundaries for range visualization
Interpretation:
Above 70: Overbought conditions, potential selling opportunity
Below 30: Oversold conditions, potential buying opportunity
Bullish HA Candles: Green/teal candles indicate upward momentum
Bearish HA Candles: Red candles indicate downward momentum
MA Crossovers: Fast EMA above slow EMA suggests bullish momentum, below suggests bearish momentum
Zone Exits: Price moving out of extreme zones (above 70 or below 30) often signals trend continuation
🔶 EXAMPLES
Mean Reversion Signals: When the oscillator reaches extreme levels (above 70 or below 30), it identifies potential reversal points where price may revert to the mean.
Example: Oscillator reaching 80+ levels during strong uptrends often precedes short-term pullbacks, providing profit-taking opportunities.
Trend Change Detection: The double Heikin-Ashi smoothing helps identify genuine trend changes while filtering out market noise.
Example: When oscillator HA candles change from red to teal after oversold readings, this confirms potential trend reversal from bearish to bullish.
Moving Average Confirmation: Fast and slow EMA crossovers on the oscillator provide additional confirmation of momentum shifts.
Example: Fast EMA crossing above slow EMA while oscillator is rising from oversold levels provides strong bullish confirmation signal.
Dashboard Signal Integration: The real-time dashboard combines oscillator status with directional signals for quick decision-making.
Example: Dashboard showing "Oversold" status with "BUY" signal when HA candles turn bullish provides clear entry timing.
🔶 SETTINGS
Customization Options:
Calculation: Oscillator period (default 14), smoothing factor (1-50, default 2)
Levels: Overbought threshold (50-100, default 70), oversold threshold (0-50, default 30)
Moving Averages: Toggle display, fast EMA length (default 9), slow EMA length (default 21)
Visual Enhancements: Show/hide signal dashboard, customizable table position
Alert Conditions: Oversold bounce, overbought reversal, bullish/bearish MA crossovers
The Heikin-Ashi Mean Reversion Oscillator provides traders with a sophisticated momentum tool that combines the smoothing benefits of Heikin-Ashi analysis with mean reversion principles. The double transformation process creates cleaner signals while the integrated dashboard and multiple confirmation methods help traders identify high-probability entry and exit points during both trending and ranging market conditions.

MirPapa:ICT:HTF: FVG OB Threeple# MirPapa:ICT:HTF: FVG OB (Fair Value Gap Order Block)
**Version:** Pine Script® v6
**Author:** © goodia
**License:** MPL-2.0 (Mozilla Public License 2.0)
---
## Overview
“FVG OB” (Fair Value Gap Order Block) identifies higher-timeframe candle ranges where a gap (imbalance) exists between two non-consecutive candles, signaling potential institutional order blocks. This module draws bullish or bearish FVG OB boxes on your lower-timeframe chart, extends them until price interacts a specified number of times, and then finalizes (recolors) the box.
---
## Inputs
- **Enable FVG OB Boxes** (`bool`)
Toggle drawing of HTF FVG OB boxes on the chart.
- **Enable FVG OB Midlines** (`bool`)
Toggle drawing of a midpoint line inside each FVG OB box.
- **FVG OB Close Count** (`int` 1–10)
Number of HTF closes beyond the FVG range required to finalize (recolor) the box.
- **FVG OB Bull Color** (`color`)
Fill & border color for bullish FVG OB boxes.
- **FVG OB Bear Color** (`color`)
Fill & border color for bearish FVG OB boxes.
- **FVG OB Box Transparency** (`int` 1–100)
Opacity level for FVG OB box fills (higher = more transparent).
---
## How It Works
1. **HTF Data Retrieval**
- The script uses `request.security()` (via `GetHTFrevised()`) to fetch HTF OHLC and historical values:
- `_htfHigh3` (high three bars ago) and `_htfLow1` (low one bar ago) for bullish FVG OB.
- `_htfLow3` (low three bars ago) and `_htfHigh1` (high one bar ago) for bearish FVG OB.
- It also tracks the HTF `bar_index` on the lower timeframe to align drawing.
2. **FVG OB Detection**
- **Bullish FVG OB**: Occurs when the HTF low of the previous bar (`low `) is strictly above the HTF high of three bars ago (`high `), creating a gap.
- **Bearish FVG OB**: Occurs when the HTF high of the previous bar (`high `) is strictly below the HTF low of three bars ago (`low `), creating a gap.
3. **Box Creation**
- On each new HTF bar (`ta.change(time(HTF)) != 0`), if a bullish or bearish FVG OB condition is met, the script calls `CreateBoxData()` with:
- **Bullish**: `bottom = HTF low `, `top = HTF high `, `_isBull = true`.
- **Bearish**: `bottom = HTF low `, `top = HTF high `, `_isBull = false`.
- Midline toggled by input.
- A `BoxData` struct is created and stored in either the Bull or Bear array.
4. **Box Extension & Finalization**
- On **every LTF bar**, `ProcessBoxDatas(...)` iterates over all active FVG OB boxes:
1. **Extend Right Edge**: `box.set_right(bar_index)` ensures the box follows the latest bar.
2. **Record Volume Delta**: Tracks buy/sell volume inside the box.
3. **Touch Stage Update**: `modBoxUpdateStage()` increments `_stage` when price touches its “basePoint” (for FVG OB, the basePrice is one side of the gap).
4. **Finalize**: `setBoxFinalize()` checks if the configured number of closes beyond the FVG gap (`FVG OB Close Count`) has occurred. If so:
- `_isActive := false`
- Border and background colors are changed to the “Box Close Color” (input).
- Finalized boxes remain on screen semi-transparent, indicating that the FVG OB zone has been tested.
5. **Midline (Optional)**
- If “Enable FVG OB Midlines” is checked, `ProcessBoxDatas()` also extends a horizontal midpoint line inside the box with `line.set_x2(bar_index)`.
---
## Usage Instructions
1. **Installation**
- Copy the FVG OB section of the Pine Script into TradingView’s Pine Editor (ensure the library import is included).
- Click “Add to Chart.”
2. **Configure Inputs**
- Choose a Higher Time Frame via the dropdown (e.g., “4시간” maps to a 4H timeframe).
- Toggle “Enable FVG OB Boxes” and “Enable FVG OB Midlines.”
- Select colors for bullish and bearish boxes and set transparency.
- Adjust “FVG OB Close Count” to control how many closes beyond the gap finalize the box.
3. **Interpretation**
- **Active FVG OB Boxes** extend to the right until price closes beyond the gap range the specified number of times.
- When finalized, each box changes to the “Box Close Color,” signaling that institutional orders in that gap have likely been filled.
Enjoy precise visualization of higher-timeframe Fair Value Gap Order Blocks on your lower-timeframe chart!
Candle Range Trading (CRT) with Alerts
📌 Description:
The Candle Range Trading (CRT) indicator identifies potential reversal or continuation setups based on specific two-candle price action patterns.
It analyzes pairs of candles to detect Bullish or Bearish CRT patterns and provides visual signals (triangles) and alert notifications to support scalp or swing trading strategies.
🔍 How It Works:
🔻 Bearish CRT Pattern:
Candle 1 is bullish
Candle 2 is bearish
Candle 2's high > Candle 1's high
Candle 2 closes within Candle 1’s range
🔺 Red triangle above candle
🔺 Bullish CRT Pattern:
Candle 1 is bearish
Candle 2 is bullish
Candle 2's low < Candle 1's low
Candle 2 closes within Candle 1’s range
🔻 Green triangle below candle
📈 Visual Features:
🔺 Red triangle = Bearish CRT
🔻 Green triangle = Bullish CRT
📏 Optional box showing CRT High and CRT Low
🔔 Built-in Alerts:
Bullish CRT Alert: "Bullish CRT Pattern Detected"
Bearish CRT Alert: "Bearish CRT Pattern Detected"
Set alerts to get notified instantly when a pattern is detected.
⚠️ Note:
Use in conjunction with trend filters, support/resistance, or volume for best results.
Ideal for scalping or short-term trades.
Avoid trading in choppy or low-volume markets.
⚠️ Disclaimer:
This script was generated with the assistance of ChatGPT by OpenAI and is intended for educational and informational purposes only.
All strategies, alerts, and signals derived from this indicator should be thoroughly backtested and validated before using in live trading.
Trading involves substantial risk, and past performance is not indicative of future results. The author and ChatGPT bear no responsibility for any trading losses or financial decisions made using this script.
Users are solely responsible for the risks associated with their trading actions. Always apply proper risk management and perform your own due diligence before making any financial decisions.

X OC StoryOverview
The "X OC Story" is a Pine Script indicator that visualizes the Open-Close range of a higher timeframe (HTF) candle on a lower timeframe chart. By plotting dynamic lines to represent the open and close prices of the previous HTF bar, this tool gives traders a clearer context of recent market sentiment and structural shifts. It includes color-coded visual fills to distinguish between bullish and bearish candles and offers the option to display only the most recent range.
Concept
1. Multi-Timeframe Analysis (MTF)
At its core, this indicator utilizes multi-timeframe analysis by requesting open, high, low, and close values from a user-defined HTF (input.timeframe('60')) and applying them to a lower timeframe chart. This allows traders to incorporate higher timeframe information without switching chart intervals.
2. Timeframe Change Detection
The indicator detects when a new HTF candle begins which lets the script know when to capture and visualize a new set of HTF open-close values.
3. Encapsulation with Custom Type (candles)
The script defines a custom type candles to encapsulate OHLC values of the previous HTF candle. This improves code readability and structure by keeping all relevant HTF data in a single object.
4. Dynamic Line Drawing
When a new HTF candle is detected, two horizontal lines are drawn for Open and Close. These are updated dynamically on each bar to extend across the entire HTF candle range on the lower timeframe chart.
5. Visual Highlighting
a shaded area is drawn between the open and close lines which help highlight market structure without overwhelming the chart.
6. Selective Persistence of Drawings
Users can enable deleteOld to show only the most recent HTF open-close range. When enabled, previously drawn lines are tracked in an array and deleted upon creation of a new range, keeping the chart clean and focused.
How a Trader Might Use This Tool
Contextual Decision-Making
This indicator helps traders see where the market is trading relative to the previous HTF candle:
Trading above the HTF close may suggest bullish continuation
Trading below the HTF open may indicate a bearish reversal or breakdown
Confluence Zones
The open and close lines of HTF candles often act as support/resistance levels. A trader might:
Watch for rejections or breakouts at these levels
Use them in confluence with intraday setups or trend indicators
Scalping or Intraday Strategy Support
Since this visual is drawn on a lower timeframe (like 5m or 15m), it’s particularly useful for scalpers or day traders who want to factor in HTF sentiment without leaving their active chart.
Cleaner Charting
With the optional setting to display only the most recent range (deleteOld), traders avoid clutter and focus on the current actionable zone.
Summary
“X OC Story” is a clean, visual, and effective multi-timeframe utility that helps traders:
Identify HTF open-close context
Highlight possible support/resistance zones
Analyze sentiment and structure visually
It’s an excellent addition to any discretionary trader’s toolkit for improved context awareness and informed entries or exits.
ka66: Triple Keltner Around SourceThis is an indicator-on-indicator which draws Keltner Bands (ATR Bands) around any selected Basis Source, instead of hardcoding a moving average, etc. This allows you to put bands around any sort of esoteric moving average of your choice, or even just around price data like OHLC, HLC3, and so on.
It's an enhancement on my prior Multi ATR Channels script at
Written in Pine v6 and allowing custom timeframe selection.
For example, the published chart shows the bands place around a Kaufman Adaptive Moving Average (KAMA), plotted in blue dots.
You would use it for anything that you would use plain Keltners for:
Mean Reversion
Breakouts
Take Profit and Stop Loss Estimation
But with any basis that you deem more suitable for your purposes.
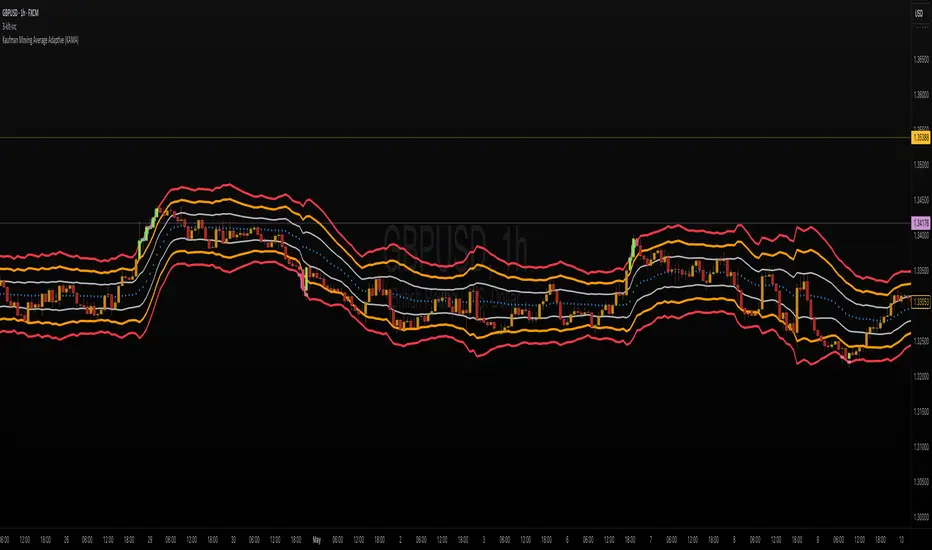
ES OHLC BASED ON 9:301. RTH Price Levels
YC (Yesterday's Close): Previous day's RTH closing price at 4:00 PM ET
0DTE-O (Today's Open): Current day's RTH opening price at 9:30 AM ET
T-E-M (Today's Europe-Asia Midpoint): Midpoint of overnight session high/low
T-E-R (Today's Europe-Asia Resistance): Overnight session high
T-E-S (Today's Europe-Asia Support): Overnight session low
Y-T-M (Yesterday-Today Midpoint): Midpoint between YC and 0DTE-O
2. Previous Bar Percentage Levels
Displays 50% retracement level for all bars
Shows 70% level for bullish bars (close > open)
Shows 30% level for bearish bars (close < open)
Lines automatically update with each new bar
3. Custom Support/Resistance Lines
Up to 4 customizable horizontal levels (2 resistance, 2 support)
Useful for marking key psychological levels or pivot points
4. VIX-Based Options Strategy Suggestions
Real-time VIX value display
Time Zone Handling
The indicator is configured for Central Time (CT) as Pine Script's default:
RTH Open: 8:30 AM CT (9:30 AM ET)
RTH Close: 3:00 PM CT (4:00 PM ET)
Overnight session: 7:00 PM CT to 8:30 AM CT next day
Usage Notes
Chart Requirement: This indicator only works on 5-minute timeframe charts
Auto-refresh: All lines and labels automatically refresh at each new trading day's RTH open
24-hour Market: Designed for ES futures which trade nearly 24 hours
Visual Clarity: Different line styles and colors for easy identification
Ideal For
Day traders focusing on ES futures
0DTE options traders needing key reference levels
Traders using overnight gaps and previous day's levels
Those incorporating VIX-based strategies in their trading
