CC STOCH RSI [Rogulabo]3 indicators in 1.
Included Indicators are:
- Correlation Coefficient
- RSI
- Stochastics
Basic usage of these indicators respectively are:
- CC value of 1 represents a perfect correlation, while a value of -1 represents an inverted correlation.
- RSI values above 70 is commonly overbought, whilst below 30 is oversold.
- Stochastics for describing the momentum and turning points of price swings.
Please recognize that these are simplified explanations.
Reasons for 3 in 1 assembly:
This indicator is intended to be used by students, and followers of Dan Takahashi
(a prominent educator of investing in Japan who is also a user of TradingView) .
Those who wants to use and learn with the same setup as Dan, would greatly benefit from this since,
the complex setting up process which can be a pain for beginners can be skipped with a simple click.
Every stylistic choice of color and placement were made to make it similar to the chart used by Dan.
Simple customizations are available such as:
- Changing color
- Changing the values
- Hide/show controls
Notes:
This is intended to be used alongside “EMA ICHI BB ” for the complete the setup.
Any questions, please refer to:
@rogulabo
==
高橋ダンさんが使用されてるチャートと同様のセットアップの為にご活用ください。
複数のインジケータをグループにしておりますので、無料版を使われてる方は効率よく使っていただけると思います。
また、“EMA ICHI BB ”どいうタイトルのインジケータも同時に公開しておりますので、セットアップを完成させたい方はこちらもご活用ください。
以下のインジケータを含みます。
・相関係数
・ストキャスティクス
・RSI
カスタマイズされたい方はご自由に値を変更ください。
ご質問は @rogulabo までよろしくお願いいたします。
Tìm kiếm tập lệnh với "STOCH RSI"


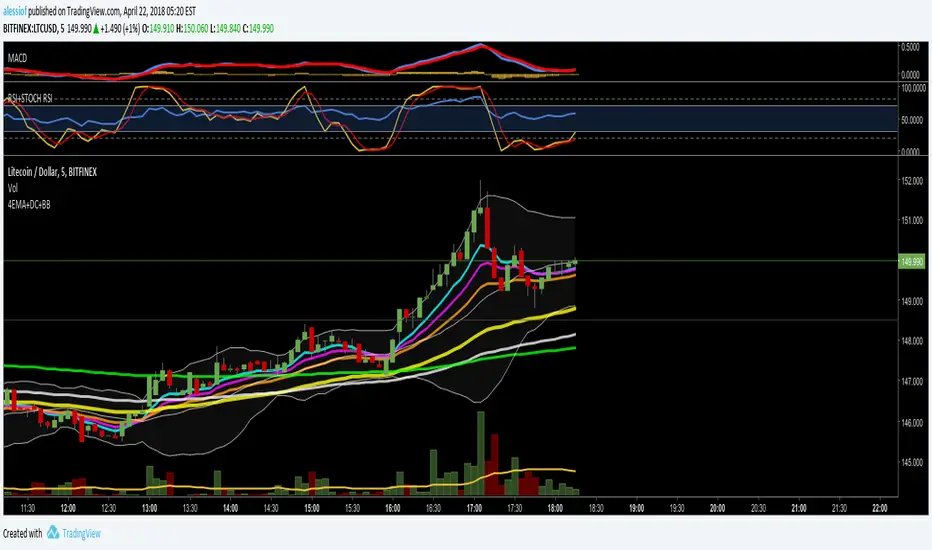
RSI + STOCH RSI OVERLAY by AlessiofRSI and Stochastic RSI in one. Standard settings.
Check out my other script for 4EMA + Death Cross + Bollinger Bands all in one.

BUBD+ - Bats Ultimate Bullish Divergence DetectorBUBD checks for price divergence from oscillators across 6 different oscillators - MACD, CCI (Vol. weighted), RSI, Stochastic RSI, Money Flow and Relative Vigor index. Use it to find good entry spots for longs and also to find downtrend reversals. If this gets popular I will release a Bearish divergence indicator as well.
Please check your stock/crypto across all time frames to get a hint of any developing "Bullish" divergences.
In case you get mixed signals -
Blue - RSI
Purple - RVI
Yellow - CCI
Green - MACD
Lime light green - MFI
Orange - Stoch RSI
Dont get confused by signals appearing on top and bottom all are bullish indicators. If you see a signal go to the respective oscillator to check the developing trend.


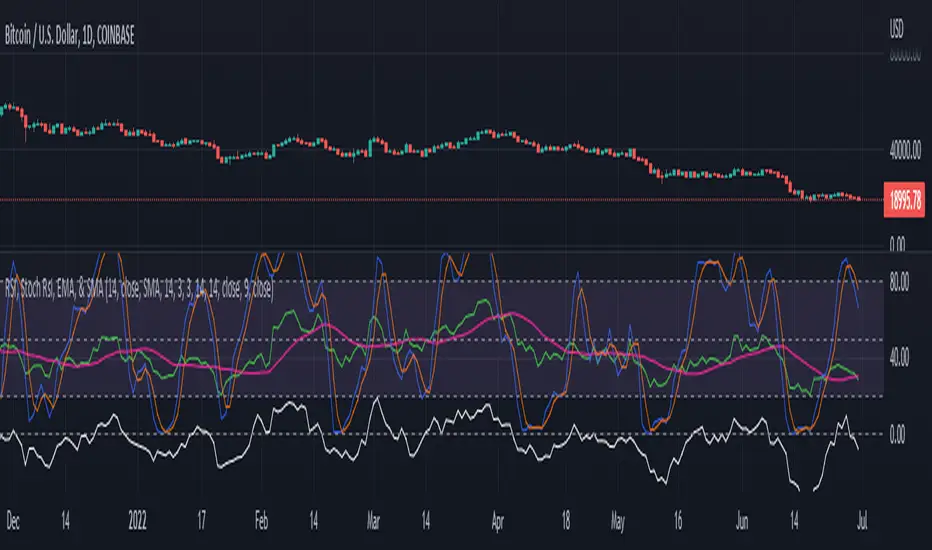
RSI, Stoch Rsi, EMA, SMA, & ROCThis indicator is simply an enhanced version of the RSI followed up by a few extra indicators that pair strongly with the RSI. This indicator allows the user to interact with various inputs based off the indicators provided. All indicators include moving average, relative strength index, stochastic relative strength index, simple moving average, exponential moving average, and rate of change. This program is unique as it is very versatile allowing the user to use as little or as many indicators as needed interchangeably.
mystochrsirsi + stochrsi
Indicator where rsi and stoch rsi are both together. Please adjust the color etc settings from the style tab.
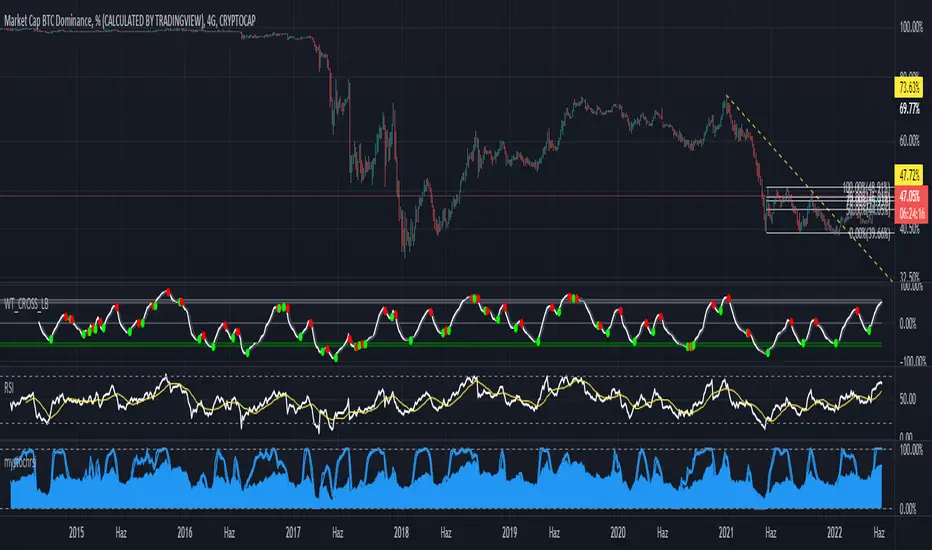
Multi Oscillators Price LevelsThis script draws price levels corresponding to the highest price reached in overbought situations, and the lowest price reached in oversold situations, depending on the oscillator and the timeframe the user has configured.
These levels correspond, most of time, to good supports and resistances prices.
Price levels drawings can be based on the following indicators:
Stochastic RSI (default)
Stochastic CCI
RSI
CCI
You can customize this indicator with the following options:
Source: The candle source to use in indicators calculation
Source Indicator: The indicator on which you cant to base your levels
Timeframe: The timeframe on which you want to apply the selected indicator, and calculate levels
Show supports/resistances: enable/disable price levels, depending on there status (overbought - resistances) / (oversold - supports)
Lines width: width of price levels. (set to 10 by default in order to draw "zones")
Supports/Resistances source: Select the candle data you cant to use to draw supports and resistances levels
Extend levels: Select the line extension for price levels
Levels color: Select the desired color for price levels
And of course , all parameters corresponding to the supported indicators (Stoch, RSI, CCI)
Here are a few examples of different configurations:
This script will probably be modified in the future, don't hesitate to suggest any improvement.

Stochastic MomentumThis RSI indicator uses the difference between the K and D values in the Stochastic RSI indicator. Using the same layered lengths of 12, 24, 48 and 96 intervals that the Avg Stoch RSI indicator, this offers a rate of change momentum measurement. Crossovers are at zero, this indicator gives a clearer indicator of market momentum.

Avg Stoch-RSIThis is a Stochastic RSI measurement that averages four different RSI lengths in order to catch short length as well as longer length trends. The lengths are intentionally chosen to give you periods between 1 to 4 days on the 1hr and proportionally further back by increased period.

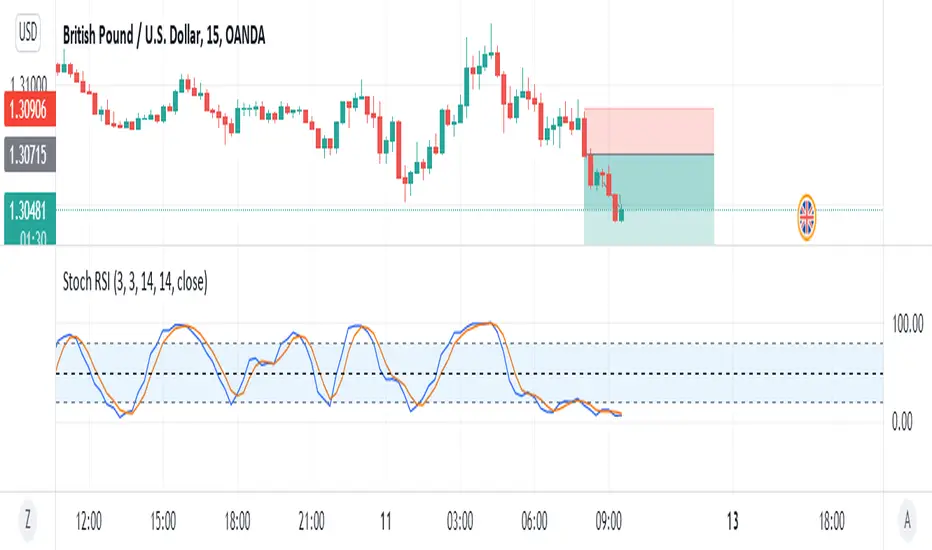
Multi-Timeframe Stoch RSIGood evening folks!
Today I want to share with you a simple variant of the Stochastic-RSI built-in indicator.
Nothing too complex: by enabling the relative checkbox and setting the desired (k, d or the RSI ) source and timeframes, you can see higher timeframes data plotted on your screen.
Everything you need to do is enabling the indicator on the lowest timeframe (in this case 15 minutes), then you will see in YELLOW the information retrieved from the next higher timeframe (in this case 30 minutes) and in RED the information retrieved from the highest timeframe (in this case 45 minutes).
IT'S IMPORTANT THAT YOU DISPLAY THE INDICATOR ON THE LOWEST TIMEFRAME!
You can play with the overbought and oversold heights in order to have the best configuration you want (in oversold conditions is suggested to buy while in overbought conditions is suggested to sell)
The higher timeframes data are retrieved avoiding repainting since the method used for taking them is the 10th method described in this PineCoders Article , so, if you want to enable alerts, you SHOULD ignore the disclaimer message related to it without any problem.
Good Trading!

Stochastic RSI with Overbought OverSold Crosses coloredColored Stoch Rsi .
It is possible to show Oberbought and Oversold Crosses only or all Crosses via Checkbox .
It is a script for Beginner. Stochastic RSI is more readable.
Have Fun

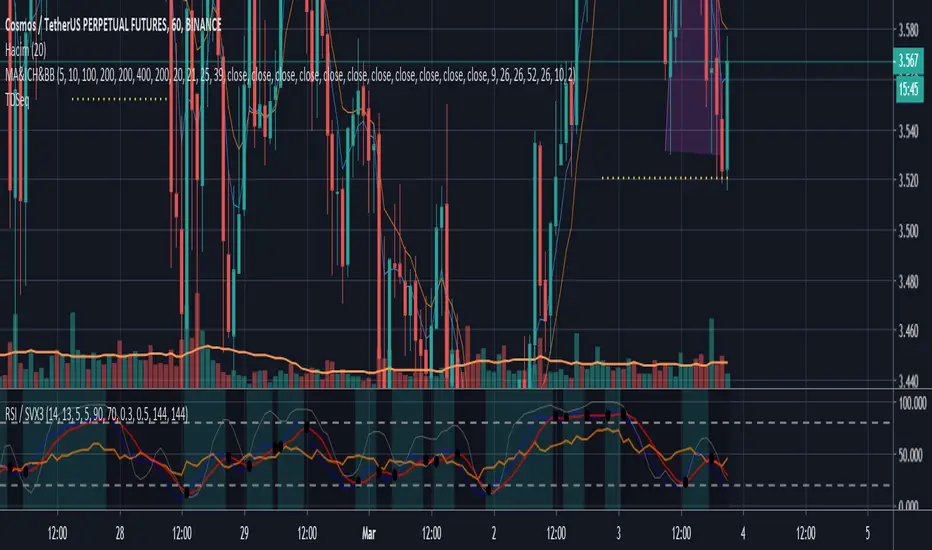
RSI / STOCH RSICan be used in any time frame, any market (crypto,stock and FX) and any symbol. Values changeable and turntable on/off.
Include's :
- RSI
- SRSI
RSI + STOCHRSI - combinedRSI + Stoch RSI combined script
Very usable for free accounts with indicator limits.
Use 2 indicators as 1

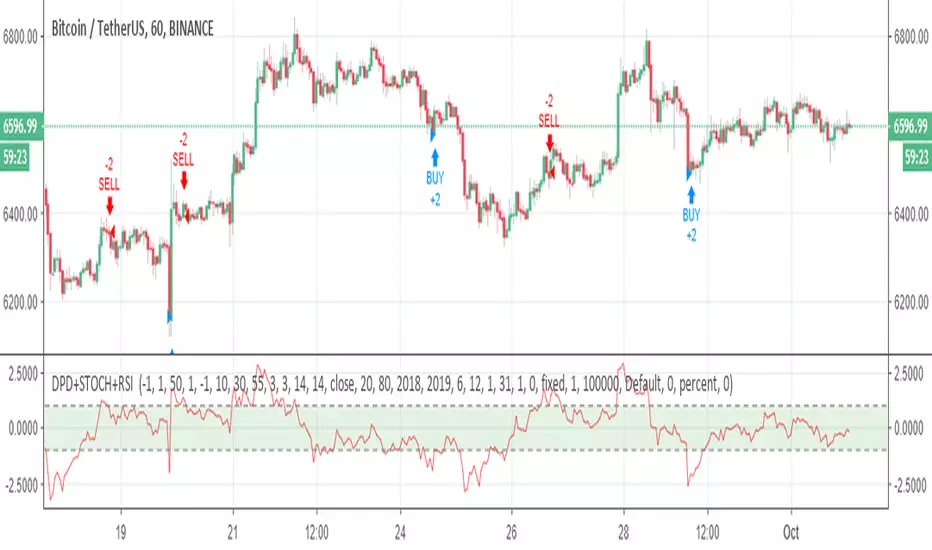
DPD+STOCH RSI +RSI Combination of DPD ,STOCHRSI and RSI indicators. Be careful for percantage selection to fit your candle size.
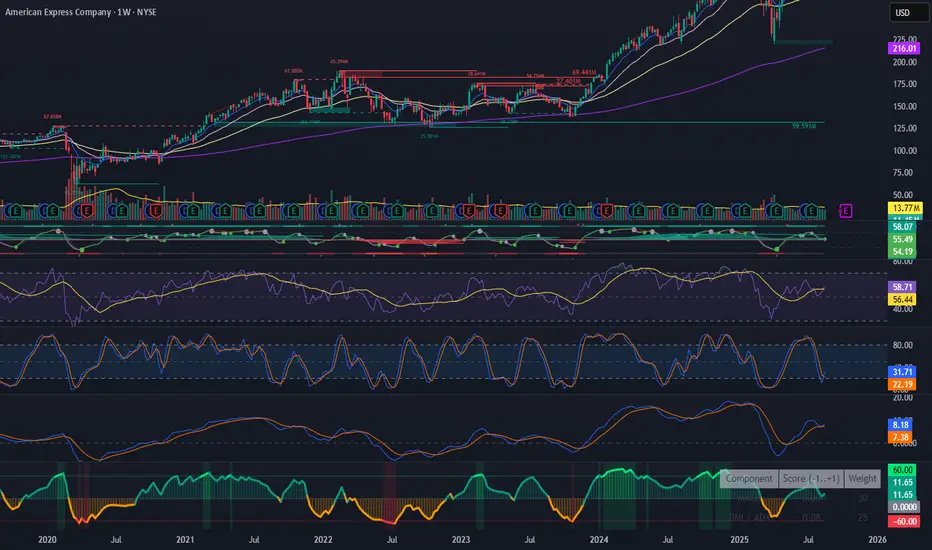
Fear & Greed Oscillator — LEAP Puts (v6, manual DMI/ADX)Fear & Greed Oscillator — LEAP Puts (v6, manual DMI/ADX) is a Puts-focused mirror of the Calls version, built to flag top risk and momentum rollovers for timing LEAP Put entries. It outputs a smoothed composite from −100 to +100 using slower MACD, manual DMI/ADX (Wilder), RSI and Stoch RSI extremes, OBV distribution vs. accumulation, and volume spike & direction, with optional Put/Call Ratio and IV Rank inputs. All thresholds, weights, and smoothing match the Calls script for 1:1 customization, and a component table shows what’s driving the score. Reading is simple: higher values = rising top-risk (red shading above “Top-Risk”); lower values = deep dip / bounce risk (green shading). Built-in alerts cover Top-Risk, Deep Dip, and zero-line crosses for clear, actionable cues.
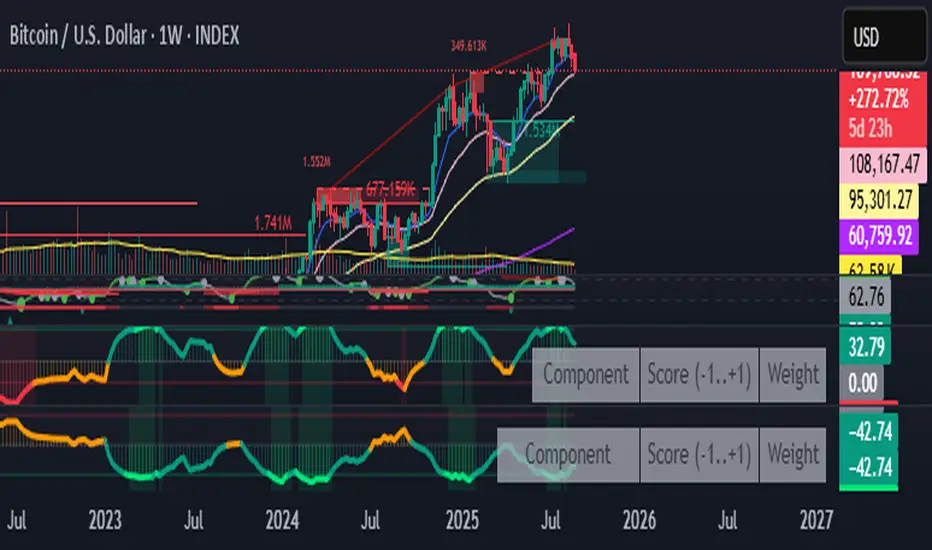
Fear & Greed Oscillator — LEAPs (v6, manual DMI/ADX)Fear & Greed Oscillator for LEAPs — a composite sentiment/trend tool that highlights long-term fear/greed extremes and trend quality for better LEAP entries and exits.
This custom Fear & Greed Oscillator (FGO-LEAP) is designed for swing trades and long-term LEAP option entries. It blends multiple signals — MACD (trend), ADX/DMI (trend quality), OBV (accumulation/distribution), RSI & Stoch RSI (momentum), and volume spikes — into a single score that ranges from –100 (extreme fear) to +100 (extreme greed). The weights are tuned for LEAPs, emphasizing slower trend and accumulation signals rather than short-term noise.
Use Weekly charts for the main signal and Daily only for entry timing. Entries are strongest when the score is above zero and rising, with both MACD and DMI positive. Extreme Fear (< –60) can mark long-term bottoms when followed by a recovery, while Extreme Greed (> +60) often signals overheated conditions. A cross below zero is an early warning to reduce or roll positions.
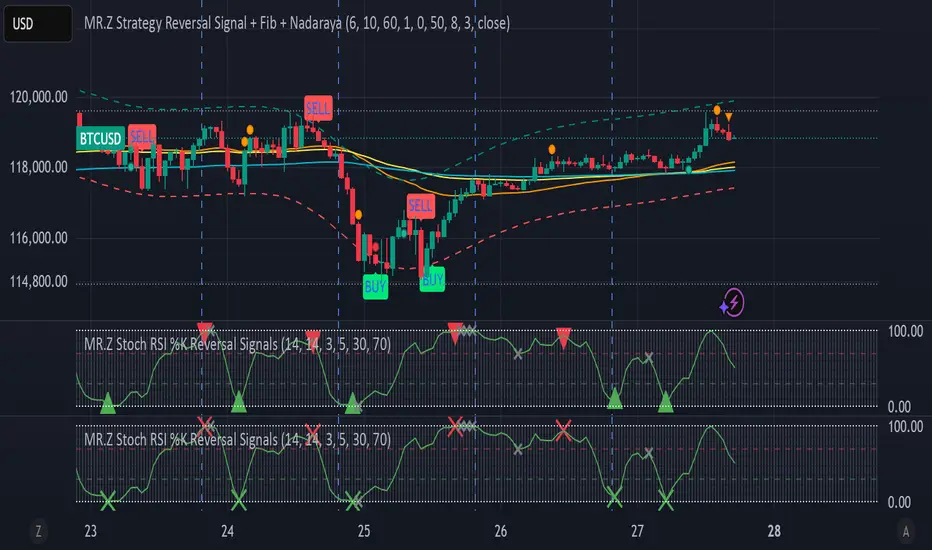
MR.Z Stoch RSI %K Reversal Signals🟢 K Strategy Description
The K Strategy is a momentum-based trading technique using the %K line from the Stochastic Oscillator. It is designed to detect potential reversal points in price trends by identifying extreme conditions of overbought and oversold levels.
✅ Core Logic:
The strategy monitors the %K line (a smoothed form of RSI momentum).
A Buy Signal is triggered when:
The %K line dips to or below a defined lower threshold (commonly 30 or less).
This suggests the asset is oversold and may soon reverse upward.
A Sell Signal is triggered when:
The %K line peaks above an upper threshold (commonly 70 or more).
This suggests the asset is overbought and may reverse downward.
⚙️ Adjustable Parameters:
K Length: The sensitivity of the %K calculation (affects how fast it responds).
Buy Level: Set your oversold trigger (e.g., 20–40).
Sell Level: Set your overbought trigger (e.g., 60–100).
Signal Smoothing (optional): Helps reduce noise and avoid false triggers.
📈 Use Case:
This strategy is effective in ranging markets where prices frequently oscillate. It can also be used with other indicators (like EMA, volume filters, or price action confirmation) to increase accuracy in trending conditions.
Candle Mania [starlord_xrp]This indicator locates and places markers on known bullish and bearish candles. All candles can be turned on/off in the settings. It also has a setting to display RSI/MFI/Stoch RSI indications of oversold and overbought areas in the background showing areas of higher interest. The last feature is a setting that allows you to see where Heiken-Ashi has switched from green to red and vice-versa. Please let me know if there is anything that you would like to see added or any improvements.

electroNIK - Stoch-RSIThis is a script which will add Stochastic RSI on your graphs, supporting all timeframes

Template Signal IndicatorThis script is an example on how to create a custom indicator that produce start/end long/short deal signals based on configurable conditions from internal and external indicators.
This indicator can be used as an external indicator to other strategies like "Template Trailing Strategy" that will execute the deals and enter the desired positions based on the signals produced by this script.
Combining this script with the aforementioned strategy (or any other compatible) has the advantage that you can backrest the results of your custom deal conditions. Also additional functionality that is provided by the strategy can be utilized (e.g. Take Profit Targets, Trailing Stop Loss etc.).
In this particular example I combined the RSI and Stoch RSI indicators (internal) with the "Trend Explorer" indicator (external) so it produces buy and sell signals based on the logic I defined in the input tab of this indicator. To combine "indicators on indicators" you need Pro+ TV subscription.
The convention I use to communicate the signals is the following (2 -> enter long, 1 -> exit long, -2 -> enter short, -1 ->exit short). However, this convention is also configurable in the consumer/strategy script "Template Trailing Strategy" so make sure that both script "speak the same language" before procced.

Stochastic RSI (50 Line)This Stoch RSI has a 50 line to help determine if the momentum is going up or down. Under 50, down and above 50 is up.