Trailing Stops/Choose a Day of the WeekThis would be my second ever published strategy. It is almost the same as my first ever published script . I've been working primarily on UGAZ and DGAZ .
This is basically a statistical trade. It buys every morning near market open (or by choosing a "time constraint"), then immediately places a trailing stop at a specified amount in ticks (if used on UGAZ a tick = $0.01, if used on NG at tick = $0.001). I've found between 2% and 3% works well for the trailing stop (ie. if UGAZ = $75, a 3% trailing stop = $2.25)
-----What is different from my first strategy?------
You can test the trailing stop strategy one 1 day of the week. Days of the week are assigned numbers. Sunday=1, Monday=2, Tuesday=3 and so on. Just choose a number that correlates to the day of the week you want to test. The Trailing stop may go past that day, that's a good thing if it's making money.
-- Go long/Short is just that, it will buy shares/contracts or short them.
-- Trades per day. This may not be a good choice, when left on "2", it will trade once per day. If set above 2 and there is time left for another trade, an order will enter on the open of the next candle. I'm am still working on ideas for this.
-- Time constraints. When you select this check box, the strategy will limit an entry to the time specified below the "Use Time Constraints" check box. An Exit order will still continue past this window of time until it is stopped out.
---- very important ----
Due to decay, leveraged ETFs will give false results if the price gets far out of range. For example, your ETF is trading around $20 and you choose a 1 hour chart, it may back test back to a time before a reverse split. If the price gets to be too large, like $200, or $1200, the movement on the chart creates false indication of profit/loss.
--- Most important. ---
Do not trade off this strategy, you may lose lots of money. This is for educational use only.
Good luck
Tìm kiếm tập lệnh với "Trailing stop"

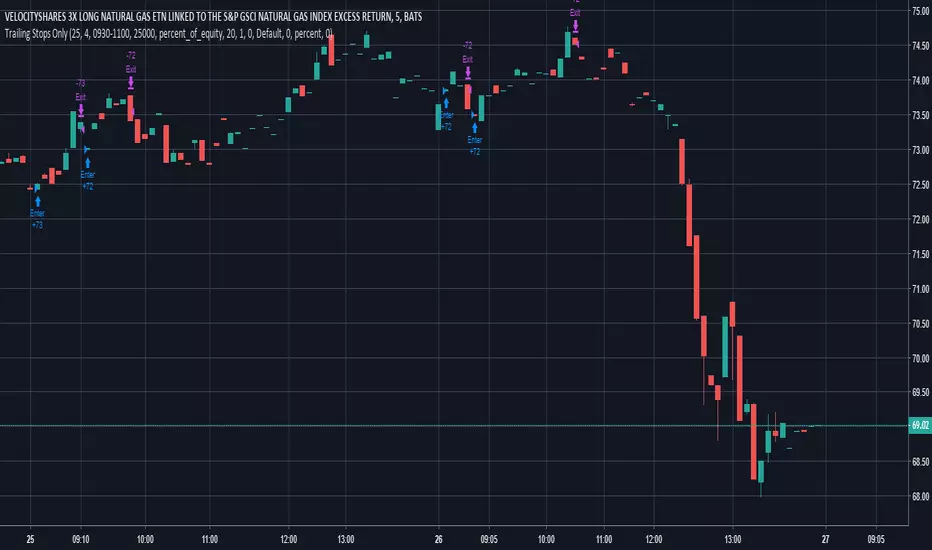
Trailing Stops Only - For Leveraged ETFs (UGAZ/DGAZ)Looking for Statistical trades that work. This one seems to work on some Leveraged ETFs with a lot of noise like UGAZ/DGAZ. It can also be used on Futures Contracts, but be sure to change up the type of investment from % of equity to contracts. Also one point I'm trying to make with this strategy is the trades are best made in the morning around market open. When used with Contracts, be sure to make use of the time settings. It will limit buying between the hours set. Selling will occur at any time the trailing stop is triggered.
This Strategy is best used on 5min or 15min charts.
!!!! very important !!!!
Due to decay, leveraged ETFs will give false results if the price gets far out of range. For example, your ETF is trading around $20 and you choose a 1 hour chart, it may back test back to a time before a reverse split. If the price gets to be too large, like $200, or $1200, the movement on the chart creates false indication of profit/loss.
Most important. Do not trade off this strategy, you may lose lots of money. This is for educational use only.
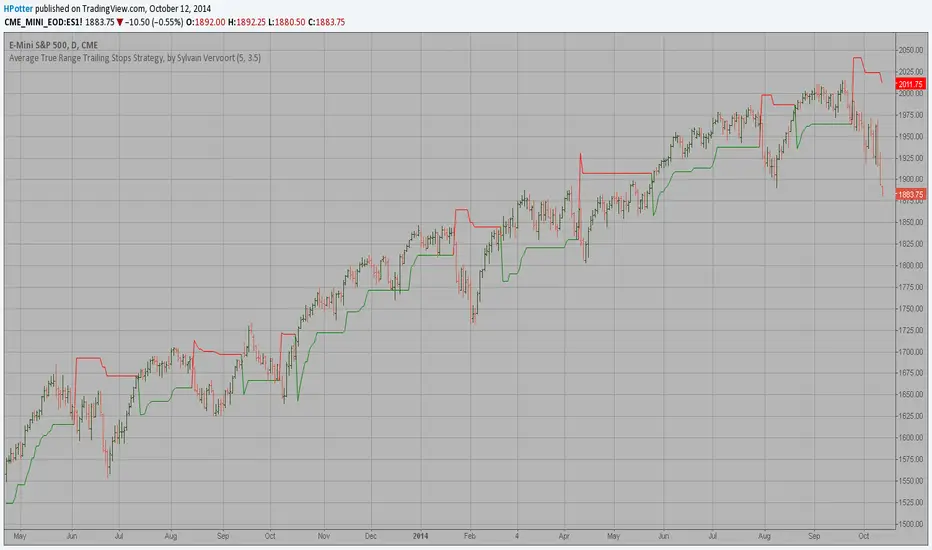
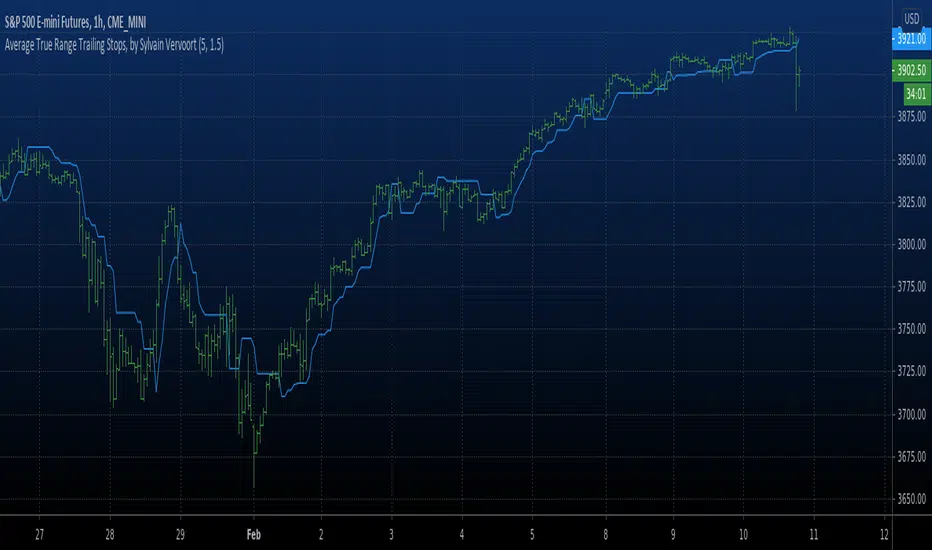
Average True Range Trailing Stops Strategy Average True Range Trailing Stops Strategy, by Sylvain Vervoort
The related article is copyrighted material from Stocks & Commodities Jun 2009

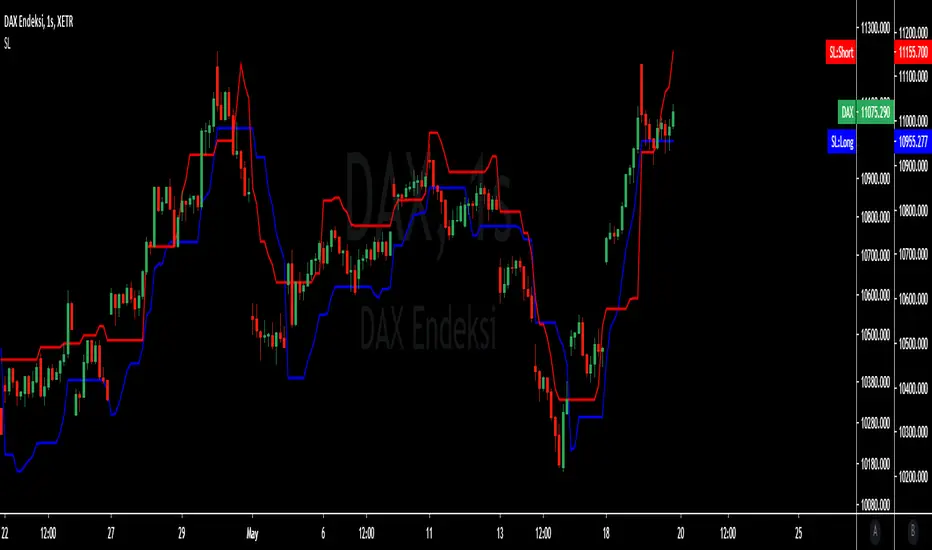
Wilder's Volatility Trailing Stop Strategy with various MA'sFor Educational Purposes. Results can differ on different markets and can fail at any time. Profit is not guaranteed.
This only works in a few markets and in certain situations. Changing the settings can give better or worse results for other markets. This strategy is based on Wilder's Volatility System. It is an ATR trailing stop that is used for long term trends. This strategy focuses on the trailing stop alone and goes long and short only when it goes above or below the trailing line. It is similar to Donchian channels except it does not include the certain period channel breakout, only the trailing signal. This is only the trailing stop and an attempt to show how well it works standalone as Wilder described.
In his book, Wilder recommends a multiplier of 2.8-3.1 and an ATR lookback of 7 periods along with a running moving average or otherwise known as Wilder's moving average. The calculation and programming part for the trailing stop varies everywhere. I opted to keep it as simple and accurate as I could think of and interpret from the book. The variations to these types of indicators are numerous unfortunately, but Wilder seems to be the original author of ATR and this ATR-based trailing stop. In his book he says to use the significant closing price or highest/lowest closing price for the calculation part but I also included the option of choosing the highest high and lowest low, and the option to choose various moving averages in case anyone wants to experiment.
Comparing this and Donchian channels, it seems that a 2.5 multiplier is somewhat similar to the middle band of DCs and a 3.0 multiplier is somewhat similar to a double length middle band of DCs. It's hard to say which is the better trailing stop for a long term strategy. It's hard to beat the simplicity of DCs but maybe some might find a need for more inputs in a trailing stop or maybe an ATR based one like Wilder's can work better depending on what setting or strategy it's used in.

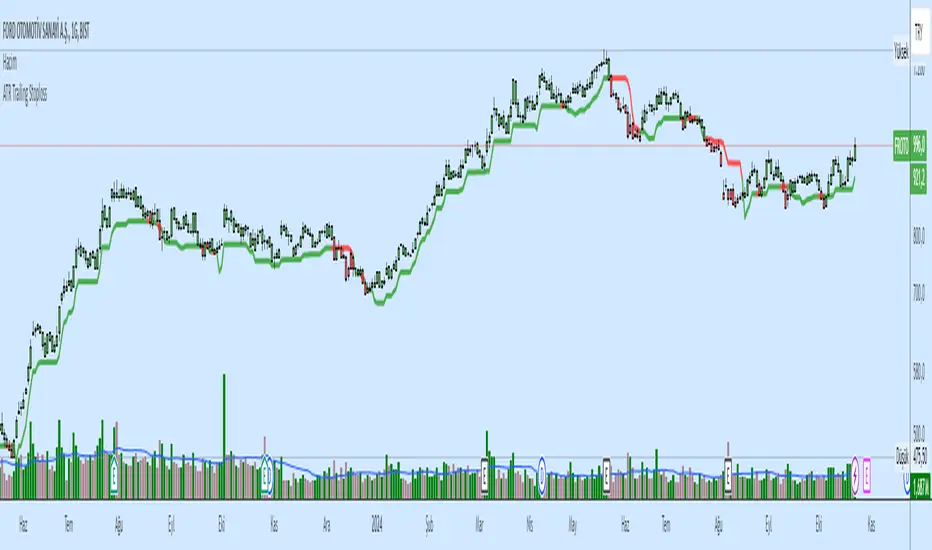
ATR for Trailing StopThe calculation of this ATR is based on the low of yesterday in order to not change continuously during the day.
You can use this indicator to create a trailing stop taking into account volatility on the nATRPeriod previous days.
It also always go up as a trailing stop should. It only goes down the price reaches the trailing stop.
Average True Range Trailing Stops ColoredAverage True Range Trailing Stops Strategy, by Sylvain Vervoort
The related article is copyrighted material from Stocks & Commodities Jun 2009
Average True Range Trailing Stops, by Sylvain Vervoort Average True Range Trailing Stops, by Sylvain Vervoort
The related article is copyrighted material from Stocks & Commodities Jun 2009
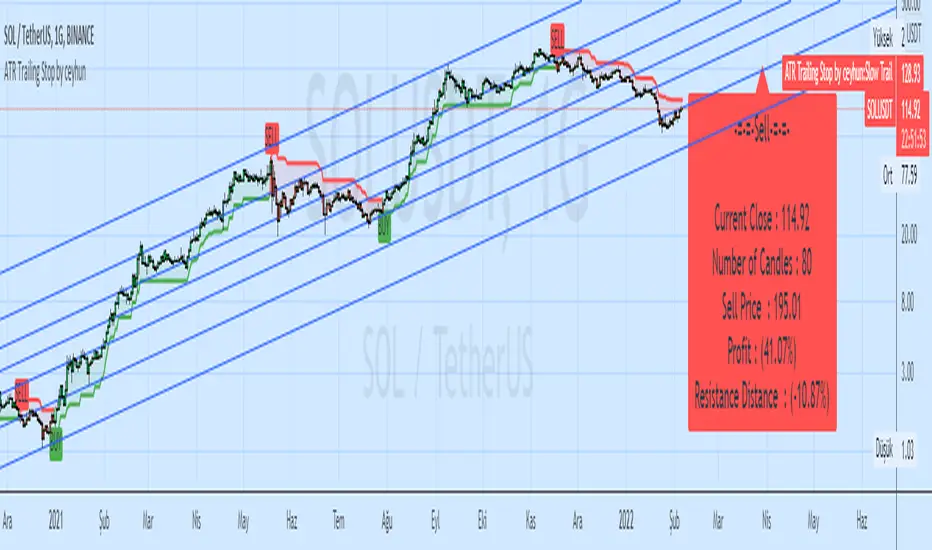
ATR Trailing Stop by ceyhunSame coding only coloring and information panel was added.
CDC ATR Trailing Stop V2.1 (2013)
//Barcolor
Green = Trail1 > Trail2 and close > Trail2 and low > Trail2
Blue = Trail1 > Trail2 and close > Trail2 and low < Trail2
Red = Trail2 > Trail1 and close < Trail2 and high < Trail2
Yellow = Trail2 > Trail1 and close < Trail2 and high > Trail2
//It gives White color where there is deterioration.
//InfoPanel
Buy Price = Blue draws the circles at the purchase price.
Profit Long>20 = Risk level taken as a percentage, I got the highest 20%, you can determine as you wish.
Sell Price = Red draws the circles at the purchase price.
Profit Short>20 = Risk level taken as a percentage, I got the highest 20%, you can determine as you wish.
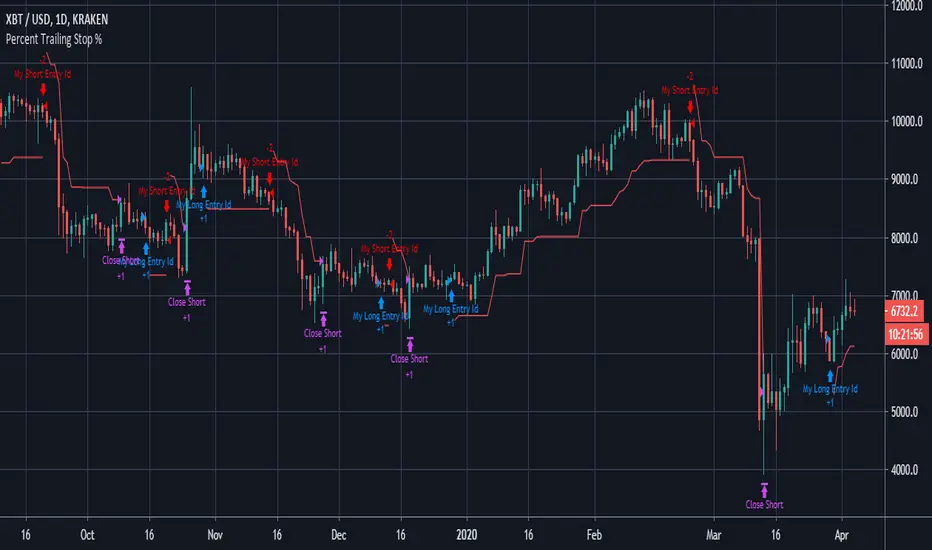
Percent Trailing Stop (%) - For Study Scripts===========
Percent Trailing Stop (%) - { FOR STUDY SCRIPTS }
===========
Wow - this is an example of how to implement Alerts relating to a Trailing Stop (%) within your Study Script. It's taken a bit of effort to get this working but I think we got there!
Alerts include Open Long/Short, Trailing Stop Hit, and (the most important one) Movement of Trailing Stop! <- this is actually really quite good, by the way! :)
You can ignore the actual entry/exit orders - they're based on a simple MA cross and are therefore NOT relevant, NOT profitable and NOT recommended!
You should be using this code as a way of adding a Trailing Stop to your own scripts - hope it helps!
Set your "Open Long/Short" Alert to "Once per Bar Close" - Set your "Trailing Stop Hit" Alert to "Once per Bar" - Set your "Move TSL" Alert to "Once per Bar Close". - You're all done! Enjoy.
-----------
Good Luck and Happy Trading!

Percent Trailing Stop %===========
Percent Trailing Stop %
===========
Another Stop Loss Indicator today - our last Fixed SL/TP script went down quite well, this one is for adding a Percent Trailing Stop from Entry Price to your own strategy.
You can ignore the actual entry/exit orders - they're based on a simple MA cross and are therefore NOT relevant, NOT profitable and NOT recommended!
You should be using this code as a way of adding a % Trailing Stop to your own scripts - hope it helps!
You should also notice that a generally considered losing strategy (a simple MA cross) could actually become profitable with careful money management - try combining this Trailing Stop script with our Fixed Stop/Take Profit script for really accurate management of your capital.
-----------
Good Luck and Happy Trading!
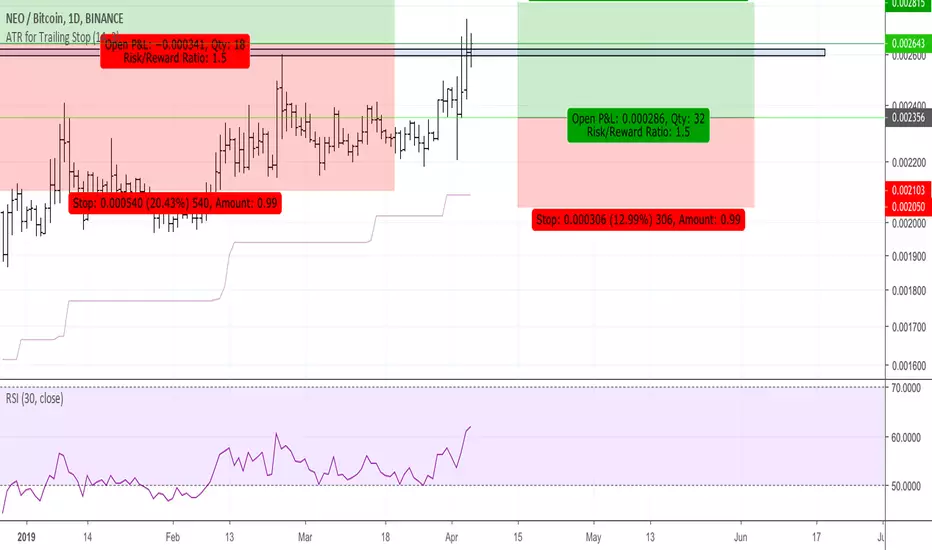
ATR for Trailing StopAn ATR (Average True Range) can be used to position a trailing stop
In this script, the true range of today is calculated based on the low of yesterday in order to be more stable.
It only goes up, as a trailing stop should do.
It only goes down when the trailing stop is reached by the price.

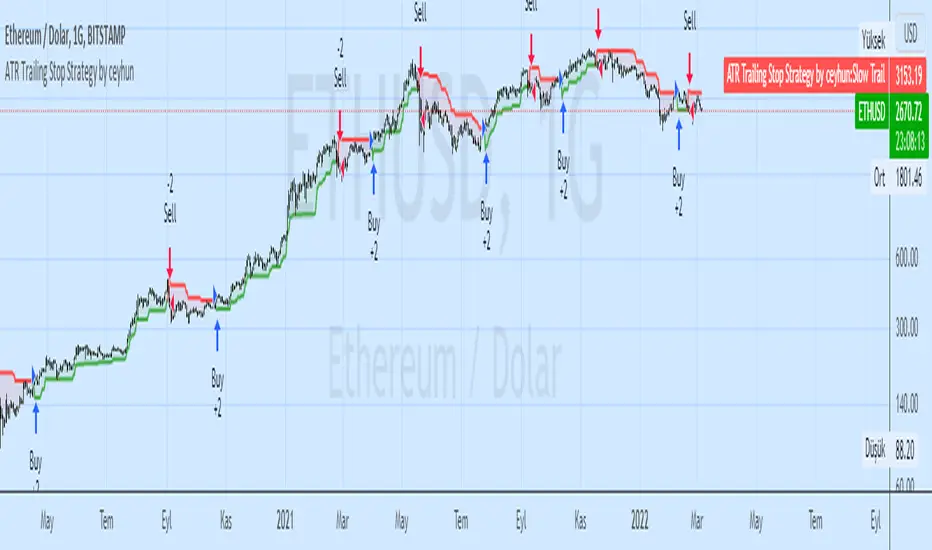
ATR Trailing Stop Strategy by ceyhunSame coding only coloring and strategy version added
//Barcolor
Green = Trail1 > Trail2 and close > Trail2 and low > Trail2
Blue = Trail1 > Trail2 and close > Trail2 and low < Trail2
Red = Trail2 > Trail1 and close < Trail2 and high < Trail2
Yellow = Trail2 > Trail1 and close < Trail2 and high > Trail2
//It gives White color where there is deterioration.
Let's not use InfoPanel in strategy, it would be wrong as it signals the next day.
Simple Trailing stopSince my exchange doesn't support trailing stop I made a script for it.
It is fully configurable, which means you can set the bars for calculation, the offset and sources for trigger and calculation.
The original purpose for me was to send a command to my bot. If you like it please comment and check out my other scripts.
CDC ATR Trailing Stop V1Based on the standard ATR trailing stop indicator.
A few minor tweaks as used in Chaloke.com's community

Trailing Stop ProTrailing Stop Pro is a sophisticated TradingView indicator designed to enhance your trading strategy by dynamically managing trailing stops based on market volatility. This tool leverages the Average True Range (ATR) to adjust stop levels, providing traders with a robust mechanism to protect profits and minimize losses.
Key Features:
Dynamic Trailing Stops: Automatically adjusts stop levels using ATR, allowing for responsive and adaptive risk management.
Customizable Inputs: Tailor the indicator to your trading style with adjustable parameters such as ATR Length, ATR Multiplier, and Source Vector.
Visual Clarity: Distinct color settings for long and short stops, with adjustable line thickness and transparency, ensuring clear visualization on your charts.
Professional Grade: The "Pro" designation signifies advanced features suitable for both novice and experienced traders seeking reliable and efficient stop management.
How It Works:
To set up the indicator, begin by defining the Chrono Point, which specifies the exact time you want the trailing stop mechanism to activate. This allows for precise control over when your stops begin to trail. Next, set the Credit Unit as the initial entry price for your trade, serving as the baseline from which the trailing stops will adjust.
The indicator uses ATR-based adjustments to determine stop levels. Customize the sensitivity of the trailing stop by adjusting the ATR Length (default is 14) and ATR Multiplier (default is 0.5). A longer ATR length smooths out volatility, while a higher multiplier increases the distance of the stop from the price.
Select your Source Vector from "High/Low," "Close," or "Open" prices as the basis for stop calculation. This flexibility allows you to align the indicator with your preferred trading strategy. The indicator plots trailing stops directly on the chart, with color-coded lines indicating long (teal) and short (red) positions. You can adjust the line thickness and transparency for optimal visibility.
The Mission Status feature automatically detects whether the trade is long or short and adjusts the trailing stop accordingly. If the price hits the trailing stop, the trade is considered exited, and the indicator calculates the profit or loss percentage.
Benefits:
Risk Management: Protect your trades from adverse market movements while locking in profits as prices move favorably.
Automation: Reduce manual intervention with automatic stop adjustments, allowing you to focus on strategic decision-making.
User-Friendly Interface: Intuitive settings and clear visual cues make it easy to integrate into your existing trading workflow.
Conclusion:
Trailing Stop Pro is an essential tool for traders looking to enhance their risk management strategies with precision and ease. By automating the trailing stop process and providing clear visual feedback, this indicator empowers you to navigate the markets with confidence. Whether you're a seasoned trader or just starting, Trailing Stop Pro offers the functionality and flexibility needed to optimize your trading performance.
The Trailing Stop Pro indicator is a tool designed to assist traders in managing risk and optimizing their trading strategies. However, it should not be considered as financial advice or a guarantee of profitability. Trading involves significant risk, and it is possible to lose more than your initial investment. Users are encouraged to thoroughly test the indicator in a demo environment and consider their own financial situation and risk tolerance before using it in live trading. Past performance is not indicative of future results, and users should seek advice from a qualified financial advisor if needed.

Trailing Stops & Targets Trailing Stops & Targets Pro is a comprehensive position management tool that automatically calculates optimal stop loss levels and profit targets for any trade. Whether you're a scalper, day trader, or swing trader, this indicator eliminates the guesswork from trade management.
The indicator combines multiple methodologies—ATR-based volatility stops, swing-based structural stops, and intelligent trailing stops—to give you precise levels that adapt to market conditions.

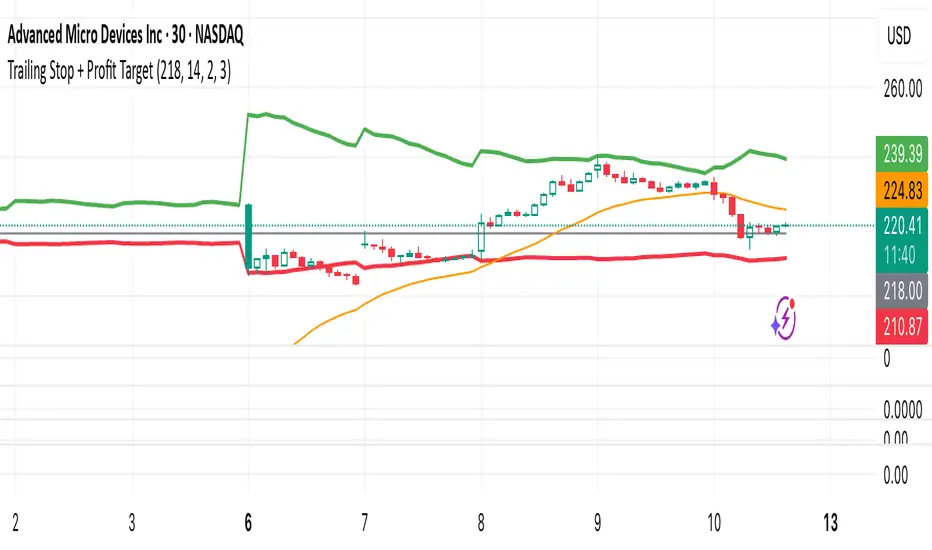
Trailing Stop + Profit TargetTrailing Stop + Exit Confirmation is a manual-entry tool designed to help traders visually manage trades with dynamic trailing stops and profit targets, based on ATR projections with a toggle button to reset calculations in real-time. Contains a “Short” toggle to work for short positions as well, which automatically inverses the PT and SL lines when toggled on.
Primary Calculations: Utilizes a manually adjustable entry price (default: $5 — ideal for options traders) that (when adjusted and recalculated) populates the chart with an adaptive ATR-based trailing stop line, dynamic profit target line, and optional 21-day EMA for directional context.
Below the Entry Price is a fully functional, manual reset toggle to reset all parameters mid-session to assess risk-reward based on entry price, risk tolerance, etc. followed by the “Short” toggle.
Primary Directions/Functions:
Enter your trade price in the “Manual Entry Price” field.
The script will begin plotting a dynamic trailing stop and profit target based on current market conditions.
Use the reset toggle to clear all calculations and start a new position at any time.
Customizable Settings:
ATR Length and Multiplier
Risk/Reward Profit Target Multiplier
Toggle to show/hide trailing stop, target, and EMA lines
Options Trading Use Case:
This tool is especially useful for options traders looking to manage premium-based entries (e.g., $5.00) on intraday or swing trades. The dynamic stop and target lines provide clear visual cues for scaling out or exiting based on price action, while allowing for tighter or looser risk depending on volatility (ATR).
This tool does not auto-detect entries or backtest positions. It is intended to complement your entry signals, not generate them. I've written an Options Momentum Signal indicator you can find right here which functions well in tandem with this tool.
Made for traders who execute trades manually and want typical preset guidelines for profit and stop loss signals but lets you recalculate them by simply clicking a button, especially if any major news or downturn causes a big change in market conditions so you can make adjustments in real time.
Trailing Stop with RSI - Momentum-Based StrategyTrailing Stop with RSI - Momentum-Based Strategy
Description:
The Trailing Stop with RSI strategy combines momentum analysis and trailing stop functionality to help traders identify potential entry and exit points in their trading decisions. This strategy is suitable for various markets and timeframes.
Key Features:
Momentum Analysis: The strategy incorporates momentum indicators to identify potential buying and selling opportunities based on momentum shifts in the price.
Trailing Stop Functionality: The strategy utilizes a trailing stop to protect profits and dynamically adjust the stop loss level as the trade moves in the desired direction.
RSI Confirmation: The Relative Strength Index (RSI) is included to provide additional confirmation for trade entries by considering overbought and oversold conditions.
How to Use:
Entry Conditions: Long positions are triggered when positive momentum is detected, and the RSI confirms an oversold condition. Short positions are triggered when negative momentum is detected, and the RSI confirms an overbought condition.
Trailing Stop Activation: Once a position is opened, the trailing stop is activated when the specified profit level (as a percentage) is reached.
Trailing Stop Level: The trailing stop maintains a stop loss level at a specified distance (as a percentage) from the highest profit achieved since opening the position.
Exit Conditions: The trailing stop will trigger an exit and close all positions when the trailing stop level is breached.
Markets and Conditions:
This strategy can be applied to various markets, including stocks, forex, cryptocurrencies, and commodities. It can be used in trending and ranging market conditions, making it versatile for different market environments.
Important Considerations:
Adjust Parameters: Traders can modify the length of the momentum and RSI indicators to suit their preferred timeframe and trading style.
Risk Management: It is recommended to consider appropriate position sizing, risk-to-reward ratios, and overall risk management practices when using this strategy.
Backtesting and Optimization: Traders are encouraged to backtest the strategy on historical data and optimize the parameters to find the best settings for their chosen market and timeframe.
By incorporating momentum analysis, trailing stop functionality, and RSI confirmation, this strategy aims to provide traders with a systematic approach to capturing profitable trades while managing risk effectively.

Trailing Stop LossTrailing stop loss indicator to determine when to exit a position.
Multiple trailing stop loss calculation techniques are implemented:
ATR: Determines stop loss using a gap from recent highest value, that gap is defined by the ATR value and a multiplier
MA: Just a simple moving average used as a stop-loss
Percentage: Uses a percentage of the price
The script also implements alerting to be notified when the stop loss price is reached.

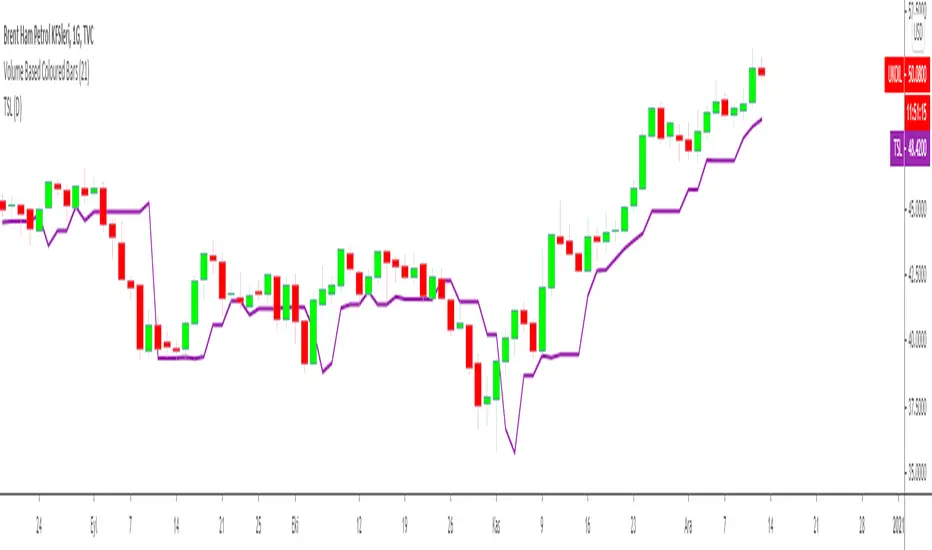
Trailing Stop Loss Indicator by KıvanÇ fr3762TRAILING STOP LOSS INDICATOR is a helpful tool for traders to help one of the greatest problems that they face: where to sell?
by using trailing stop loss you can easily decide and see possible downward movements and understand if you are in a safe zone.
Using Trailing Stop Loss is just simple:
Go short/ Sell when price crosses down the indicator,
Stay on long position if prices are above the indicator.
The indicator is calculated from previous Lows and doesn't the value won't change until prices makes higher lows.
TURKISH EXPLANATION:
İz Süren Stop Loss İndikatörü
Adım 1- bu günün düşük fiyatından geriye doğru, daha düşük fiyatlı bir günle karşılaşıncaya kadar yatay bir çizgi çizin
bu sizin birinci countback’ iniz olacak.
Adım 2- bu yeni düşük günün düşük fiyatından geriye doğru tekrar bir başka düşük güne gelene kadar yatay bir çizgi
çekin. Bu sizin ikinci countback’ iniz olacak.
Adım 3- bu ikinci düşük günün düşüğünden ileri bu günkü tarihe kadar yatay bir çizgi çekin bu sizin talimat
verdiğinizde stop-loss noktanız oluyor.
Kural 1- asla aşağıya doğru stop koymayın. Eğer yeni stop-loss noktanız öncekinden daha düşükse onu atıyorsunuz.
Bu kural asla bozulmamalı.
Kural 2- countback çizginiz üzerindeki aynı düşük fiyata denk gelen günleri yok sayın. İkinci contback çizginizi çekmek
için ilkinden daha düşük bir nokta bulmalısınız. Eğer aynı düşük fiyata sahip bir çubuğa denk gelirseniz daha düşüğünü
buluncaya kadar devam edin. Gerçekten hepsi bu kadar. Bu kuralları uygulayarak stop-loss noktamızı her yeni günün
datası eklendikçe uzatabiliriz.
drive.google.com
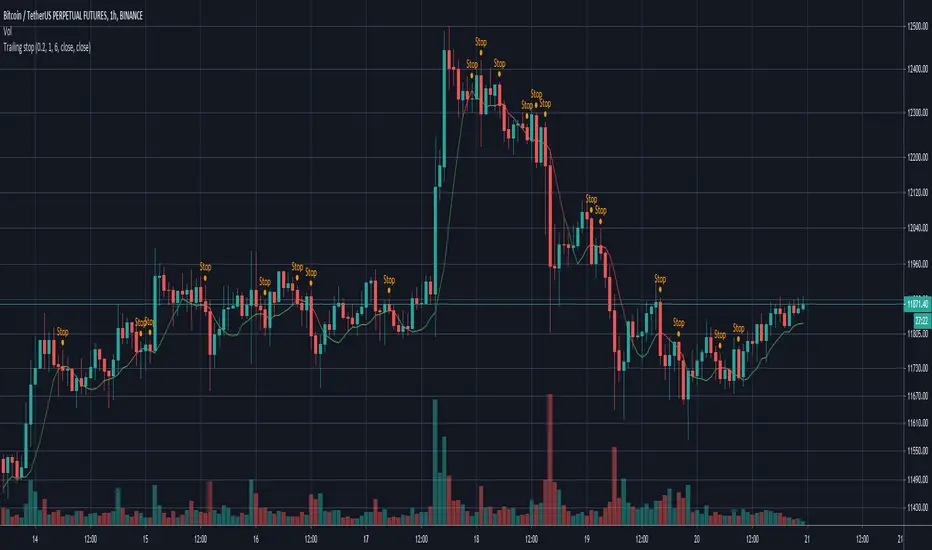
Trailing stopHi all!
This script helps to alert you when a trailing stop is hit. More specifically it alerts you when the low of the candle crosses below your trailing stop. A trailing stop follows a price positive movements. It raises your stop when price goes up, but keeps it at the same level if price goes down, so it "locks" in your profit. You define your long entry bar and choose one of the following methods for the stop:
ATR
The Average True Range (ATR) is popular to trail stops. The trailing stop is raised by the low minus the ATR (times a factor that can be set under the settings for ATR).
EMA
The Exponential Moving Average (EMA) can be used to trail your stop. When the low goes below the EMA an alert is sent about the stop. Its length can be set in the settings.
SMA
The Simple Moving Average (SMA) can be used to trail your stop. When the low goes below the SMA an alert is sent about the stop. Its length can be set in the settings.
Source
An external source can be useful as a stop signal. You can use this option that will stop you out when the signal returns anything else than "na". E.g. if you want a stop when KivancOzbilgic script "SuperTrend" () turns red, you set the source to "Supertrend: Down Trend". This option will not draw pretty things on the chart, but it will alert you!
Please note that this is for long entries only.
Best of trading luck!
