QQEThe Metastock version of Quantative Qualitative Estimation with two trailing stop lines and more options
Yellow line can be hidden if its too many signals and expirement with the Slow/Fast Trailing stop lines.
Tìm kiếm tập lệnh với "Trailing stop"
SuperTrend BFThe SuperTrend overlay by Olivier Seban provides an excellent 'trailing stop' that can be used with any bar length for bullish or bearish moves. My preferred timeframe is weekly for capturing huge (Super) moves. For instance applying it to AAPL, this baby would have us reeling in a fivebagger over the course of three years. Patience and holding your nerve are key to trend following and I like to think of SuperTrend as a great big visual 'crutch' right there on the chart.
Essentially this is an average true range trailing stop, of which there are several versions available (eg see the Sylvain Vervoort version programmed by H Potter). SuperTrend differs by referring the stop back from the middle of the bar (High+Low)/2. This is similar to using the Vervoort with a tweak to the number of ATR's considered. At the end of the day its a matter of preference and what works best for you.

CM_Parabolic SAREnhanced Parabolic Sar
Simply Enhances Default Parabolic SAR by creating Two Color Options, One for UpTrend, Other for DownTrend
Ability To Turn On/Off The Up Trending Parabolic SAR, And The Down Trending Parabolic SAR
Great Indicator For Trailing Stops.

TrintityTrendIntroducing TrinityTrend
A multi-signal indicator combining:
Candle TrendStrength
SuperTrend logic
TTM Squeeze detection
Built for clarity, momentum, and volatility awareness—across any timeframe.
TrendStrength Mode
Candle coloring reflects directional conviction.
Strong uptrend
Strong downtrend
Neutral or indecisive
Helps traders stay with momentum and avoid chop.
SuperTrend Overlay
SuperTrend Logic Dynamic trailing stop based on volatility.
🟩 Price above = bullish bias
🟥 Price below = bearish bias
Great for swing entries and exits.
TTM Squeeze Detection
TTM Squeeze Mode Detects compression zones before breakout.
Squeeze on = buildup (You can change the color of this)
Pairs well with TrendStrength for timing entries.
Multi-Timeframe Versatility
Multi-Timeframe Ready:
Intraday scalping
Daily swing setups
Weekly macro bias
Toggle modes to match your strategy

EMA Multi-Type StrategyThis is a price-action + EMA trend strategy that:
Uses EMA as trend filter
Looks for pullbacks and structure shifts near the EMA
Trades 3 different entry patterns (TYPE 1 / 2 / 3)
Allows:
Fixed SL–TP (RR based)
OR ATR trailing stop
Optionally blocks opposite trades until the current trade exits
Think of it as:
“Trade continuation after pullback in EMA trend, with multiple confirmation strengths.”

Anya1This script is a **Trend-Following Momentum Strategy** specifically designed for **Gold (XAUUSD)** but applicable to other assets. It combines an oscillator (to find entry points) with two moving averages (to ensure you are trading with the trend).
Here is a breakdown of how the logic works and how to read the signals on your chart.
---
### 1. The Strategy "Gears" (The Filters)
The script uses a "triple-filter" system. A signal is only generated when all three of these conditions click into place at the exact same time:
* **Gear 1: Momentum (Cipher Twister):** This oscillator looks for "turning points." It identifies when the market is exhausted.
* **Buy:** The momentum lines cross while **below the zero line** (recovering from oversold).
* **Sell:** The momentum lines cross while **above the zero line** (dropping from overbought).
* **Gear 2: Medium-Term Trend (MA 25):** The price must be on the "correct" side of the **Yellow Line**. This ensures that the immediate price action is moving in your favor.
* **Gear 3: Macro Trend (MA 150):** This is the final gatekeeper (the **White Line**). You are forbidden from buying if the price is below this line, and forbidden from selling if it is above. This keeps you on the right side of the "Big Picture."
---
### 2. How to Read the Signals
| Signal | Chart Visual | Rule |
| --- | --- | --- |
| **BUY** | **Green "BUY" Label** | Price is above the Yellow & White lines + Oscillator crossed below zero. |
| **SELL** | **Red "SELL" Label** | Price is below the Yellow & White lines + Oscillator crossed above zero. |
**Visual Confirmation:** The script will also highlight the background in **Lime** for a Buy and **Red** for a Sell to make it impossible to miss.
---
### 3. Risk Management (The Exit)
This version is built as a **Strategy**, meaning it has a built-in "Exit Plan" for every trade:
* **Stop Loss (SL):** 100 Pips ($10.00 move in Gold).
* **Take Profit (TP):** 120 Pips ($12.00 move in Gold).
When a trade is entered, TradingView will automatically track the price. If it hits your target, the trade closes in profit. If it hits your stop, it closes to protect your capital.
---
### 5. Best Use Cases
* **Trending Markets:** This script thrives when Gold is in a clear uptrend or downtrend.
* **Timeframes:** It is most effective on the **15-minute (15M)** or **1-hour (1H)** charts. Lower timeframes (like the 1M) may hit the Stop Loss too frequently due to market noise.
**Would you like me to add a "Trailing Stop" feature, so the strategy locks in profits automatically as the price moves in your favor?**

0DTE SPY/QQQ Precision Scalper [3m Enhanced V2 - FIXED LINES]0DTE SPY/QQQ scalper built for the **3-minute chart** with **15m trend bias** and **1m confirmation**.
Targets **1 strike OTM** entries using VWAP/EMA pullbacks, OR breakout, MACD momentum, and RVOL filters.
Uses ATR-based **stop/target**, optional **breakeven + trailing stop**, and **time stop ~30 min** for 0DTE.
Includes strict risk controls: trade limits, cooldown, skip chop windows, and consecutive-loss lockout.

4 EMA + VWAP + UT Bot + SuperTrend + Daily Pivot Checklist📌 Description
This indicator is a multi-indicator trend confirmation checklist designed to simplify decision-making by combining several widely used technical tools into one clean on-chart dashboard.
The goal of this script is clarity, not complexity — helping traders quickly see market bias, trend strength, and trade direction without switching between multiple indicators.
🔹 Indicators Included
EMA 10 / 20 / 50 / 200
VWAP
UT Bot (ATR-based trailing stop with BUY / SELL signals)
SuperTrend (correct trend color logic)
Daily Pivot Point (today only)
All conditions are displayed in a YES / NO + BUY / SELL checklist panel for fast confirmation.
🔹 How to Use
Follow UT Bot BUY / SELL as the primary direction
Use EMA 200 & SuperTrend for overall trend bias
VWAP and Daily Pivot act as intraday filters
Stronger setups occur when most checklist conditions align
This indicator works best when combined with proper risk management and price action.
👥 Credits / Author Note
This script was conceptualized, tested, and refined by the publisher based on real trading use cases.
The development, logic structuring, and UI optimization were done collaboratively with AI-assisted scripting support to ensure clean code, clarity, and non-repainting behavior.
Final responsibility for trading decisions always remains with the user.
⚠️ Disclaimer
This indicator is provided for educational and informational purposes only.
It does not guarantee profits and should not be considered financial advice.
Always trade responsibly.

Aurora Volatility Bands [JOAT]Aurora Volatility Bands - Dynamic ATR-Based Envelope System
Introduction and Purpose
Aurora Volatility Bands is an open-source overlay indicator that creates multi-layered volatility envelopes around price using ATR (Average True Range) calculations. The core problem this indicator solves is that static bands (like fixed percentage envelopes) fail to adapt to changing market conditions. During high volatility, static bands are too tight; during low volatility, they're too wide.
This indicator addresses that by using ATR-based dynamic bands that automatically expand during volatile periods and contract during quiet periods, providing contextually appropriate support/resistance levels at all times.
Why These Components Work Together
The indicator combines three analytical approaches:
1. Triple-Layer Band System - Inner (1x ATR), Outer (2x ATR), and Extreme (3x ATR) bands provide graduated levels of significance
2. Volatility State Detection - Compares current ATR to historical average to classify market regime
3. Multiple MA Types - Allows customization of the center line calculation method
These components complement each other:
The triple-layer system gives traders multiple reference points - inner bands for normal moves, outer for significant moves, extreme for rare events
Volatility state detection tells you WHEN bands are expanding or contracting, helping anticipate breakouts or mean-reversion
MA type selection lets you match the indicator to your trading style (faster EMA vs smoother SMA)
How the Calculation Works
The bands are calculated using ATR multiplied by configurable factors:
float atr = ta.atr(atrPeriod)
float innerUpper = centerMA + (atr * innerMult)
float outerUpper = centerMA + (atr * outerMult)
float extremeUpper = centerMA + (atr * extremeMult)
Volatility state is determined by comparing current ATR percentage to its historical average:
float atrPercent = (atr / close) * 100
float avgAtrPercent = ta.sma(atrPercent, volatilityLookback)
float volatilityRatio = atrPercent / avgAtrPercent
bool isExpanding = volatilityRatio > 1.2 // 20%+ above average
bool isContracting = volatilityRatio < 0.8 // 20%+ below average
Signal Types
Band Touch - Price reaches inner, outer, or extreme bands
Mean Reversion - Price returns to center after touching outer/extreme bands
Breakout - Sustained move beyond outer bands during volatility expansion
Dashboard Information
Volatility - Current state (EXPANDING/CONTRACTING/NORMAL)
Vol Ratio - Current volatility vs average (e.g., 1.5x = 50% above average)
ATR - Current ATR value
ATR % - ATR as percentage of price
Zone - Current price position (EXTREME HIGH/UPPER ZONE/CENTER ZONE/etc.)
Position - Price position as percentage within band structure
Width - Total band width as percentage of price
Using SMA in settings:
How to Use This Indicator
For Mean-Reversion Trading:
1. Wait for price to touch outer or extreme bands
2. Check that volatility state is NORMAL or CONTRACTING (not expanding)
3. Look for reversal candlestick patterns at the band
4. Enter toward center MA with stop beyond the band
For Breakout Trading:
1. Wait for volatility state to show EXPANDING
2. Look for price closing beyond outer bands
3. Enter in direction of breakout
4. Use the band as trailing stop reference
For Volatility Analysis:
1. Monitor volatility ratio for regime changes
2. CONTRACTING often precedes large moves (squeeze)
3. EXPANDING confirms trend strength
Using VWMA and Mean Reversion Signal/MR:
Input Parameters
ATR Period (14) - Period for ATR calculation
Inner/Outer/Extreme Multipliers (1.0/2.0/3.0) - Band distance from center
MA Type (EMA) - Center line calculation method
MA Period (20) - Period for center line
Volatility Comparison Period (20) - Lookback for volatility state
Timeframe Recommendations
15m-1H: Good for intraday mean-reversion
4H-Daily: Best for swing trading and breakout identification
Weekly: Useful for position trading and major level identification
Limitations
ATR-based bands lag during sudden volatility spikes
Mean-reversion signals can fail in strong trends
Breakout signals may whipsaw in ranging markets
Works best on liquid instruments with consistent volatility patterns
Open-Source and Disclaimer
This script is published as open-source under the Mozilla Public License 2.0 for educational purposes. The source code is fully visible and can be studied to understand how each component works.
This indicator does not constitute financial advice. Band touches do not guarantee reversals. Past performance does not guarantee future results. Always use proper risk management, position sizing, and stop-losses.
- Made with passion by officialjackofalltrades

Multi-indicator Signal Builder [Skyrexio]Overview
Multi-Indicator Signal Builder is a versatile, all-in-one script designed to streamline your trading workflow by combining multiple popular technical indicators under a single roof.
It features a single-entry, single-exit logic, intrabar stop-loss/take-profit handling, an optional time filter, a visually accessible condition table, and a built-in statistics label.
Traders can choose any combination of 12+ indicators (RSI, Ultimate Oscillator, Bollinger %B, Moving Averages, ADX, Stochastic, MACD, PSAR, MFI, CCI, Heikin Ashi, and a “TV Screener” placeholder) to form entry or exit conditions.
This script aims to simplify strategy creation and analysis , making it a powerful toolkit for technical traders.
Indicators Overview
RSI (Relative Strength Index)
Measures recent price changes to evaluate overbought or oversold conditions on a 0–100 scale.
Ultimate Oscillator (UO)
Uses weighted averages of three different timeframes, aiming to confirm price momentum while avoiding false divergences.
Bollinger %B
Expresses price relative to Bollinger Bands, indicating whether price is near the upper band (overbought) or lower band (oversold).
Moving Average (MA)
Smooths price data over a specified period. The script supports both SMA and EMA to help identify trend direction and potential crossovers.
ADX (Average Directional Index)
Gauges the strength of a trend (0–100). Higher ADX signals stronger momentum, while lower ADX indicates a weaker trend.
Stochastic
Compares a closing price to a price range over a given period to identify momentum shifts and potential reversals.
MACD (Moving Average Convergence/Divergence)
Tracks the difference between two EMAs plus a signal line, commonly used to spot momentum flips through crossovers.
PSAR (Parabolic SAR)
Plots a trailing stop-and-reverse dot that moves with the trend. Often used to signal potential reversals when price crosses PSAR.
MFI (Money Flow Index)
Similar to RSI but incorporates volume data. A reading above 80 can suggest overbought conditions, while below 20 may indicate oversold.
CCI (Commodity Channel Index)
Identifies cyclical trends or overbought/oversold levels by comparing current price to an average price over a set timeframe.
Heikin Ashi
A type of candlestick charting that filters out market noise. The script uses a streak-based approach (multiple consecutive bullish or bearish bars) to gauge mini-trends.
TV Screener
A placeholder condition designed to integrate external buy/sell logic (like a TradingView “Buy” or “Sell” rating). Users can override or reference external signals if desired.
Unique Features
Multi-Indicator Entry and Exit
You can selectively enable any subset of 12+ classic indicators, each with customizable parameters and conditions. A position opens only if all enabled entry conditions are met, and it closes only when all enabled exit conditions are satisfied, helping reduce false triggers.
Single-Entry / Single-Exit with Intrabar SL/TP
The script supports a single position at a time. Once a position is open, it monitors intrabar to see if the price hits your stop-loss or take-profit levels before the bar closes, making results more realistic for fast-moving markets.
Time Window Filter
Users may specify a start/end date range during which trades are allowed, making it convenient to focus on specific market cycles for backtesting or live trading.
Condition Table and Statistics
A table at the bottom of the chart lists all active entry/exit indicators. Upon each closed trade, an integrated statistics label displays net profit, total trades, win/loss count, average and median PnL, etc.
Seamless Alerts and Automation
• Configure alerts in TradingView using “Any alert() function call.”
• The script sends JSON alert messages you can route to your own webhook.
• The indicator can be integrated with Skyrexio alert bots to automate execution on major cryptocurrency exchanges.
Optional MA/PSAR Plots
For added visual clarity, optionally plot the chosen moving averages or PSAR on the chart to confirm signals without stacking multiple indicators.
Methodology
Multi-Indicator Entry Logic
When multiple entry indicators are enabled (e.g., RSI + Stochastic + MACD), the script requires all signals to align before generating an entry. Each indicator can be set for crossovers, crossunders, thresholds (above/below), etc. This “AND” logic aims to filter out low-confidence triggers.
Single-Entry Intrabar SL/TP
• One Position At a Time: Once an entry signal triggers, a trade opens at the bar’s close.
• Intrabar Checks: Stop-loss and take-profit levels (if enabled) are monitored on every tick. If either is reached, the position closes immediately, without waiting for the bar to end.
Exit Logic
All Conditions Must Agree: If the trade is still open (SL/TP not triggered), then all enabled exit indicators must confirm a closure before the script exits on the bar’s close.
Time Filter
Optional Trading Window: You can activate a date/time range to constrain entries and exits strictly to that interval.
Justification of Methodology
Indicator Confluence: Combining multiple tools (RSI, MACD, etc.) can reduce noise and false signals.
Intrabar SL/TP: Capturing real-time spikes or dips provides a more precise reflection of typical live trading scenarios.
Single-Entry Model: Straightforward for both manual and automated tracking (especially important in bridging to bots).
Custom Date Range: Helps refine backtesting for specific market conditions or to avoid known irregular data periods.
How to Use
Add the Script to Your Chart
• In TradingView, open Indicators , search for “Multi-indicator Signal Builder” .
• Click to add it to your chart.
Configure Inputs
• Time Filter: Set a start and end date for trades.
• Alerts Messages: Input any JSON or text payload needed by your external service or bot.
• Entry Conditions: Enable and configure any indicators (e.g., RSI, MACD) for a confluence-based entry.
• Close Conditions: Enable exit indicators, along with optional SL (negative %) and TP (positive %) levels.
Set Up Alerts
• In TradingView, select “Create Alert” → Condition = “Any alert() function call” → choose this script.
• Entry Alert: Triggers on the script’s entry signal.
• Close Alert: Triggers on the script’s close signal (or if SL/TP is hit).
• Skyrexio Alert Bots: You can route these alerts via webhook to Skyrexio alert bots to automate order execution on major crypto exchanges (or any other supported broker).
Visual Reference
• A condition table at the bottom summarizes active signals.
• Statistics Label updates automatically as trades are closed, showing PnL stats and distribution metrics.
Backtesting Guidelines
Symbol/Timeframe: Works on multiple assets and timeframes; always do thorough testing.
Realistic Costs: Adjust commissions and potential slippage to match typical exchange conditions.
Risk Management: If using the built-in stop-loss/take-profit, set percentages that reflect your personal risk tolerance.
Longer Test Horizons: Verify performance across diverse market cycles to gauge reliability.
Example of statistic calculation
Test Period: 2023-01-01 to 2025-12-31
Initial Capital: $1,000
Commission: 0.1%, Slippage ~5 ticks
Trade Count: 680 (varies by strategy conditions)
Win rate: 75.44% (varies by strategy conditions)
Net Profit: +90.14% (varies by strategy conditions)
Disclaimer
This indicator is provided strictly for informational and educational purposes.
It does not constitute financial or trading advice.
Past performance never guarantees future results.
Always test thoroughly in demo environments before using real capital.
Enjoy exploring the Multi-Indicator Signal Builder! Experiment with different indicator combinations and adjust parameters to align with your trading preferences, whether you trade manually or link your alerts to external automation services. Happy trading and stay safe!

Momentum Trend & Ignition DashboardDescription
Rationale & Originality Traders often struggle with chart clutter, needing separate indicators for Moving Averages, Volume anomalies, and Fundamental stats (like 52-week highs or Float). This script solves this problem by creating a unified "Momentum Dashboard." It is not just a collection of averages; it is a purpose-built tool for Breakout and Trend Following strategies (such as CAN SLIM or VCP).
The uniqueness of this script lies in its "Confluence Logic": it allows a trader to instantly validate a setup by checking three pillars simultaneously without changing tabs:
Trend: Are the key MAs (20, 50, 100, 200) stacked correctly?
Ignition: Is there a "Power Play" (Big Price Move + Heavy Volume) occurring right now?
Stats: Is the stock near its 52-week high, and does it have a supportive Up/Down Volume Ratio?
How It Works (Detailed Calculations)
1. Custom Trend Ribbon (4x MA Mix):
The script plots 4 independent Moving Averages.
Innovation: Unlike standard inputs, each MA can be individually toggled between SMA (Simple) or EMA (Exponential). This allows traders to mix "Fast" trend lines (e.g., 10 or 20 EMA) with "Slow" institutional lines (e.g., 50 or 200 SMA) in one overlay.
2. "Purple Dot" Ignition Detection:
This features a custom detection algorithm for "Ignition Bars."
Logic: It compares the current candle's Close to the previous Close. If the move exceeds a user-defined threshold (default 5%) AND the Volume exceeds a fixed liquidity threshold (default 500k), a Purple Dot is plotted.
This filters out "low volume drift" and highlights true institutional participation.
3. Relative Volume (RVol) Engine:
Calculates the ratio of Current Volume to the 50-period SMA of Volume.
Visuals: If the ratio exceeds the user threshold (e.g., 1.5x average), the dashboard highlights the data, and optionally the chart bars, alerting the trader to unusual activity.
4. Statistical Dashboard (Data Panel):
Using request.security, the panel fetches daily timeframe data regardless of the chart view.
52-Week & 13-Week H/L: Calculates the percentage distance from these key levels to gauge overhead supply.
U/D Ratio: Calculates the sum of volume on "Up Days" vs. "Down Days" over 50 periods. A value > 1.0 suggests institutional accumulation.
Float %: (Stocks Only) Fetches financial data to show the percentage of shares available for trading.
How to Use This Script
This script is designed for Trend Following and Breakout Trading:
The Setup: Use the Data Panel to find stocks with a U/D Ratio > 1.0 and price within 15% of the 52-Week High.
The Trend: Ensure price is above the MA 2 (set to 50 SMA) and MA 4 (set to 200 SMA) to confirm a Stage 2 uptrend.
The Trigger: Watch for the Purple Dot.
If a Purple Dot appears as price breaks out of a consolidation (base), it confirms institutional buying.
Use the RVol panel to confirm that volume is at least 1.5x normal levels.
Risk Management: Use the MA 1 (set to 20 EMA) as a trailing stop-loss during strong trends.
Settings & Configuration
MAs: Fully adjustable Length and Type (SMA/EMA).
Big Move (Purple Dot): Adjust the % Move based on asset volatility (e.g., use 3% for Large Caps, 10% for Crypto).
Table: The data panel is fully dynamic. You can toggle specific rows (like Float or SMA distance) On/Off to save screen space, and position it anywhere on the chart.
Credits & References
The concept of Relative Volume (RVol) and U/D Ratio is derived from standard Volume Analysis used by William O'Neil.
The "Big Move" combined with Volume thresholds is based on standard Volume Spread Analysis (VSA) concepts regarding "Effort vs. Result."
Financial data fetch (Float) utilizes TradingView's built-in financial() library.

Ichimoku With GradingDescription:
This indicator is an enhanced version of the classic Ichimoku Kinko Hyo, designed to provide traders with an objective, quantitative assessment of trend strength. By breaking down the complex Ichimoku system into specific conditions, this script calculates a "Total Score" to help visualize the confluence of bullish or bearish signals.
How It Works
The core of this script is a 7-Point Grading System. Instead of relying on a single crossover, the script evaluates 7 distinct Ichimoku conditions simultaneously.
The Grading Criteria:
Tenkan > Kijun: Checks for the classic TK Cross (1 point if Bullish, -1 if Bearish).
Price vs TK/KJ: Checks if the Close is above both the Tenkan and Kijun (Bullish) or below both (Bearish).
Future Cloud: Analyzes the Kumo (Cloud) projected 26 bars ahead. If Senkou Span A > Senkou Span B, it is bullish.
Chikou Span: The Lagging Span validation. It compares the current Close to the Highs, Lows, and Cloud levels of 26 bars ago to ensure there are no obstacles.
Close > Tenkan: Checks immediate short-term momentum.
Close > Current Senkou Span A: Checks if price is above the current cloud's Span A.
Close > Current Senkou Span B: Checks if price is above the current cloud's Span B.
Total Score & Signals:
Maximum Score (+7): When all 7 conditions are met, a Green Triangle is plotted above the bar, indicating a strong trend confluence.
Minimum Score (-7): When all 7 conditions are negative, a Red Triangle is plotted below the bar.
Neutral/Mixed: Scores between -6 and +6 indicate a mixed trend or consolidation phase.
Dashboard Features
A table is displayed in the top-right corner to provide real-time data:
Score Breakdown: Shows the status of every individual metric (1 or -1).
Total Score: The sum of all metrics.
Distance to Tenkan %: This calculates the percentage distance between the Close and the Tenkan-sen.
Usage: Traders often use the Tenkan-sen as a trailing stop-loss level. This percentage helps gauge how extended the price is from the mean; a high percentage may indicate an overextended move, while a low percentage indicates a tight consolidation.
How to Use Ichimoku Lines
Beyond the grading system, this indicator plots the standard Ichimoku lines, which are powerful tools for price action analysis:
Support & Resistance: The Tenkan-sen (Conversion Line) and Kijun-sen (Base Line) act as dynamic support and resistance levels. In a strong trend, price will often respect the Tenkan-sen. In a moderate trend, it may pull back to the Kijun-sen before continuing.
The Kumo (Cloud): The edges of the current cloud (Senkou Span A and B) act as major support and resistance zones. A thick cloud represents strong S/R, while a thin cloud is easily broken.
Trend Identification: Generally, if the price is above the Cloud, the trend is bullish. If below, it is bearish. If the price is inside the Cloud, the market is considered to be in a noise/ranging zone.
Screenshots
1. Bitcoin Daily View:
Here you can see the dashboard in action. The grading system helps filter out noise by requiring all conditions to align before generating a signal.
2. Gold (XAUUSD) Example:
An example of a bearish confluence where the score hit -7, triggering a sell signal as the price broke through all Ichimoku support levels.
3. Euro (EURUSD) Mixed State:
This example shows a market in transition. While some metrics are positive (Green), others are negative (Red), resulting in a score of 4. This prevents premature entries during choppy market conditions.
Settings
Lengths: All Ichimoku periods (Tenkan, Kijun, Senkou B, Displacement) are fully customizable in the settings menu to fit your preferred timeframe or trading style (e.g., Doubled settings for crypto).
Disclaimer: This tool is for educational and informational purposes only. Past performance does not guarantee future results. Always manage your risk.

40 SMA Scaling StrategyThis trend-following strategy focuses on capturing momentum when price breaks above the 40-period Simple Moving Average (SMA) while utilizing a systematic scale-out (Take Profit) approach to lock in gains during extended runs.
Strategy Logic
Entry: Opens a Long position with 100% of current equity when the price closes above the 40 SMA. This ensures maximum capital efficiency at the start of a new perceived trend.
Scaling Take Profits: To reduce risk as the trade progresses, the strategy automatically closes 25% of the initial position for every 1% increase in price from the entry point.
Exit: The entire remaining position is closed immediately if the price closes below the 40 SMA, acting as a trailing stop that adapts to the moving average.
Key Features
Capital-Efficient: Starts with a full account allocation to maximize exposure to the initial breakout.
Systematic De-risking: By scaling out in 25% increments, the strategy banks profits early while leaving a portion of the trade active for potential "moon shots."
Trend-Following Exit: Uses a classic SMA filter to exit, aiming to stay in the trade as long as the medium-term trend remains bullish.

London Session + EMA 200 + UT BotCombined trading indicator featuring three powerful tools:🔵 London Session Box - Highlights the London trading session (0700-1600) with a customizable colored box to identify high-volume trading periods📈 EMA 200 - Exponential Moving Average for trend identification and dynamic support/resistance levels🎯 UT Bot - ATR-based trailing stop indicator with buy/sell signals and bar coloring for trend following

Session & ATR Trailing Stop mindedgean indicator that highlights the asian range where i look for the 15m fractal to be swept and then i trade in the opposite direction

Proactive Execution MachineProactive Execution Machine: Multi-State Momentum Engine
Overview
The Proactive Execution Machine is a comprehensive trading workspace designed to filter market noise and highlight high-probability execution windows. It combines Dynamic Supply/Demand Zones, Manual Level Proximity, and a proprietary Dual-Candle Momentum Scoring system to categorize the market into specific "States" in real-time.
Instead of a simple arrow, this script provides a System Status dashboard that tells you exactly what phase the market is in—whether it's "Level Absorption," a "Demand Vortex," or a "Tired Trend. "Core Components
1. The Momentum Gauge (Bottom Left)
This table provides a deep-dive into order flow by scoring the last two candles based on:
Close Location: Where price closed relative to its range (Upper, Middle, Lower).
Body-to-Wick Ratio: Measuring the "effort vs. result" of the move.
Range Relativity: Whether the current bar is an "Inside" or "Outside" bar relative to the previous candle.
Slope (Linear Regression): A real-time trendline of momentum strength to see if conviction is accelerating or decelerating.
2. Dynamic State Engine The script automatically identifies and colors the chart into three primary zones:
Supply Zone (Red): The upper 30% of the recent price discovery range.
Demand Zone (Green): The lower 30% of the recent price discovery range.
Proximity Zones: When price nears your Manual Levels (PDH, PDL, NY Open, etc.), the engine switches priority to monitor for "Breakouts" or "Level Attacks."
3. System Status (Bottom Right)The dynamic HUD changes size and color based on conviction levels. It will notify you of specific market conditions:
Supply/Demand Overrun: When momentum is so strong it is smashing through reversal zones. Level Absorption/Stalling: When price reaches a key level but momentum has "flattened," suggesting a potential reversal or high-volume churn.
Buy/Sell Now: High-conviction signals triggered only when Location (Zone) and Momentum (Score) align.
How to Trade with the "Machine"
For Trend Followers: Look for the status "TREND (ACTIVE)" combined with a Momentum Score of $\pm 4$ or higher.
For Reversion Traders: Watch for "WATCH LONGS/SHORTS" when price enters a Supply or Demand zone. Wait for the status to flip to "BUY/SELL NOW" as momentum begins to shift back toward the mean.
For Level Traders: Input your daily levels (VAH, VAL, POC) in the settings. The machine will automatically prioritize these levels, changing status to "AT LEVEL" the moment price enters your specified proximity.
Key Settings
Manual Levels: Input up to 5 custom price levels for the proximity engine.
Proximity Sensitivity: Adjust how close price must be to a level (in points/pips) to trigger an "At Level" state.
Aggression (1-5): Tuning the pivot detection. Lower numbers respond faster to micro-structure; higher numbers focus on major swing points.
Visual Coding
Candle bodies are colored to assist with single candle pattern detection:
Lime/Pink Bar Highlights: The script uses a custom color engine to highlight "Shaved" (Marubozu) bars.
Lime indicates aggressive bullish conviction, while Pink (Fuchsia) highlights aggressive bearish conviction.
Green indicates bull engulfing candle
Red indicates bear engulfing candle
Orange is an outside bar
Yellow an inside bar
Gray a Doji bar
Black all other bars
Dynamic Zones: The chart features two primary background areas:
Red Zone (Top): The Supply Zone, identifying where sellers historically reclaim control.
Green Zone (Bottom): The Demand Zone, identifying where buyers historically step in.
System Status HUD (Bottom Right): This is the "brain" of the machine. The text size is adjusted to attract the trader's attention when the slope of the momentum increases above 5 (bullish expansion) or greater than - 5 (Bearish expansion). The system status changes color based on the market state too:
HUD Coloring:
Aqua: Active Bullish Trend.
Gray: Bull trend tired.
Orange: Active Bearish Trend.
Gray: Bear trend tired.
Red: For sell now.
Green: For buy now.
Lime: Bull price level under attack.
Marron: Bear price level under attack.
Gray: Price level absorption.
Yellow: Price at level and stalling.
Maroon: An "Overrun" or "Vortex" where price is smashing through supply/demand with extreme momentum.
The text size serves as a "Volatility Alarm." * When the text is Small, the market is in a "sideways" or "absorbing" state. You should be cautious about entering new trend trades.
When the text is Large, the Machine has detected that "Aggressive" participants have entered the order flow. This is your cue that a "Level Attack" or a "Trend Breakout" is currently in progress.
The 1-Minute Tactical Setup Guide:
Proactive Execution Machine Operating on the 1-minute (1m) timeframe requires a balance between speed and noise filtration. Because the Proactive Execution Machine uses a "State Engine" logic, it is uniquely suited for the high-velocity environment of the NY Open.
I follow these three tactical steps to optimize the chart for the 1m timeframe:
Step 1: Calibrate the "Proximity Sensitivity" On a 1m chart, a "Level" isn't a single price—it's a zone.
Adjustment: In the script settings, set your Proximity Sensitivity to a value that represents the average "noise" of your instrument.
For ES (S&P 500 Futures): 1.5 to 2.5 points.
For NQ (Nasdaq Futures): 5 to 10 points.
For Forex (EURUSD): 1 to 2 pips.
The Goal: You want the "AT LEVEL" status to trigger just as price is "sniffing" the level, giving you time to prepare your order before the touch.
Step 2: Watch the "History" Column in the Momentum Gauge
The bottom-left table is your most important tool for the 1m chart. It shows you the momentum of the last three bars ($T-0$, $T-1$, $T-2$).
Momentum Sequence: Look for a "Sequence of Three." If you see $T-2$ (Neutral), $T-1$ (Long), and $T-0$ (STR Long), you have a momentum explosion.
The Trap: If you see STR LONG followed immediately by a NEUTRAL bar while in a Supply Zone, the "Machine" will shift to "SUPPLY STALLING." This is your signal to tighten your trailing stop or take profit—it means the bulls are hitting a wall of sell orders.
Step 3: The "Level Attack" Execution
The script features a unique state called "LEVEL ATTACK." This is designed specifically for breakout/breakdown traders.
The Setup: Price is approaching a Manual Level (like the NY Open or PDH).
The Signal: If the status changes to "LEVEL ATTACK (BULL)," it means the momentum score is high ($>3$) and the slope is positive while within the proximity of the level.
The Action: This is a "Proactive" entry. Instead of waiting for the candle to close above the level, you are entering as the "Machine" detects institutional pressure "attacking" the level.
Daily Routine for the "Machine"
1) 09:25 AM: Input your 5 manual levels (PDH, PDL, NY Open, VAH, VAL).
2) 09:30 AM: Wait for the first 5 minutes of volatility to settle.
3) The Window: Look for the System Status to move from "IDLE" to a colored state.
4) The Trigger: Never take a signal if the Momentum Gauge is in the "Neutral" (Yellow) zone. Only execute when the gauge shows LONG/SHORT or STR LONG/STR SHORT.

CVD Zones & Divergence [Pro]# CVD Zones & Divergence
**Complete CVD order flow toolkit** - Divergences, POC, Profile, and Supply/Demand zones all in one professional indicator.
## 🎯 What It Does
Combines **four powerful order flow tools** into a single, cohesive indicator:
1. **CVD Divergences** - Early warnings + confirmed signals
2. **Point of Control (POC)** - Fair value equilibrium line
3. **CVD Profile** - Visual distribution histogram
4. **Supply/Demand Zones** - Real absorption-based S/R levels
All based on **Cumulative Volume Delta (CVD)** - actual buying/selling pressure, not approximations.
## ✨ Key Features
### 🔄 CVD Divergences (Dual Mode)
**Confirmed Divergences** (High Accuracy)
- Solid lines (customizable colors)
- 🔻 Bear / 🔺 Bull labels
- Win rate: ~70-80%
- Best for swing traders
**Early Warning Mode** ⚡ (Fast Signals)
- Dashed lines (default purple)
- ⚠️ Early Bear / ⚠️ Early Bull labels
- Fires 6+ bars earlier
- Win rate: ~55-65%
- Best for scalpers/day traders
### 🎯 Point of Control (POC)
- **Independent lookback** (300 bars default)
- Yellow line showing fair value
- Where most CVD activity occurred
- Acts as dynamic support/resistance
- Resets and recalculates continuously
### 📊 CVD Profile Histogram
- **Visual CVD distribution** over lookback period
- **Split buy/sell** (blue/orange bars)
- **Value Area** (70% CVD zone highlighted)
- Position: Right/Left/Current (your choice)
- Shows where actual order flow happened
### 📦 Supply/Demand Zones
- **Absorption-based** detection (not guesses!)
- Green = Demand (buyers absorbed 2:1+)
- Red = Supply (sellers absorbed 2:1+)
- Shows **real** institutional levels
- Auto-sorted by strength
- Displays top 8 zones
## 📊 What You See on Chart
```
Your Chart:
├─ 🔴 Red lines (bearish divergences)
├─ 🟢 Green lines (bullish divergences)
├─ 🟣 Purple dashed (early warnings)
├─ 🟡 Yellow POC line (fair value)
├─ 📊 Blue/Orange profile (right side)
├─ 🟢 Green boxes (demand zones)
└─ 🔴 Red boxes (supply zones)
```
## ⚙️ Recommended Settings
### 15m Day Trading (Most Popular)
```
📊 Profile:
- Lookback: 150 bars
- Profile Rows: 24
- Position: Right
🎯 POC:
- POC Lookback: 300 bars
- Show POC: ON
📦 Zones:
- Min Absorption Ratio: 2.0
- HVN Threshold: 1.5
- Max Zones: 8
🔄 Divergences:
- Pivot L/R: 9
- Early Warning: ON
- Early Right Bars: 3
- Min Bars Between: 40
- Min CVD Diff: 5%
```
### 5m Scalping
```
Profile Lookback: 100
POC Lookback: 200
Pivot L/R: 7
Early Warning Right: 2
Min Bars Between: 60
```
### 1H Swing Trading
```
Profile Lookback: 200
POC Lookback: 400-500
Pivot L/R: 12-14
Early Warning Right: 4-5
Min Bars Between: 30
Min CVD Diff: 8%
```
## 💡 How to Trade
### Setup 1: Divergence at Zone ⭐ (BEST - 75%+ win rate)
**Entry:**
- Price hits demand/supply zone
- Divergence appears (early or confirmed)
- Double confluence = high probability
**Example (Long):**
```
1. Price drops into green demand zone
2. ⚠️ Early bullish divergence fires
3. Enter long with tight stop below zone
4. Target: POC or next supply zone
```
**Risk/Reward:** 1:3 to 1:5
---
### Setup 2: POC Bounce/Rejection
**Entry:**
- Price approaches POC line
- Wait for reaction (bounce or rejection)
- Enter in direction of reaction
**Long Setup:**
```
1. Price pulls back to POC from above
2. POC acts as support
3. Bullish divergence appears (confirmation)
4. Enter long, stop below POC
```
**Short Setup:**
```
1. Price rallies to POC from below
2. POC acts as resistance
3. Bearish divergence appears
4. Enter short, stop above POC
```
**Risk/Reward:** 1:2 to 1:4
---
### Setup 3: Zone + Profile Confluence
**Entry:**
- Supply/demand zone aligns with thick profile bar
- Shows high CVD activity at that level
- Triple confluence = very high probability
**Example:**
```
1. Supply zone at 26,100
2. Profile shows heavy selling at 26,100
3. Price rallies to 26,100
4. Bearish divergence appears
5. Enter short
```
**Risk/Reward:** 1:4 to 1:6
---
### Setup 4: Early Warning Scalp ⚡
**Entry (Aggressive):**
- ⚠️ Early warning fires
- Price at zone or POC
- Enter immediately
- Tight stop (1-2 ATR)
**Management:**
```
- Take 50% profit at 1:1
- Move stop to breakeven
- 🔻 Confirmed signal → Trail stop
- Exit rest at target
```
**Risk/Reward:** 1:1.5 to 1:2
**Trades/day:** 3-8
---
### Setup 5: Multi-Timeframe (Advanced)
**Confirmation Required:**
```
Higher TF (1H):
- Confirmed divergence
- At major POC or zone
Lower TF (15m):
- Early warning triggers
- Entry with better timing
```
**Benefits:**
- HTF gives direction
- LTF gives entry
- Best of both worlds
**Risk/Reward:** 1:3 to 1:5
---
## 📊 Component Details
### CVD Profile
**What the colors mean:**
- **Blue bars** = Buying CVD (demand)
- **Orange bars** = Selling CVD (supply)
- **Lighter shade** = Value Area (70% CVD)
- **Thicker bar** = More volume at that price
**How to use:**
- Thick bars = Support/Resistance
- Profile shape shows market structure
- Balanced profile = range
- Skewed profile = trend
---
### Supply/Demand Zones
**How they're detected:**
1. High Volume Node (1.5x average)
2. CVD buy/sell ratio calculated
3. Ratio ≥ 2.0 → Zone created
4. Sorted by strength (top 8 shown)
**Zone labels show:**
- Type: "Demand" or "Supply"
- Ratio: "2.8:1" = strength
**Not like other indicators:**
- ❌ Other tools use price action alone
- ✅ This uses actual CVD absorption
- Shows WHERE limit orders defended levels
---
### Point of Control (POC)
**What it shows:**
- Price with highest CVD activity
- Market's "fair value"
- Dynamic S/R level
**How to use:**
- Price above POC = bullish bias
- Price below POC = bearish bias
- POC retest = trading opportunity
- POC cross = trend change signal
**Independent lookback:**
- Profile: 150 bars (short-term)
- POC: 300 bars (longer-term context)
- Gives stable, relevant POC
---
## 🔧 Settings Explained
### 📊 Profile Settings
**Lookback Bars** (150 default)
- How many bars for profile calculation
- Lower = more recent, reactive
- Higher = more historical, stable
**Profile Rows** (24 default)
- Granularity of distribution
- Lower = coarser (faster)
- Higher = finer detail (slower)
**Profile Position**
- Right: After current price
- Left: Before lookback period
- Current: At lookback start
**Value Area** (70% default)
- Highlights main CVD concentration
- 70% is standard
- Higher % = wider zone
---
### 🎯 POC Settings
**POC Lookback** (300 default)
- Independent from profile
- Longer = more stable POC
- Shorter = more reactive POC
**Show POC Line/Label**
- Toggle visibility
- Customize color/width
---
### 📦 Zone Settings
**Min Absorption Ratio** (2.0 default)
- Buy/Sell threshold for zones
- 2.0 = 2:1 ratio minimum
- Higher = fewer, stronger zones
**HVN Threshold** (1.5 default)
- Volume must be 1.5x average
- Higher = stricter filtering
- Lower = more zones
**Max Zones** (8 default)
- Limits display clutter
- Shows strongest N zones only
---
### 🔄 Divergence Settings
**Pivot Left/Right** (9/9 default)
- Bars to confirm pivot
- Higher = slower, more confirmed
- Lower = faster, less confirmed
**Early Warning**
- ON = Show early signals
- Early Right Bars (3 default)
- 3 = 6 bars faster than confirmed
**Filters:**
- Min Bars Between (40): Prevents spam
- Min CVD Diff % (5): Filters weak signals
**Visual:**
- Line styles: Solid/Dashed/Dotted
- Colors: Customize all 4 types
- Labels: Toggle ON/OFF
---
## 🎨 Color Customization
**Divergences:**
- Bullish Confirmed: Green (default)
- Bearish Confirmed: Red (default)
- Early Bullish: Purple (default)
- Early Bearish: Purple (default)
**Zones & Profile:**
- Bull/Demand: Green
- Bear/Supply: Red
- Buy CVD Profile: Blue
- Sell CVD Profile: Orange
- Value Area Up/Down: Lighter blue/orange
**POC:**
- POC Color: Yellow (default)
All customizable to your preference!
---
## 🔔 Alerts Available
**6 Alert Types:**
1. 🔻 Bearish Divergence (confirmed)
2. 🔺 Bullish Divergence (confirmed)
3. ⚠️ Early Bearish Warning
4. ⚠️ Early Bullish Warning
5. (Manual: POC cross)
6. (Manual: Zone touch)
**Setup:**
1. Click Alert (⏰)
2. Choose "CVD Zones & Divergence"
3. Select alert type
4. Configure notification
5. Create!
---
## 💎 Pro Tips
### From Experienced Traders:
**"Use zones with divergences for best setups"**
- Zone alone: 60% win rate
- Divergence alone: 65% win rate
- Both together: 75%+ win rate
**"POC is your friend"**
- Price tends to revert to POC
- Great target for counter-trend trades
- POC cross = potential trend change
**"Profile tells the story"**
- Thick bars = institutional levels
- Balanced profile = range-bound
- Skewed high = distribution (top)
- Skewed low = accumulation (bottom)
**"Early warnings for entries, confirmed for confidence"**
- Early = better entry price
- Confirmed = validation
- Use both in scale-in strategy
**"Filter by timeframe"**
- 1m-5m: Very fast, many signals
- 15m: Sweet spot for most traders
- 1H-4H: High quality, fewer signals
---
## 🔧 Tuning Guide
### Too Cluttered?
**Simplify:**
```
✅ Show Divergences: ON
✅ Show POC: ON
❌ Show Zones: OFF (or reduce to 4-5)
❌ Show Value Area: OFF
❌ Divergence Labels: OFF
→ Clean chart with just lines + POC
```
### Missing Opportunities?
**More Signals:**
```
↓ Pivot Right: 6-7
↓ Early Warning Right: 2
↓ Min Bars Between: 25-30
↓ Min CVD Diff: 2-3%
↓ Min Absorption Ratio: 1.8
```
### Too Many False Signals?
**Stricter Filters:**
```
↑ Pivot Right: 12-15
↑ Min Bars Between: 60
↑ Min CVD Diff: 8-10%
↑ Min Absorption Ratio: 2.5
↓ Max Zones: 4-5
```
### POC Not Making Sense?
**Adjust POC Lookback:**
```
If too high: Increase to 400-500
If too low: Increase to 400-500
If jumping around: Increase to 500+
→ Longer lookback = more stable POC
```
---
## ❓ FAQ
**Q: Difference from CVD Divergence (standalone)?**
A: This is the **complete package**:
- Divergence tool = divergences only
- This = divergences + POC + profile + zones
- Use divergence tool for clean charts
- Use this for full analysis
**Q: Too slow/laggy?**
A: Reduce computational load:
```
Profile Rows: 18 (from 24)
Lookback: 100 (from 150)
Max Zones: 5 (from 8)
```
**Q: No volume data error?**
A: Symbol has no volume
- Works: Futures, stocks, crypto
- Maybe: Forex (broker-dependent)
- Doesn't work: Some forex pairs
**Q: Can I use just some features?**
A: Absolutely! Toggle what you want:
```
Zones only: Turn off divergences + POC
POC only: Turn off zones + divergences
Divergences only: Turn off zones + POC + profile
Mix and match as needed!
```
**Q: Best timeframe?**
A:
- **1m-5m**: Scalping (busy, many signals)
- **15m**: Day trading ⭐ (recommended)
- **1H-4H**: Swing trading (quality signals)
- **Daily**: Position trading (very selective)
**Q: Works on crypto/forex/stocks?**
A:
- ✅ Futures: Excellent
- ✅ Stocks: Excellent
- ✅ Crypto: Very good (major pairs)
- ⚠️ Forex: Depends on broker volume
---
## 📈 Performance Expectations
### Realistic Win Rates
| Strategy | Win Rate | Avg R/R | Trades/Week |
|----------|----------|---------|-------------|
| Early warnings only | 55-65% | 1:1.5 | 15-30 |
| Confirmed only | 70-80% | 1:2 | 8-15 |
| Divergence + Zone | 75-85% | 1:3 | 5-12 |
| Full confluence (all 4) | 80-90% | 1:4+ | 3-8 |
**Keys to success:**
- Don't trade every signal
- Wait for confluence
- Proper risk management
- Trade what you see, not what you think
---
## 🚀 Quick Start
**New User (5 minutes):**
1. ✅ Add to 15m chart
2. ✅ Default settings work well
3. ✅ Watch for 1 week (don't trade yet!)
4. ✅ Note which setups work best
5. ✅ Backtest on 50+ signals
6. ✅ Start with small size
7. ✅ Scale up slowly
**First Trade Checklist:**
- Divergence + Zone/POC = confluence
- Clear S/R level nearby
- Risk/reward minimum 1:2
- Position size = 1% risk max
- Stop loss placed
- Target identified
- Journal entry ready
---
## 📊 What Makes This Special?
**Most indicators:**
- Use RSI/MACD divergences (lagging)
- Guess at S/R zones (subjective)
- Don't show actual order flow
**This indicator:**
- Uses real CVD (actual volume delta)
- Absorption-based zones (real orders)
- Profile shows distribution (real activity)
- POC shows equilibrium (real fair value)
- All from one data source (coherent)
**Result:**
- Everything aligns
- No conflicting signals
- True order flow analysis
- Professional-grade toolkit
---
## 🎯 Trading Philosophy
**Remember:**
- Indicator shows you WHERE to look
- YOU decide whether to trade
- Quality over quantity always
- Risk management is #1
- Patience beats aggression
**Best trades have:**
- ✅ Multiple confluences
- ✅ Clear risk/reward
- ✅ Obvious invalidation point
- ✅ Aligned with trend/context
**Worst trades have:**
- ❌ Single signal only
- ❌ Poor location (middle of nowhere)
- ❌ Unclear stop placement
- ❌ Counter to all context
---
## ⚠️ Risk Disclaimer
**Important:**
- Past performance ≠ future results
- All trading involves risk
- Only risk what you can afford to lose
- This is a tool, not financial advice
- Use proper position sizing
- Keep a trading journal
- Consider professional advice
**Your responsibility:**
- Which setups to trade
- Position size
- Entry/exit timing
- Risk management
- Emotional control
**Success = Tool + Strategy + Discipline + Risk Management**
---
## 📝 Version History
**v1.0** - Current Release
- CVD divergences (confirmed + early warning)
- Point of Control (independent lookback)
- CVD profile histogram
- Supply/demand absorption zones
- Value area visualization
- 6 alert types
- Full customization
---
## 💬 Community
**Questions?** Drop a comment below
**Success story?** Share with the community
**Feature request?** Let me know
**Bug report?** Provide details in comments
---
**Happy Trading! 🚀📊**
*Professional order flow analysis in one indicator.*
**Like this?** ⭐ Follow for more quality tools!

TradingView Alert Adapter for AlgoWayTRALADAL is a universal TradingView alert adapter designed for traders who work with indicators and want to test and automate indicator-based signals in a structured way.
It allows users to convert indicator outputs into a TradingView strategy and forward the same logic through alerts for multi-platform execution via AlgoWay.
This script can be used as TradingView indicator automation, enabling traders to build a TradingView strategy from indicators and route TradingView alerts through an AlgoWay connector TradingView workflow for multi-platform execution.
Why this adapter is needed
Most TradingView indicators are not available as strategies.
Traders often receive visual signals or alerts but have no access to objective statistics such as win rate, drawdown, or profit factor.
This adapter solves that problem by providing a generic framework that transforms indicator signals into a backtestable strategy — without modifying indicator code and without requiring Pine Script knowledge.
Input source–based design (including closed indicators)
All conditions in TRALADAL are built using input sources, which means you can connect:
Event-based signals (1 / non-zero values, arrows, shapes)
Indicator lines and values (EMA, VWAP, RSI, MACD, etc.)
Outputs from invite-only or closed-source indicators
If an indicator produces a visible signal or alert-compatible output, it can be evaluated and tested using this adapter, even when the source code is locked.
Three-level signal logic
The strategy uses a three-layer condition model commonly applied in discretionary and systematic trading:
Signal — primary entry trigger
Confirmation — directional validation
Filter — additional noise reduction
Each level can be enabled independently and combined using AND / OR logic, allowing traders to test multi-indicator systems without writing complex scripts.
Risk management and alert execution
The adapter supports practical risk parameters:
Stop Loss (pips)
Take Profit (pips)
Trailing Stop (pips)
Two execution modes are available:
Strategy Mode — risk rules are applied inside the TradingView Strategy Tester
Alert Mode — risk parameters are embedded into structured TradingView alerts and handled by AlgoWay during execution
Position sizing follows TradingView conventions (percent of equity, cash, or contracts) to keep strategy results and alerts aligned.
Typical use cases
This TradingView alert adapter is intended for:
Indicator-based trading systems
Backtesting signals from closed or invite-only scripts
Comparing multiple indicators within a single strategy
Sending TradingView alerts to external trading platforms via AlgoWay
The adapter does not generate signals or trading recommendations.
Its purpose is to provide a transparent and testable workflow from indicator signals to TradingView alerts and automated execution.

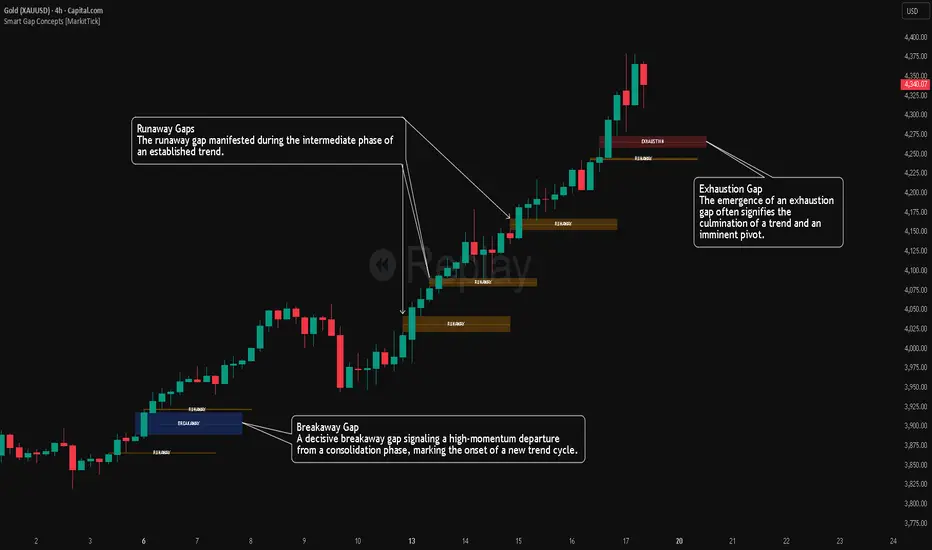
Smart Gap Concepts [MarkitTick]💡 This indicator automates the identification and classification of price gaps, commonly known as Fair Value Gaps (FVG) or Imbalances, by integrating market structure and volume analysis. Unlike standard gap detectors that simply highlight empty space on a chart, this script applies algorithmic filters to categorize gaps into three distinct phases of market movement: Breakaway, Runaway, and Exhaustion. This helps traders understand the potential context of a move rather than just seeing a support or resistance zone.
● Originality and Utility
The primary innovation of this tool is its dynamic classification system. It moves beyond visual detection by checking the "why" behind the gap. By referencing Swing Highs and Swing Lows (Market Structure) alongside Volume efficiency, it determines if a gap represents a breakout, a trend continuation, or a climatic end to a move. Additionally, the script features an automated mitigation tracking system that removes gaps from the chart once price has re-tested the midpoint, ensuring the visual workspace remains clean and relevant to current price action.
● Methodology
The script operates on a multi-stage logic engine:
• Gap Detection
It first identifies the core imbalance where the Low of the current bar does not overlap with the High of the bar two periods prior (for bullish gaps), ensuring the intervening candle represents a strong displacement.
• Structural Analysis (Breakaway Gaps)
The script monitors Pivot Highs and Lows. If a gap occurs simultaneously with a close beyond a key structural Pivot, it is classified as a "Breakaway Gap." This signals the potential start of a new trend.
• Volume and Time Analysis (Exhaustion Gaps)
To identify potential reversals, the script looks for "Trend Maturity." If a gap forms after a long duration since the last pivot and is accompanied by a volume spike (defined by the Volume Spike Multiplier), it is labeled as an "Exhaustion Gap."
• Continuation (Runaway Gaps)
If a gap is valid but meets neither the Breakaway nor Exhaustion criteria, it is considered a "Runaway Gap," typically found in the middle of an established trend.
• Dynamic Cleanup
The script tracks the midpoint of every active gap. If price creates a lower low (for bullish gaps) or higher high (for bearish gaps) beyond this midpoint, the gap is considered mitigated and is removed from the screen.
📖 How to Use
Traders can utilize the color-coded classifications to gauge market intent:
Breakaway (Default Blue): Watch these zones for potential trend initiations. These are often high-probability areas for a retest entry after a structure break.
Runaway (Default Orange): These indicate strong momentum. They can be used to trail stop-losses or add to winning positions, as price should ideally not close below these gaps in a healthy trend.
Exhaustion (Default Red): Be cautious when these appear. They suggest the current move is overextended and a reversal or complex pullback may be imminent.
• Exhaustion Gap : A Practical Case Study
• Breakaway Gap: A Practical Case Study
• Runaway Gap : A Practical Case Study
⚙️ Inputs and Settings
Min Gap Size (Points): Filters out insignificant gaps smaller than this threshold.
Structure Lookback: Defines the sensitivity of the Pivot detection (Swing High/Low).
Volume Avg Length & Multiplier: Determines what qualifies as a "Volume Spike" for exhaustion logic.
Trend Maturity: The minimum number of bars required to consider a trend "old" enough for an exhaustion signal.
Visual Settings: Custom colors for each gap type and box extension length.
● Disclaimer
All provided scripts and indicators are strictly for educational exploration and must not be interpreted as financial advice or a recommendation to execute trades. I expressly disclaim all liability for any financial losses or damages that may result, directly or indirectly, from the reliance on or application of these tools. Market participation carries inherent risk where past performance never guarantees future returns, leaving all investment decisions and due diligence solely at your own discretion.
Solid Dynamic Corridors[AkmanBey]
Solid Dynamic Corridors: Technical Overview
The Solid Dynamic Corridors indicator is a sophisticated, multi-layered trend-following and volatility-channel system. Unlike standard indicators, it combines RSI-derived price projections, ATR-based volatility expansion, and a 20-level support/resistance matrix to identify high-probability trend zones.
1. RSI-Based Price Projection
The foundation of the indicator starts with an inverse calculation of RSI levels. By setting specific overbought (51) and oversold (49) thresholds, the script projects these momentum levels directly onto the price chart as dynamic bands. This allows the trader to see where the price would be if it reached those specific RSI exhaustion points.
2. The Multi-Layered Support & Resistance Matrix
The core strength of the script lies in its 20-level calculation engine. It computes 10 distinct resistance levels (H1-H10) and 10 distinct support levels (L1-L10) using a hybrid blend of:
* Exponential Moving Averages (EMA)
* Average True Range (ATR)
* Historical Extremes (High/Low Lookbacks)
* Price Action Ratios
These levels are then averaged to create the Final Resistance and Support Averages, providing a "solid" boundary that filters out market noise more effectively than a single moving average.
3. Volatility-Adjusted Dynamic Expansion
To adapt to changing market conditions, the indicator employs an ATR-based expansion mechanism. By applying a user-defined multiplier to the current ATR, the bands expand during high-volatility periods and contract during consolidation, ensuring the "Corridors" remain relevant regardless of market speed.
4. Trend Tracking & Persistence Logic
The system features a unique Signal Persistence logic. When a trend shift is detected (via an ATR-based trailing stop mechanism):
* Buy/Sell Signals: Triggered when the price breaks through the calculated trailing limits.
* Persistence Lines: Once a signal is generated, the indicator "locks" the support or resistance level at that moment and tracks it for an extended period (up to 19,999 bars). This helps traders identify long-term historical anchor points even after the immediate trend has passed.
5. Extreme Range Analysis (HH-LL)
Finally, the script calculates Extreme Upper and Lower Bounds based on the highest and lowest points of the signal tracking lines. This creates a "Master Range" that colors the chart dynamically, signaling whether the market is in a Red (Overextended High), Green (Overextended Low), or Blue (Neutral) state.
Summary of Key Features
* Hybrid Momentum/Volatility Engine: Combines RSI and ATR logic.
* Noise Reduction: Averages 20 different data points to find "True" support and resistance.
* Long-Term Reference: Unique tracking system that remembers signal levels for thousands of bars.
* Visual Clarity: Intuitive color coding for trend direction and extreme price zones.

Capitulation Detector StrategyA multi-factor capitulation detector designed to identify exhaustion points in extended trends. It focuses on fading capitulation moves after multi-leg trends with extreme volume and price extension.
━━━━━━━━━━━━━━━━━━━━━━━━━━━━━━━━━━━━━━━━
THE CONCEPT
Capitulation occurs when the last holders give up — panic selling into lows or euphoric buying into highs. These moments create asymmetric opportunities because:
Sentiment becomes maximally skewed
Weak hands are flushed out
Price deviates far from equilibrium
The "fuel" for continuation is exhausted
━━━━━━━━━━━━━━━━━━━━━━━━━━━━━━━━━━━━━━━━
THE 6 FACTORS
Trend Persistence — Price stays on one side of 38 EMA for 12+ bars, confirming a sustained directional move
Acceleration — Price stays on one side of 5 EMA for 3+ bars, showing the move is accelerating into exhaustion
Volume Spike — Current bar volume ≥ 2x the 20-bar average
Body Expansion — Candle body ≥ 1.5x average, showing conviction/panic in the move
Extension — Price is 2+ ATR away from the 38 EMA, indicating overextension from equilibrium
Multi-Leg Structure — At least 3 consecutive lower lows (for longs) or higher highs (for shorts)
━━━━━━━━━━━━━━━━━━━━━━━━━━━━━━━━━━━━━━━━
SIGNAL LOGIC
Bullish Capitulation: 4+ factors align + price below 38 EMA + down candle + volume spike
Bearish Capitulation: 4+ factors align + price above 38 EMA + up candle + volume spike
The strategy enters counter-trend, fading the exhaustion move.
━━━━━━━━━━━━━━━━━━━━━━━━━━━━━━━━━━━━━━━━
EXIT OPTIONS
ATR-based stop loss (default: 2 ATR)
ATR-based take profit (default: 3 ATR)
Optional trailing stop
Time filter for session-specific trading
━━━━━━━━━━━━━━━━━━━━━━━━━━━━━━━━━━━━━━━━
BEST PRACTICES
Works best on liquid instruments with clean trends
More reliable after 3+ legs in the trend
Higher conviction when daily AND intraday timeframes align
"The bigger and more extended, the better"
Consider VWAP as additional confirmation (not coded here)
━━━━━━━━━━━━━━━━━━━━━━━━━━━━━━━━━━━━━━━━
SETTINGS GUIDE
Min Score: Increase for fewer, higher-quality signals
Volume Spike Multiplier: 2x; increase for stricter filter
Extension ATR: Higher values = more overextended setups only
Trend Bars Min: Higher values = longer established trends required
━━━━━━━━━━━━━━━━━━━━━━━━━━━━━━━━━━━━━━━━
ALERTS
Bullish Capitulation (potential long)
Bearish Capitulation (potential short)
━━━━━━━━━━━━━━━━━━━━━━━━━━━━━━━━━━━━━━━━
DISCLAIMER
This is a counter-trend strategy — inherently higher risk than trend-following. Always use proper position sizing and risk management. Backtest thoroughly on your specific instruments and timeframes.

ATR Stop Loss Finder (Strict Breakout Mode)Title: ATR Stop Loss Finder (Strict Breakout Mode)
Description:
Volatility-Based Risk Management: Generates dynamic trailing stop-loss lines for both Long (Lower Line) and Short (Upper Line) positions based on ATR volatility.
Strict Breakout Detection: Features a unique "Strict Breakout" logic that highlights trend acceleration. It visually marks whenever the Long SL breaks a historical high or the Short SL breaks a historical low over a user-defined lookback period (e.g., 50 bars).
Visual Signals: Automatically plots Red Circles for bullish SL breakouts (New Highs) and Blue Circles for bearish SL breakdowns (New Lows), making strong momentum shifts easy to spot.
Real-Time Dashboard: Includes an informative table displaying current ATR and SL price levels for quick reference.

Adaptive Volatility Stop by Pedro Paulo de MeloStop ATR is a clean and reliable volatility-based trailing stop system, built to adapt dynamically to market conditions using the Average True Range (ATR).
It identifies trend direction, adjusts the stop level using stair-step logic, and automatically flips the stop when price reversals occur.
How it works
Uses ATR × Multiplier to calculate an adaptive volatility buffer
Tracks trend direction internally
Recomputes and repositions the stop when a trend flip is detected
Plots separate lines for bullish and bearish stop states
Works on any market and timeframe (crypto, forex, commodities, indices, stocks)
Why it’s useful
This Stop ATR implementation is extremely stable and visually clean.
It is particularly effective for:
Trend following
Position management
Swing and position trading
Systematic stop placement
Unlike many ATR-based stop versions, this script uses a corrected flip-handling method that prevents stop misalignment and ensures consistent trend state tracking.
Inputs
Period — ATR length
Multiplier — ATR factor that defines stop distance
Author
Developed by Pedro Paulo de Melo, open-source version.
