[ProfitTrailer:Feeder] Up Down VolatilityUpside & DownSide Volatility is commonly used in the ProfitTrailer:Feeder community scene, so I decided to create a script for it. Please 'follow & like' if you like this script! ThanksChỉ báo Pine Script®của MEX-traders21
Bull vs Bear Power by DGTElder-Ray Bear and Bull Power Dr. Alexander Elder cleverly named his first indicator Elder-Ray because of its function, which is designed to see through the market like an X-ray machine. Developed in 1989, the Elder-Ray indicator can be applied to the chart of any security and helps traders determine the strength of competing groups of bulls and bears by gazing under the surface of the markets for data that may not immediately be ascertainable from a superficial glance at prices The Elder-Ray indicator is comprised by three elements – Bear Power, Bull Power and a 13-period Exponential Moving Average. As the high price of any candle shows the maximum power of buyers and the low price of any candle shows the maximum power of sellers, Elder uses the 13-period EMA in order to present the average consensus of price value. Bull power shows whether buyers are capable of pushing prices above the average consensus of value. Bear power shows whether sellers are capable of pushing prices below the average consensus of value. Mathematically, Bull power is the result of subtracting the 13-period EMA from the high price of the day, and Bear power is the result of subtracting the 13-period EMA from the low price of the day. What does this study implements Attempts to customize interpretation of Alexander Elder's Elder-Ray Indicator (Bull and Bear Power) by • adding additional insights to support/confirm Elder’s strategy with different indicators related with the Elder’s concept • providing different options of visualization of the indicator • providing smoothing capability Other Indicators to support/confirm Elder-Ray Indicator: Colored Directional Movement Index (CDMI) , a custom interpretation of J. Welles Wilder’s Directional Movement Index (DMI) , where : DMI is a collection of three separate indicators ( ADX , +DI , -DI ) combined into one and measures the trend’s strength as well as its direction CDMI is a custom interpretation of DMI which presents ( ADX , +DI , -DI ) with a color scale - representing the trend’s strength, color density - representing momentum/slope of the trend’s strength, and triangle up/down shapes - representing the trend’s direction. CDMI provides all the information in a single line with colored triangle shapes plotted on the top. DMI can provide quality information and even trading signals but it is not an easy indicator to master, whereus CDMI simplifies its usage. Alexander Elder considers the slope of the EMA, which gives insight into the recent trend whether is up or down, and CDMI adds additional insight of verifying/confirming the trend as well as its strength Note : educational content of how to read CDMI can be found in ideas section named as “Colored Directional Movement Index” different usages of CDMI can be observed with studies “Candlestick Patterns in Context by DGT", “Ichimoku Colored SuperTrend + Colored DMI by DGT”, “Colored Directional Movement and Bollinger Band's Cloud by DGT”, and “Technical Analyst by DGT” Price Convergence/Divergence , if we pay attention to mathematical formulations of bull power, bear power and price convergence/divergence (also can be expressed as price distance to its ma) we would clearly observe that price convergence/divergence is in fact the result of how the market performed based on the fact that we assume 13-period EMA is consensus of price value. Then, we may assume that the price convergence/divergence crosses of bull power, or bear power, or sum of bull and bear power could be considered as potential trading signals Additionally, price convergence/divergence visualizes the belief that prices high above the moving average or low below it are likely to be remedied in the future by a reverse price movement Alternatively, Least Squares Moving Average of Price Convergence/Divergence (also known as Linear Regression Curve) can be plotted instead of Price Convergence/Divergence which can be considered as a smoothed version of Price Convergence/Divergence Note : different usages of Price Convergence/Divergence can be observed with studies “Trading Psychology - Fear & Greed Index by DGT”, “Price Distance to its MA by DGT”, “P-MACD by DGT”, where “Price Distance to its MA by DGT” can also be considered as educational content which includes an article of a research carried on the topic Options of Visualization Bull and Bear Power plotted as two separate • histograms • lines • bands Sum of Bull and Bear Power plotted as single • histogram • line • band Others Price Convergence/Divergence displayed as Line CDMI is displayed as single colored line of triangle shapes, where triangle shapes displays direction of the trend (triangle up represents bull and triangle down represent bear), colors of CDMI displays the strength of the trend (green – strong bullish, red – strong bearish, gray – no trend, yellow – week trend) In general with this study, color densities also have a meaning and aims to displays if the value of the indicator is falling or growing, darker colors displays more intense move comparing to light one Note : band's upper and lower levels are calculated by using standard deviation build-in function with multiply factor of 0.236 Fibonacci’s ratio (just a number for our case, no any meaning) Smoothing No smoothing is applied by default but the capability is added in case Price Convergence/Divergence Line is assumed to be used as a signal line it will be worth smoothing the bear, bull or sum of bear and bull power indicators Interpreting Elder-Ray Indicator, according to Dr. Alexander Elder Bull Power should remain positive in normal circumstances, while Bear Power should remain negative in normal circumstances. In case the Bull Power indicator enters into negative territory, this implies that sellers have overcome buyers and control the market. In case the Bear Power indicator enters into positive territory, this indicates that buyers have overcome sellers and control the market. A trader should not go long at times when the Bear Power indicator is positive and he/she should not go short at times when the Bull Power indicator is negative. 13-period EMAs slope can be used in order to identify the direction of the major trend. According to Elder, the most reliable buy signals are generated, when there is a bullish divergence between the Bear Power indicator and the price (Bear Power forms higher lows, while the market forms lower lows). The most reliable sell signals are generated, when there is a bearish divergence between the Bull Power indicator and the price (Bull Power forms lower highs, while the market forms higher highs). There are four basic conditions, required to go long or short, with the use of the Elder-Ray method alone. In order to go long: 1. The market is in a bull trend, as indicated by the 13-period EMA 2. Bear Power is in negative territory, but increasing 3. The most recent Bull Power top is higher than its prior top 4. Bear Power is going up from a bullish divergence The last two conditions are optional that fine-tune the buying decision In order to go short: 1. The market is in a bear trend, as indicated by the 13-period EMA 2. Bull Power is in positive territory, but falling 3. The most recent Bear Power bottom is lower than its prior bottom 4. Bull Power is falling from a bearish divergence The last two conditions are optional, they provide a stronger signal for shorting but they are not absolutely essential If a trader is willing to add to his/her position, he/she needs to: 1. add to his/her long position, when the Bear Power falls below zero and then climbs back into positive territory 2. add to his/her short position, when the Bull Power increases above zero and then drops back into negative territory. note : terminology of the definitions used herein are as per TV dictionary Trading success is all about following your trading strategy and the indicators should fit within your trading strategy, and not to be traded upon solely Disclaimer : The script is for informational and educational purposes only. Use of the script does not constitute professional and/or financial advice. You alone have the sole responsibility of evaluating the script output and risks associated with the use of the script. In exchange for using the script, you agree not to hold dgtrd TradingView user liable for any possible claim for damages arising from any decision you make based on use of the script Chỉ báo Pine Script®của dgtrdCập nhật 6262 4.1 K
KINSKI Laguerre Filter WaveThe "Laguerre Filter Wave" Indicator usually shows market cycles and is a perfect fit for swing traders who trade with market fluctuations. Upward-trends are shown as green lines and optional bands. Downward trends are represented by the color red. Each of the 18 available lines can be adjusted to your own preferences via a gamma factor. You also have the following display options: - "Up/Down Movements: On/Off" - Shows ascending and descending of lines - "Bands: On/Off" - Fills the space between the lines with colors to indicate up or down trends - "Bands: Transparency" - sets the transparency of the fill color - "MA Line: Size" - sets the width of the lines - "MA Line: Transparency" - sets the transparency of the linesChỉ báo Pine Script®của KINSKICập nhật 77320
20 and 200 SMA indicators with unnecessary additionsAs many of you know, world famous Oliver Velez uses the simple 20 and 200 simple moving averages on 2 min time frame with price actions above or below these key SMAs for day/scalp trading involving narrow state versus wide state trend or anti-trend methods. The 20 SMA line uses different colors to indicate whether it is going up or down. Against Oliver's advice, I also unnecessarily added boll bands on the 200 SMA, two +/- percent lines off 200 SMA to measure how far away prices are from the 200 SMA. I also added 10 ema cross 20 SMA cross signal, MACD line up /down, RSI crossover RSI SMA for those are want to make things complicated or might find they helpful. You can turn off all these ideally to Keep It Simple. Again trading success is 80% psychology and 20% a good trading system plus risk management. Good luck.Chỉ báo Pine Script®của tomchen7355206
Sequential Filter - An Original Filtering ApproachRemoving irregular variations in the closing price remain a major task in technical analysis, indicators used to this end mostly include moving averages and other kind of low-pass filters. Understanding what kind of variations we want to remove is important, irregular (noisy) variations have mostly a short term period, fully removing them can be complicated if the filter is not properly selected, for example we might want to fully remove variations with a period of 2 bars and lower, if we select an arithmetic moving average the filter output might still contain such variations because of the ripples in the frequency response passband, all it would take is a variation of high amplitude for that variation to be clearly visible. Although all it would take for better filtering is a filter with better performance in the frequency domain (gaussian, Butterworth, Bessel...) we can design innovative approaches that does not rely on the model of classical moving averages, today a new technical indicator is proposed, the technical indicator fully remove variations lower than the selected period. The Indicator Approach In order for the indicator output to change the closing price need to produce length consecutive up's/down's, length control the variation threshold of the indicator, variations lower than length are fully removed. Lets see a visual example : Here length = 3, the closing price need to make 3 consecutive up's/down's, when the sequence happen the indicator output is equal to src , here the closing price, else the indicator is equal to its precedent value, hence removing other variations. The value of 3 is the value by default, this is because i have seen in the past that the average smallest variations period where in general of 3 bars. Because the indicator focus only on the variation sign, it totally ignore the amplitude of the movement, this provide an effective way to filter short term retracement in a fluctuation as show'n below : The candle option of the indicator allow the indicator to only focus on the body color of a candle, thus ignoring potential gaps, below is an example with the candle option off : If we activate the "candle" option we end up with : Note that the candle option is based on the closing and opening price, if you use the indicator on another indicator output make sure to have the candle option off. Length and Indicator Color The closing price is infected by noise, and will rarely make a large sequence of consecutive up's/down's, the indicator can therefore be useful to detect consecutive sequence of length period, here 6 is selected on BTCUSD : A consecutive up's/down's of period 6 can be considered a relatively rare event. It is important to note that the color of the indicator used by default has nothing to do with the consecutive sequence detected, that is the indicator turning red doesn't necessarily mean that a consecutive down's sequence has occurred, but only that this sequence has occurred at a lower value than the precedent detected sequence. This is show'n below : In order to make the indicator color based on the detected sequence check the "Color Based On Detected Sequence" option. Conclusion An original approach on filtering price variations has been proposed, i believe the indicator code is elegant as well as relatively efficient, and since high values of length can't really be used the indicator execution speed will remain relatively fast. Thanks for reading !Chỉ báo Pine Script®của alexgrover77429
Market Delta [Makit0]MARKET DELTA INDICATOR v0.5 beta Market Delta is suitable for daytrading on intraday timeframes, is a volume based indicator which allows to see the UP VOLUME vs the DOWN VOLUME, the DELTA (difference) and the CUMULATIVE DELTA (cumulative sum of difference) between them This indicator is based on contracts volume (data avaiable), not in ask/bid volume (data not avaiable) The up/down volume is calculated at each candle as follows: - calculate the ticks of the range, top wick and bottom wick - calculate the ticks up and ticks down to get the total ticks of the candle - calculate the volume per tick as total volume divided by total ticks - calculate the up and down volume as volume per tick multiplied by up ticks and down ticks The delta is calculated as volume up minus volume down The cumulative delta is a cumulative sum of delta and is resetted to 0 twice a day at the globex open and at the us cash open By default the indicator plots the 'CANDLE MODE' which is useful for charting the cumulative volume to find out support and resistance zones where the volume is rejected or pass thru, as the volume moves so does the price, price always follows the volume, price goes away from where volume dries and price auctions comfortable where is plenty of volume, in a way PRICE FEEDS ON VOLUME An indication about the plotting style in the volume, delta and cumulative delta modes: I can't use histogram as intended due a bug at autoresizing the scale in the candle mode, so the styles used are areabr and circles. FEATURES - Plot volume in one of four modes: Volume Up/Down, Delta, Cumulative Delta, Cumulative Delta as Candles - Cumulative delta resetted twice a day (globex and cash open) - Show a base line at 0 SETTINGS - Mode: select one of the four volume output modes: Volume, Delta, Cumulative Delta and Candles. Candles by default - Show zero line: show/hide the zero base line. False by default. HOW TO SETTING UP THE INDICATOR: BE AWARE, by default the indicator settings are configured for using the Cumulative Delta Candle Mode - Candles Mode Settings: configured by default, mode candles and zero line off - Volume, Delta, Cumulative Delta Mode Settings: select the mode you want and switch on/off the zero line GOOD LUCK AND HAPPY TRADINGChỉ báo Pine Script®của makit02323 1.7 K
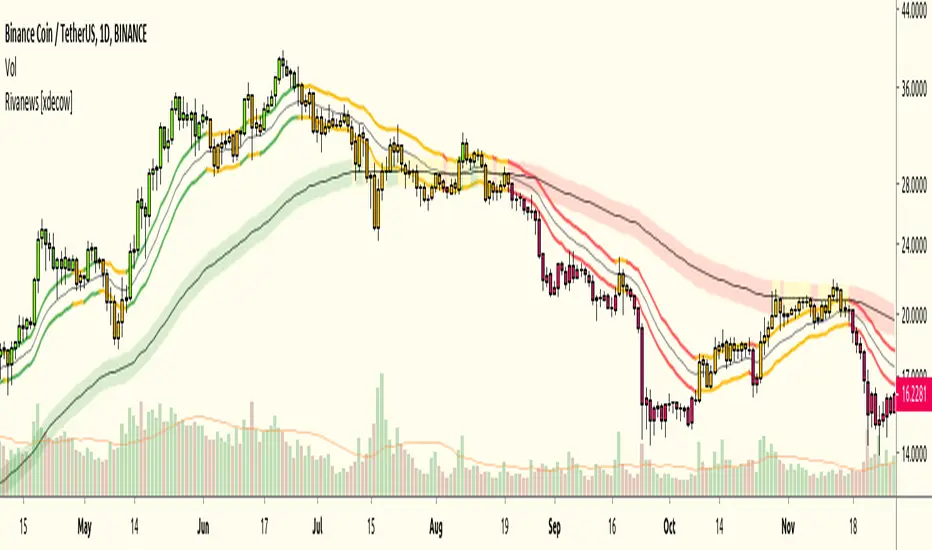
Rivanews Setup - Riva-Keltner, Média Rock [xdecow]This setup was created by Rivadavila S. Malheiros There are 2 Keltner Channels with exponential moving averages of 21 (riva) and 89 (rock) and ATR multiplier of 0.618. When the price is between the bands, it is a sign of consolidation (yellow). When the price is above the bands, it is an upward trend (green). When the price is below the bands, it is a downward trend (red). When the price crosses rock 89 and closes up / down, it may be a sign of a reversal. But it has a high probability of testing rock 89 again. ------------------------------------------------------------------------------------------ PT-BR Este setup foi criado por Rivadavila S. Malheiros São 2 Keltner Channels com médias móveis exponenciais de 21 (riva) e 89 (rock) e multiplicador do ATR de 0.618. Quando o preço está entre as bandas, é sinal de consolidação (amarelo). Quando o preço está acima das bandas, é uma tendencia de alta (verde). Quando o preço está abaixo das bandas, é uma tendencia de baixa (vermelho). Quando o preço cruza a rock 89 e fecha acima/abaixo, pode ser sinal de reversão. Mas tem uma alta probabilidade de testar a rock 89 novamente.Chỉ báo Pine Script®của xdecow88810
Multi-TF Avg BBandsMULTI-TF AVERAGE BBANDS - with signals (BETA) Overall, it shows where the price has support and resistance, when it's breaking through, and when its relatively low/high based on the magic of standard deviation. created by gamazama. send me a shout if u find this useful, or if you create something cool with it. %BB: The price's position in the boilinger band is converted to a range from 0-1. The midpoint is at 0.5 Description of parameters "BB:Window Length" is the standard BB size of 20 candles. The indicator plots up to 7 different %BB's on different timescales They are calculated independently of the timescale you are viewing eg 12h, 3d, 30m will be the same output You can enter 7 timescales, eg. if you want to plot a range of bbands of the 12h up to 3d graphs, enter values between 0.5 and 3 (days) - you can also select 0 to disable and use less timescales, or select hours or minutes Take note if you eg. double the main multiplier to 40, it is the same as doubling all your timescales You can turn the transparency of the 7 x %BB's to 100 to hide them, their average is plotted as a thick cyan line "Variance" is a measure of how much the 7 BB's agree, and changes colour based on the thresholds used for the strategy ---- TO START FROM SCRATCH ---- - set all except one to ZERO (0), set to 0, and everything after to 0. Turn ON and right click -> move the indicator to a new pane - this will show you the internal workings of the indicator. Then there is a few standard settings "Source Smoothing Amount" applies a basic small sma on the price. It should be turned down when viewing candles with less information, like 1D or more. Standard BBands use an SMA, there one uses a blend between VWMA or SMA Volume Weight settings, the same as SMA at 0, and the same as VWMA at 1 BB^2 is a bband drawn around the average %BB. Adjust the to change its window length The BB^2 changes color when price moves up or down Now its time to look at the parameters which affect the buy/sell signals turn on "show signal range" - you see some red lines buy and sell each have 4 settings min/max variance will affect the brigtness of the signal range range adjust will move the range up/down mix BB^2 blends between a straight line (0) and BB^2's top or bottom (1) a threshold of "variance" and "h/l points" is available to generate weaker signals. these thresholds can be increased to show more weak signals ONCE YOU ARE HAPPY WITH THE SIGNALS being generated, you can turn OFF , and move it back to the price pane the indicator then draws a bband around the price to maps some info into the chart: fills a colour between 0.5 & the mid BB^2 and converts relative to the price chart draws a line in the middle of the midband. controls how much these lines diverge from the price - adjust it to reduce noise converts the signal range (red lines) to be relative to the price chart if you like, you can adjust the sell & buy signals in the tab from and to and to match the picture. It messes with auto-scaling when moving back to though enjoy, I hope that is easy enough to understand, still trying to make this more user-friendly. If you want to send me some token of appreciation - btc: 33c2oiCW8Fnsy41Y8z2jAPzY8trnqr5cFu I promise it will put a fat smile on my face Chỉ báo Pine Script®của gamazama44714
Karobein OscillatorDeveloped by Emily Karobein, the Karobein oscillator is an oscillator that aim to rescale smoothed values with more reactivity in a range of (0,1) Calculation The scaling method is similar to the one used in a kalman filter for the kalman gain. We first average the up/downs x, those calculations are similar to the ones used for calculating the average gain/loss in the relative strength index. a = ema(src < src ? x : 0,length) b = ema(src > src ? x : 0,length) where src is a exponential moving average of length period and x is src/src in the standard calculations, but anything else can be used as long as x > 0 . Then we rescale the results. c = x/(x + b) d = 2*(x/(x + c*a)) - 1 How To Use It is better to use centerline-cross/breakouts/signal line. In general when we use something smooth as input in oscillators, breakouts are better than reversals, you can see this with the stochastic and rsi. So a simple approach could be buying when crossing over 0.8 and selling when crossing under 0.2. Here is the balance of a strategy using those conditions, length = 50 . 20 trades have been mades since the 29 oct we made 341 pips with eur/usd, of course this backtest was made during good trends period, this result is not representative of how the strategy work with other conditions/markets. For any questions/suggestions feel free to contact me Chỉ báo Pine Script®của alexgrover77204
Katana Gaps Bounty Hunter Pro (Show Gaps of All Types) by RRBKatana Gaps Bounty Hunter Pro (KGB Hunter Pro, Gap Exterminator) by RagingRocketBull 2018 Version 1.0 This indicator shows/counts/filters gaps on a chart. There are several versions: Simple, Pro, Advanced and Zones. This is the Pro version. The Differences are listed below. - Simple: shows/counts gaps, changes color based on gap dir (2 colors), filters out price gaps within session, large gaps, and high volume gaps - Pro: +shows all types of gaps, multi color, pro filters (full/partial/overlapping time, price, large, candle, volume, doji, weekend gaps within delta ranges) - Advanced: +session times mask, show/count gaps only for last N bars, +min/max/filled gaps stats, dark mode - Zones: +shows gaps as dynamic horiz zones KGB Hunter Pro Gap Exterminator focuses on showing you all possible types of gaps in multiple colors. Gap theory states that price tends to return and fill the gaps, so you can use it to collect the bounty. You can apply any combination of complex filters to narrow down search results i.e., find only all: - type 3 gaps up with allowed wick-candle overlapping of up to 10% and - gap size larger than 200 and - with at least one of the candles larger than 100 and - volume change at least 40 and - spanning less than 2 bar periods and - excluding weekend gaps Features: - highlights gaps using barcolor and plotchar chars (8 colors x 2 dirs) - supports all 3 types of gap overlapping: full gap (no overlapping), wick-wick and wick-body overlapping up to a specified % of candle body - finds all types of gaps with pro filters for price, time, large, volume, timerange, candle size, doji gaps - individual show/hide flags for each gap/char based on gap type - can show/hide gaps/chars based on gap dir - changes color of gaps/chars based on gap dir/type, multi color gap type combos - displays chars above/below bar based on gap dir - can show/hide weekend gaps - counts all filtered gaps Colors: Basically There are 2 gap types (Price, Time) x 2 directions (Up, Down) x 2 modifiers (Large, Volume), Volume Gap is a separate class with its own modifiers, so more accurately: - (Price, Time) x 2 directions (Up, Down) x Large modifier - (Price Volume, Time Volume) x 2 directions (Up, Down) x Large modifier using a total of 16+1 colors or 8+1 base colors + transparency modifier depending on settings you can highlight gaps using any multi color combo from just 1 to all 16 colors (+1 gray color for weekends). basic gap = 1 base color with normal transparency price,time = 2 base colors (including basic gap) with normal transparency (+1 color) * up,down dir = +2 new base colors with normal transparency (including 2 base colors), with a total of 2*2 = 4 price/time base colors (+2 colors) * large = same 4 base colors with vivid transparency modifier (+4 colors) * volume = +2 new base colors with normal transparency, a separate class (+2 colors) * volume * up,down dir = +another 2 new base colors with normal transparency (including 2 volume base colors), with a total of 2*2 = 4 volume base colors (+2 colors) * volume * large = 4 volume base colors with vivid transparency modifier (+4 colors) weekend_gap = gray (+1 color) doji gap, candle gap, timerange gap = no special color, inherits color from parent gap type for more details, please see the Gap Color Hierarchy comments in code _________________________________________________________________________ You can find the following gap related terminology in literature: full, partial, extreme, breakaway, runaway/continuation, common, exhaustion gaps. There are no exact rules to distinguish between them, so this can't be implemented. When defining a gap it all boils down to how do you plot a gap, which points between adjacent candles do you consider a gap. Different sources apply different methodology but in practice only 3 types of gap overlapping can exist: - full gap (no overlapping), - partial (wick-wick overlapping) and - extreme partial (wick-body overlapping up to a specified % of a candle body) All these types are supported in this script. The only possible remaining option is candle-candle overlapping which is not a gap by definition. Many other script specific subtypes are also supported. Please see description of each gap type below and comments in code. General display modes - gap has 3 possible overlapping modes: full gap (no overlapping), wick-wick overlapping, wick-candle overlapping up to a specified % of candle body size (for mode 3 only) the remaining candle-candle overlapping implies not a gap by definition full gap mode will find the least amount of gaps, wick-candle - the most - gap can be either price or time, up or down, and shown above or below the candles (gap chars) - by definition, a price gap is a smaller subset of a time gap, a gap within current session with a price gap and zero time lag between bars. Therefore timerange filter is useless for price gaps, but can still be applied. On the other hand, all price gap filters can be applied to time gaps without any distinction. - gap can have multiple modifier subtypes: (price|time) * (up|down) * (large? + volume? + doji? + timerange? + weekend?) i.e. price + large + volume + doji or time + large + volume + timerange + doji + weekend - the gap is always counted only once no matter how many subtype modifiers it has - if the gap does not satisfy any of the applied flags/filters it is not shown/counted (no gap bars/chars are shown) - gap color can depend on a combo of gap type/dir and modifier subtypes or can be shown in a single base color - char color can only depend on gap dir (not type/modifiers) or can be shown in a single base color - char position can also depend on gap dir (above/below) the gap candle. Alternatively you can pin chars to the top/bottom of the screen in UI Styles. - change_by_type = true - uses gap type base colors (2 colors + optional modifiers, up to 8 colors if volume and/or large filters are enabled) - change_by_dir = true - uses gap dir base colors (2 colors + optional modifiers, up to 8 colors if volume and/or large filters are enabled) - both change_by_type and change_by_dir = true - uses both gap type and dir base colors (4 colors + optional modifiers, up to 16 colors if volume and/or large filters are enabled) - both change_by_type and change_by_dir = false - uses a single base gap color (1 color) - don't need that much colors - disable filters - highlight bars has priority over individual gap flags, when it is false all gaps are hidden regardless of their corresponding flag settings (does not affect dim weekend gaps) - show chars has priority over individual gap char flags, when it is false all char flags are hidden regardless of their corresponding flag settings - price gaps are only shown/counted when show_price_gaps flag is true. The large or volume filters can be used to narrow down results further. - time gaps are only shown/counted when show_time_gaps flag is true. The large, volume, and timerange filters can be used to narrow down results further. - doji gaps are only shown/counted when show_doji_gaps flag is true. The doji candle size and other filters can be used to narrow down results further. - show weekend gaps = true and dim weekend gaps = false - shows/counts weekend gaps - show weekend gaps = true and dim weekend gaps = true - dims weekend gaps, doesn't show/count weekwend gaps - show/dim weekend gaps do just that - show the gap if it happens on a weekend, not all weekends - large gaps are only shown/counted when the large filter is enabled != 0. positive values 5 (>= 5), negative -5 (<=5) are used to switch between <> - volume gaps are only shown/counted when the volume filter is enabled != 0. positive values 5 (>= 5), negative -5 (<=5) are used to switch between <> - timerange gaps are only shown/counted when the timerange filter is enabled != 0. positive values 5 (>= 5), negative -5 (<=5) are used to switch between <> - candle size gaps are only shown/counted when the candle size filter is enabled != 0. positive values 5 (>= 5), negative -5 (<=5) are used to switch between <> - candle size filter is the only filter with 2 arguments, use_and_for_delta to enable AND condition for the args (OR is the default) Good Luck! Feel free to explore and learn from the code Chỉ báo Pine Script®của RagingRocketBull99198
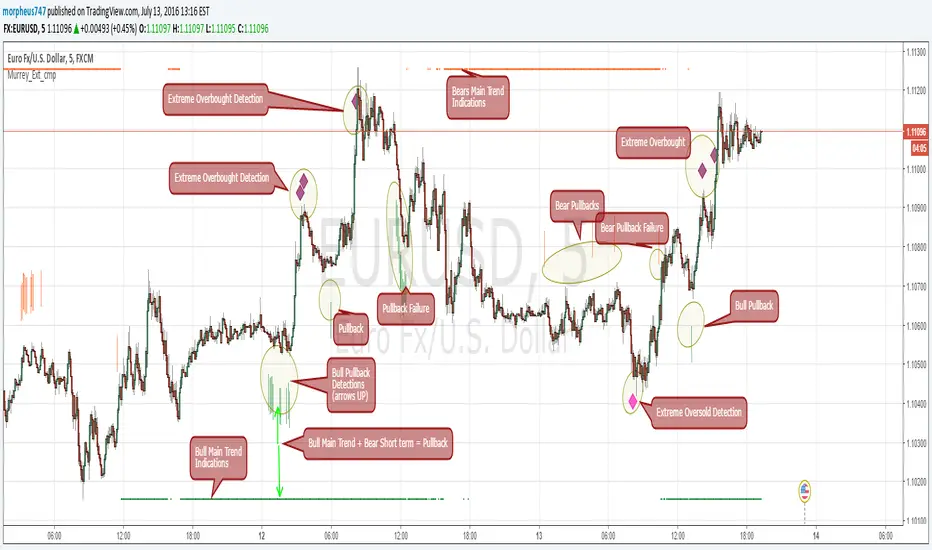
Murrey Math Extremes ComparatorHOW IT WORKS Creates two murrey math oscillators (hidden) one with 256 length another with 32 length and compare each other. WHAT GIVE ME THIS SCRIPT The script can give you very valuable information: - Main Trend - Pullbacks detections - Extreme overbought oversold prices alerts - Divergences - Any timeframe usage REFERENCES OF USAGE Main Trend Indications ****The main trend is indicated with green(bull) or red(bears) small "triangles" on the bottom(bull) or the top(bears) of the chart. *****To detect the Bull/Bear major trend the script use 256 murrey, if > 0 (green) we are uptrend in other cases we are downtrend Pullback detection ****The pullbacks are indicated with Green(bull) or red(bears) medium "Arrows" *****To detect pullbacks the system compare the long term murrey with the short term murrey, if long term is Green(green triangles) *****so we are in a main bull trend, if the short term murrey make an extreme low then the pullback is indicated *****The same for the short pullback, if long term murrey is RED and we have an extreme green short term murrey we shot a red arrow Extreme Overbught/Oversold ****The extreme OO is indicated with fancy diamonds *****To detect the Extremes price movements we combine the two murrey, if Long Term Murrey is overbought and short term murrey too *****Then the diamond show on the screen obove or below based on the extreme if overbought or oversold Strategy Resume: Triangles indicate Major Trend Up/Down Arrows Indicate Continuation pullbacks Diamonds Indicate Extreme Prices GUIDE HOW TO IMAGES How it's works Behind Scene Chỉ báo Pine Script®của morpheus74755942
Kay_BBandsV3This is the 3rd version of Kay_BBands. When +DI (Directional Index ) is above -DI , then Upper band will be visible and vice-versa. This is when the ADX is above the threshold. 28 is the default in this version. I found its more appealing in 5M time frame. BLUE - ADX under 10 GREEN - Uptrend, ADX over 10 RED - Downtrend, ADX over 10 Use it with another band with setting 20, 0.6 deviation. Prices keeping above or below the 2nd bands upper or lower bounds shows trending conditions. I didn't know how to update the old script so published it again. Changes - : 1) Updated default settings for the indicator 2) ADX setting are now DI (28), ADX (10), adx level to check is 10. 3) IMPORTANT one - When DI is up/down, lower/upper band will also have color (more visible that way.) Play around the settings.. It really eliminates extra indicator checking visually... Please like if you think idea is good.Chỉ báo Pine Script®của trading.kay2722204
CM ATR PercentileRankCM ATR PercentileRank - Great For Showing Market Bottoms. When Increased Volatility to the Downside Reaches Extreme Levels it’s Usually a Sign of a Market Bottom. This Indicator Takes the ATR and uses a different LookBack Period to calculate the Percentile Rank of ATR Which is a Great Way To Calculate Volatility Be Careful Of Using w/ Market Tops. Not As Reliable. ***Ability to Control ATR Period and set PercentileRank to Different Lookback Period ***Ability to Plot Histogram Just Showing Percentiles or Histogram Based on Up/Down Close Fuchsia Lines = Greater Than 90th Percentile of Volatility based on ATR and LookBack Period. Red Lines = Warning — 80-90th Percentile Orange Lines = 70-80th Percentile Other Useful Indicators Williams Vix Fix CM_RSI EMA Is a Great Filter for Williams Vix Fix Chỉ báo Pine Script®của ChrisMoody2727 2.4 K
Game Theory EMA with an alternate strategy Game Theory EMA Strategy – Trend-Following with Utility & Nash Filters This open-source strategy combines classic EMA crossover trend-following with simplified game-theory-inspired decision filters to improve entry quality and reduce whipsaws. Core Concept Traditional EMA strategies often suffer from false signals in ranging or low-conviction markets. This version adds lightweight game-theory proxies: - **Expected Utility** (EU): estimates relative strength of buyers vs sellers using RSI momentum, volume weighting, and trend bias - **Nash Equilibrium Proxy**: flags when buyer/seller forces are roughly balanced (low utility gap) → avoid trading in equilibrium (indecision/chop) - **Momentum Strength Ratio**: measures recent bullish vs bearish candle dominance These act as confirmation layers on top of EMA crossovers + trend filter + standard technical filters (ADX, volume, RSI), creating higher-confluence entries. Key Components & Logic 1. EMA Signals - Fast EMA (default 9) crosses above Slow EMA (21) → potential long - Fast crosses below Slow → potential short - Price must be above/below Trend EMA (50) for directional bias 2. Game Theory Filters (optional) - Buyer/Seller Expected Utility: combines RSI position, volume weight, trend direction - Utility Gap: absolute difference between buyer & seller EU → requires minimum gap (default 0.15) - Nash Equilibrium: low gap (<0.1) → market in balance → skip trade if filter enabled - Momentum Strength: ratio of bullish candles in lookback period 3. Additional Filters (toggleable) - ADX trend strength (medium or higher) - Volume surge (> SMA × multiplier) - RSI not in extreme zones (20–80) 4. Risk & Trade Management - ATR-based stop (default 1.2× ATR) - Fixed R:R target (default 1.5:1) - Max trades per day, max daily loss %, optional time filter - Multiple exit reasons: target hit, trend break (EMA slow), equilibrium, time-based Visuals & Dashboard - Fast (blue), Slow (red), Trend (orange) EMAs - Green/red background for up/down trend - Yellow background during Nash equilibrium (indecision zone) - Entry triangles + stop/target lines - Top-right info table showing: - Position, Trend, ADX strength - Buyer/Seller EU, Utility Gap, Nash status - Total trades & win rate - Trades today / daily limit Alerts - "GT Strategy: Long Signal" - "GT Strategy: Short Signal" - "GT Strategy: Nash Equilibrium" (warning) Realistic Backtesting & Usage Guidelines To publish non-misleading results: - Initial Capital: $10,000 – $50,000 (realistic retail/futures account) - Position sizing: 1–3% equity per trade (change default_qty_value from 95%!) - Commission: 0.03–0.1% per side or $4–$10 RT per contract (futures) - Slippage: 1–5 ticks (futures/indices) or 0.5–2 pips (forex) - Dataset: ≥12–36 months on chosen timeframe (aim for 300–800+ trades) - Risk per trade: 0.5–2% max — never exceed sustainable levels Expectations: - Best on trending instruments (NQ, ES, GC, XAUUSD, BTC, major forex) during active sessions - Fewer signals in choppy/low-volatility periods (Nash filter helps) - Drawdowns common during ranging markets — this is a trend-biased system, not reversal - News events can cause false entries — use time filter or manual discretion How to Use 1. Apply to high-liquidity symbols (NQ1!, ES1!, GC1!, XAUUSD, BTCUSD, EURUSD) 2. Timeframes: 5m–1h for day trading, 4h–daily for swing 3. Start with defaults: 9/21/50 EMAs, Nash & utility filters on, 1.5:1 R:R 4. Trade only when multiple filters align (EMA cross + utility edge + volume + trend) 5. Avoid major news or use wider stops 6. Forward-test on demo for 2–3 months minimum Publish Recommendation - Use a clean chart: only this strategy, no extra indicators/drawings - Show realistic Strategy Tester results with commission/slippage applied - Screenshot during trending period with visible EMA cross, entry, stop/target lines, and info table Educational tool — open-source for learning trend + decision-theory concepts. Not financial advice. Trading carries very high risk of loss — test thoroughly and trade responsibly. Feedback welcome — especially on utility calculation or filter combinations!Chiến lược Pine Script®của uzair2join1
0DTE Strategy0DTE Strategy - Quick Guide WHAT IT DOES: Automated indicator for 0DTE SPY options scalping. Shows exact trading windows, entry signals, and market conditions in real-time. SETUP: 1. Apply to SPY chart (use 30-second timeframe for entries) 2. Settings > " USI:TICK Settings" > change symbol if "USI:TICK" doesn't work (try: USI:TICK , TICK, or NYSE:TICK) 3. Adjust colors if needed for your chart background HOW TO USE: TRADING WINDOWS (Color-coded backgrounds): - 9:35-9:50 AM (GREEN) = Trade 1 - Morning Impulse - 10:00-10:20 AM (BLUE) = Trade 2 - Trend Confirmation - 11:00 AM-3:30 PM (RED) = DEATH ZONE - Stay Cash, No Trading - 3:45-4:00 PM (PURPLE) = MOC Window - Check imbalance data ENTRY SIGNALS: - BUY (green triangle) = Price > VWAP + 9EMA + USI:TICK > +600 during active window - SELL (red triangle) = Price < VWAP + 9EMA + USI:TICK < -600 during active window - Signals stay active until opposite signal appears (no spam) DASHBOARD (Top Right): - Gap = Shows if gapping up/down vs yesterday's close - Window = Current trading window status - USI:TICK = Live NYSE TICK value (green >600, red <-600) - 5-Min Trend = Higher timeframe trend direction - Signal State = Current active signal (BUY/SELL/NEUTRAL) KEY LEVELS (Horizontal lines at market open): - PMH (green) = Pre-market high - acts as resistance - PML (red) = Pre-market low - acts as support - PDC (gray) = Previous day close - gap reference STRATEGY: 1. Before 9:30: Watch gap direction and pre-market levels 2. 9:35-9:50: Wait for BUY/SELL signal in Trade 1 window 3. Entry: Take signal when all conditions align (VWAP + EMA + TICK) 4. Exit: Target +$50 or use 20% hard stop per document rules 5. 11:00-3:30: Stay cash (Death Zone) 6. 3:45-4:00: MOC window (check NYSE imbalance data separately) BEST PRACTICES: - Use on 30-second chart for precise entries - Check 5-minute chart to confirm trend alignment - Only trade during colored window backgrounds - Follow the 4-bullet risk management from original guide - Dashboard shows "HOLD CALLS" or "HOLD PUTS" when signal is active IMPORTANT: This is a signal tool, not a full trading system. You must still apply proper position sizing, risk management, and verify MOC imbalances externally.Chỉ báo Pine Script®của Kingsway139Cập nhật 3
Smart Dollar Volume for JP stocksHere are the professional descriptions you can copy-paste directly into the TradingView publish window. I have written them in the "Elite Advisor" style—clear, professional, and highlighting the edge these tools provide. Script 1: Smart Dollar Volume (Universal) Title: Smart Dollar Volume (Universal JPY/USD Auto-Convert) Description: Overview This is a universal liquidity analyzer designed for traders who operate across both US and Japanese markets. Standard volume indicators often provide misleading data when switching between currencies—showing "100M" for both a $100M US trade and a ¥100M ($660k) Japanese trade. This indicator solves that problem by normalizing all volume data into USD Terms, allowing for true "apples-to-apples" liquidity analysis. Key Features Auto-Currency Detection: Automatically detects if a stock is priced in JPY or USD. Live FX Conversion: If a Japanese stock (JPY) is detected, the script fetches the real-time USDJPY exchange rate and instantly converts the turnover into USD. Universal Thresholds: Allows you to use the same liquidity filters (e.g., "Trade only above $10M") for both Sony (7203) and Apple (AAPL) without doing mental math. Day Trading Mode: Includes a "Day Only" reset feature that calculates the average volume for the current session only, ignoring historical distortion. Smart Coloring: Bars are colored based on their relation to the average (Above/Below) and price action (Up/Down), with optional gap shading to highlight low-liquidity pockets.Chỉ báo Pine Script®của highstandart91
Target RadarTarget Radar filters entries with a confidence gate, then maps the next objective using pivot-cluster Support/Resistance pools. It’s built for traders who want fewer, cleaner signals and a clear target level instead of guessing exits. What you get on the chart 🔵 Support pools (pivot-low clusters) 🟠 Resistance pools (pivot-high clusters) 🟢 Long signal (▲) when the setup passes filters + score threshold 🔴 Short signal (▼) when the setup passes filters + score threshold Projection band (expected move with uncertainty half-width) Forward box (next-horizon projected zone) Target line + label (best nearby pool in the forecast direction + score) How to read the Support/Resistance pools Target Radar doesn’t draw random lines. It builds price pools from confirmed pivots and clusters them: A pivot forms after pivotLen bars confirm (that’s the confirmation delay by design). Levels within ATR * mergeATR merge into one pool. Strength = number of merged touches. Thickness/opacity = strength (stronger pools stand out). Legend 🔵 Blue = Support pools 🟠 Orange = Resistance pools Thick + less transparent = stronger level These colors are reserved for structure, not signal direction. What makes this different Most tools do signals or support/resistance or volatility bands. Target Radar combines them into a single workflow: Directional forecast (up/down pressure) Uncertainty gate (trade conditions vs noise) Structure-based target (where price is most likely to react next) So you’re not just taking entries—you’re trading entry + environment + destination. The math behind it (simple + transparent) 1) Forecast Engine (direction) Each component is normalized with a z-score over lookback: trendZ = zscore((EMA10 − EMA20) / EMA20) momZ = zscore(RSI14 − 50) volZ = zscore(ATR14 / close) (penalty) vprZ = zscore(log(SMA(upVol)/SMA(downVol))) Weighted blend: rawScore = wTrend*trendZ + wMom*momZ − wVol*volZ + wVpr*vprZ Bounded and scaled: bound(x) = x / (1 + |x|) forecastRet = bound(rawScore) * (ATR/close) * retScale 2) Uncertainty band (confidence gate) The script measures recent forecast error: realRet = ln(close / close ) residual = |realRet − forecastRet | Half-width uses rolling error stats: halfWidth = max(mean(residual) + zMult*stdev(residual), minHW) Interpretation: Small halfWidth = stable environment Large halfWidth = unstable environment (signals blocked if enabled) 3) Target scoring (structure + forecast alignment) The target is the nearest pool in the forecast direction, then scored by: distance fit vs the uncertainty band whether the level sits inside the projection zone pool strength bonus Best practices (how traders actually use it) New traders Start with Breakout or EMA Cross Keep filters ON: Require Forecast Alignment ✅ Block High Uncertainty ✅ Match Regime to Mode ✅ Use the dashed target as the first objective. Experienced traders Use Target Radar as a validation + targeting layer: Your setup triggers → Target Radar decides if conditions are tradable and where the next level sits. Raise minScore to reduce signals and tighten quality. Use the pool strength (thicker/clearer lines) as a structure filter. Mode ↔ Regime pairing TREND regime: Breakout, EMA Cross RANGE regime: Mean Reversion CHAOS regime: filtered out when regime gate is enabled What it is / what it isn’t It is: a confidence-gated signal filter + structure target mapper. It isn’t: a full strategy/backtest engine—use Strategy Tester if you want full trade simulation. Alerts Long signal Short signal High uncertaintyChỉ báo Pine Script®của Finntech137
Average True Range V2Here's an introduction and explanation for your ATR indicator script: Average True Range (ATR) with Enhanced Features This custom ATR indicator builds upon the traditional Average True Range calculation with several advanced visualization and analysis features designed for traders who need more precise market volatility insights. Overview The indicator calculates ATR using your choice of four smoothing methods (RMA, SMA, EMA, or WMA) and adds professional-grade tools for identifying extreme volatility levels over different time periods. Key Features Delayed Update Mode: Toggle the "Wait for period end before updating" option to prevent the ATR from recalculating until the current candle closes, eliminating false signals during active price action. Scale Inversion: The "Flip scale" feature inverts the ATR values, which can be useful when comparing volatility patterns with inversely correlated indicators or when creating custom overlay strategies. Dynamic Horizontal Line: A real-time horizontal line tracks the current ATR value across your chart, making it easier to identify when volatility reaches specific levels. Customize its color, style (solid, dashed, or dotted), and width to match your charting preferences. Extreme Value Markers: Automatically identifies and marks 3-day and 7-day volatility extremes with customizable shapes and colors. This helps you quickly spot: 3-day low/high volatility points (shorter-term extremes) 7-day low/high volatility points (medium-term extremes) Choose from seven different marker shapes (circle, triangle up/down, square, diamond, cross, or X cross) to distinguish between different extreme types at a glance. Practical Applications Use this indicator to identify optimal entry and exit points based on volatility cycles, set more accurate stop-loss levels during low volatility periods, or spot potential breakout opportunities when volatility reaches extreme lows before expanding. The extreme markers are particularly valuable for mean-reversion strategies, helping you identify when volatility has stretched to unsustainable levels and may return to normal ranges. Would you like me to adjust the tone to be more technical or conversational, or expand on any specific feature?Chỉ báo Pine Script®của Dooogiig2
Bernoulli Process: Trend Probability & Entropy [MarkitTick]💡 This technical indicator introduces a rigorous probabilistic framework to the evaluation of market regimes by modeling price fluctuations as a Bernoulli Process. Unlike traditional oscillators that merely measure the magnitude of price movement, this script treats every bar as a discrete "trial" that either succeeds or fails based on specific conditions—such as directional price action, momentum thresholds, or trend alignment. By applying Information Theory and the principles of Maximum Likelihood Estimation (MLE), the script quantifies not just the direction of the market, but the statistical reliability and the "noise" content of the current sequence. This allows traders to distinguish between a structured trend and high-entropy market "chop," providing a level of objective clarity often missing in standard technical analysis. ● ✨ Originality and Utility The primary innovation of this script lies in its transition from deterministic price tracking to stochastic regime modeling. Most indicators suffer from the "binary trap," where they simply tell a trader if price is above or below a level without assessing the statistical significance of that state. • Quantifying Market Information By integrating Shannon’s Binary Entropy, the script measures the uncertainty inherent in a price sequence. When entropy is near 1.0, the market is in a state of maximum uncertainty (effectively a fair coin toss), signaling that a trader should likely avoid the "noise." Conversely, low entropy values indicate a high-information state where one side of the Bernoulli trial is dominating, suggesting a persistent trend. • Adaptive Definition of Success The script is not limited to a single logic; it allows the user to define what constitutes a "Success" in the Bernoulli trial. Whether you prioritize raw price action (Close > Open), momentum (RSI > 50), or trend-following (Price > Moving Average), the underlying probabilistic engine remains consistent, making it a versatile tool for various trading styles. • Z-Score Significance Testing It applies a Central Limit Theorem (CLT) approximation to calculate a Z-Score. This tells the trader how many standard deviations the current trend is away from a random walk (p=0.5). This provides a mathematical filter to avoid entering "trends" that are actually within the bounds of statistical randomness. ● 🔬 Methodology and Concepts The script operates through a four-stage mathematical pipeline that converts raw market data into probabilistic metrics. • Stage 1: The Bernoulli Trial (I) The foundation is the indicator variable (I). On every bar, the script evaluates a boolean condition. If the condition is met, the trial is a "Success" (1.0); otherwise, it is a "Failure" (0.0). This transforms complex candles into a simple binary sequence: {1, 0, 1, 1, 0...}. • Stage 2: Probability Estimation (p-hat) Using a rolling window of length N, the script calculates the Maximum Likelihood Estimate (MLE) of the probability parameter 'p'. This is essentially the sample mean of the successes within the window. A value of 0.7 suggests that in the last N trials, 70% were successful. • Stage 3: Binary Entropy Calculation The script calculates Entropy H(p) using the formula: H(p) = -p * log2(p) - (1-p) * log2(1-p) This provides a metric for "Trend Quality." If p is 0.5 (random), H(p) is 1.0 (maximum noise). If p is 1.0 or 0.0 (perfect trend), H(p) is 0.0 (maximum order). • Stage 4: Volatility-Adjusted Z-Score To determine if a sequence is truly anomalous, the script calculates the standard deviation of a fair process and compares the observed deviations to this baseline. This identifies "Significant Trends" that are mathematically distinct from a 50/50 random distribution. ● 🎨 Visual Guide The visual interface is designed to communicate complex statistical data through intuitive color-coded cues. • The Bernoulli Probability Line The main plot is a continuous line representing the estimated probability (p). A value above 0.5 indicates a bullish bias (p-hat > 0.5). A value below 0.5 indicates a bearish bias (p-hat < 0.5). • Dynamic Entropy Coloring The line does not just change color based on direction; it changes based on certainty. Vibrant Green: Strong bullish trend with low entropy (High Certainty). Vibrant Red: Strong bearish trend with low entropy (High Certainty). Gray/Faded Color: High entropy regime (Entropy > 0.9). This signals that the market is "choppy" and the probability of success is too close to random to be reliable. • Background Entropy Zones The chart background highlights areas of "Max Entropy" in a subtle gray color. When you see these zones, it suggests the current Bernoulli definition is failing to find a directional edge, signaling a period of market consolidation. • Real-Time Metrics Dashboard A table in the top-right corner displays: Probability (p): The exact decimal value of the current trend probability. Entropy (Bits): The current level of uncertainty in the sequence. Regime: A text-based label identifying the market state (Bull Trend, Bear Trend, or Noise/Chop). • Execution Signals Small triangles appear on the chart to mark high-probability transition points. A Triangle Up (Green) marks a bullish breakout from a low-entropy state, while a Triangle Down (Red) marks a bearish breakdown. ● 📖 How to Use • Identifying Low-Noise Entries Traders should look for instances where the Probability Line crosses the 0.5 threshold while Entropy is low (vibrant colors). If the line is gray, the "trend" lacks statistical significance, and the risk of a whip-saw is high. • Regime Filtering Use the indicator as a "Mode Filter." If the Dashboard displays "NOISE / CHOP," it is a signal to stay flat or use mean-reversion strategies. If it displays a "TREND" regime, trend-following strategies can be deployed with higher confidence. • Interpreting the Z-Score While not directly plotted, the Z-Score logic powers the signal generation. A signal is only produced when the deviation from the "Fair Coin" (0.5) is substantial enough to suggest a non-random event. ● ⚙️ Inputs and Settings • Bernoulli Trial Definition Choose between three calculation modes: Price Action: Uses the relationship between Close and Open (Directional bars). Momentum: Uses RSI relative to the 50-level (Standard momentum). Trend: Uses Price relative to a Simple Moving Average (Long-term regime). • Sample Window (N) Determines the "lookback" for the probability calculation. Smaller values (e.g., 10-15) are more responsive but noisier; larger values (e.g., 30-50) provide a smoother, more institutional view of the regime. • Risk Management (Alerts) Target R:R Ratio: Used to calculate the Take Profit level in the JSON alerts. Stop ATR Multiplier: Uses Average True Range to calculate a volatility-adjusted stop loss for signals. ● 🔍 Deconstruction of the Underlying Scientific and Academic Framework The "Bernoulli Process: Trend Probability & Entropy" script is built upon the pillars of Discrete Stochastic Processes and Information Theory. • The Law of Large Numbers (LLN) The script relies on the LLN, which states that as a sample size grows, its mean gets closer to the average of the whole population. By using a "Sample Window," we are performing a rolling MLE of the true underlying probability parameter of the market at that moment. • Shannon Entropy and Information Theory Claude Shannon’s 1948 work on information entropy is the bedrock of the "Noise" detection in this script. In the context of trading, entropy represents the "surprise" or "uncertainty" in the price sequence. A low-entropy market is one where the next bar's success/failure is highly predictable based on the recent past, which is the mathematical definition of a trend. • Bernoulli vs. Gaussian Distributions Most indicators assume a Normal (Gaussian) distribution of price returns. However, market states are often better modeled as discrete outcomes (Up/Down). By treating the market as a Bernoulli Process, we bypass the "fat-tail" problem of Gaussian distributions and focus purely on the frequency of successful outcomes, making the tool more robust against outliers. • The Z-Test for Proportions By applying a Z-score calculation to a Bernoulli distribution, the script treats the market like a "biased coin" experiment. It tests the Null Hypothesis ($H_0$): "The market is a fair coin (p=0.5)." When the Z-score is high, we reject $H_0$ in favor of the Alternative Hypothesis ($H_1$): "The market is trending (p != 0.5)." ⚠️ Disclaimer All provided scripts and indicators are strictly for educational exploration and must not be interpreted as financial advice or a recommendation to execute trades. I expressly disclaim all liability for any financial losses or damages that may result, directly or indirectly, from the reliance on or application of these tools. Market participation carries inherent risk where past performance never guarantees future returns, leaving all investment decisions and due diligence solely at your own discretion.Chỉ báo Pine Script®của MarkitTick30
Strategy Pack by cryptokazancevStrategy Pack by cryptokazancev Комплексный инструмент для анализа рыночной структуры / Comprehensive Market Structure Analysis Tool 🇷🇺 Описание на русском Strategy Pack by cryptokazancev - это мощный набор инструментов для технического анализа, включающий: • Ордерблоки (Order Blocks) с настройкой количества и цветов • Пивоты (Pivot Points) различных таймфреймов • Рыночную структуру с зонами Фибоначчи (0.618, 0.786) • Разворотные конструкции (пинбары и поглощения) • Зоны интереса на основе скопления свингов 📊 Основные функции: 1. Ордерблоки - Автоматическое определение бычьих/медвежьих OB - Настройка максимального количества блоков (до 30) - Кастомизация цветов 2. Пивоты - Поддержка таймфреймов: Дневные/Недельные/Месячные/Квартальные/Годовые - Уровни Camarilla (P, R1-R4, S1-S4) 3. Рыночная структура - Четкое определение тренда (UP/DOWN) - Ключевые уровни Фибо (0.618 и 0.786) - Настройка глубины анализа (10-1000 баров) 4. Разворотные конструкции - Обнаружение пинбаров - Обнаружение поглощений - Настройка чувствительности 5. Зоны интереса - Алгоритм кластеризации свингов - Настройка через ATR-мультипликатор - Лимит отображаемых зон 🇬🇧 English Description Strategy Pack is a comprehensive market analysis toolkit featuring: • Order Blocks with customizable count and colors • Pivot Points for multiple timeframes • Market Structure with Fibonacci zones • Reversal patterns (pinbars and engulfings) • Interest Zones based on swing clustering 📊 Key Features: 1. Order Blocks - Auto-detection of bullish/bearish OB - Configurable max blocks (up to 30) - Custom color schemes 2. Pivot Points - Supports: Daily/Weekly/Monthly/Quarterly/Yearly - Camarilla levels (P, R1-R4, S1-S4) 3. Market Structure - Clear trend detection (UP/DOWN) - Key Fibonacci levels (0.618 & 0.786) - Adjustable analysis depth (10-1000 bars) 4. Reversal Patterns - Smart pinbar detection - ATR-based engulfing filter - Sensitivity adjustment 5. Interest Zones - Swing clustering algorithm - ATR-multiplier configuration - Display limit (up to 10 zones) ⚙️ Technical Highlights: • Built with Pine Script v5 • Performance-optimized • Well-commented code • Flexible settings system ⚠️ Важно / Important: Индикатор в бета-версии. Тестируйте перед использованием в реальной торговле. This is BETA version. Please test before live trading. 💬 Поддержка / Support: Комментарии к скрипту / Script comments section Developer: ZeeZeeMonChỉ báo Pine Script®của cryptokazancev113
Adaptive Buy Sell Signal [AvantCoin] A comprehensive customized indicator for different markets 🔴Before you start🔴: Please note that this tool is designed to assist you in analyzing the market, and NOT to make buy/sell decisions for you. You should combine its data with your own strategies and indicators before making any trading choices ==================== Market-Specific Optimizations Auto-Detection (or Manual Selection) It automatically detects which market you're trading: Forex (EUR/USD, GBP/USD, etc.) Stocks (AAPL, TSLA, etc.) Indices (NAS100, SPX, etc.) Commodities (Gold, Silver, Oil) Crypto (BTC, ETH, etc.) avantcoin.com Forex-Specific Features: ✅ Session Filters: Avoids low-liquidity Asian session ✅ Session backgrounds: Green for London/NY overlap (best trading time) ✅ Tighter ADX threshold (20) - good for Forex trends ✅ Lower volatility filter - skips dead zones ⚙️ Min Confluence: 5 (balanced) ⚙️ Cooldown: 5 bars ⚙️ Volume threshold: 1.3x (Forex has consistent volume) avantcoin.com Stocks-Specific Features: ✅ Market hours filter: Only signals during NYSE hours. ✅ Gap detection: Avoids trading immediately after large gaps up/down ✅ Higher ADX threshold (22) - Stocks trend differently ✅ Stricter volume requirement (1.5x) - Stocks vary more ⚙️ Min Confluence: 6 (higher quality) ⚙️ Cooldown: 3 bars (stocks move faster) Indices (Nasdaq, S&P; 500): ✅ Similar to stocks but slightly more lenient ✅ Lower ADX (18) - Indices are smoother ⚙️ Min Confluence: 5 ⚙️ Cooldown: 4 bars Commodities (Gold, Silver, Oil): ✅ Highest ADX requirement (23) - Only trade strong trends ✅ Higher volatility filter (1.6x) - Commodities can be wild ⚙️ Min Confluence: 6 ⚙️ Cooldown: 6 bars (avoid whipsaws) Crypto: ✅ 24/7 trading (no session restrictions) ✅ Lower ADX (15) - Crypto is always volatile ✅ Much higher volume threshold (2.0x) - Crypto volume spikes ⚙️ Min Confluence: 4 (crypto moves fast) ⚙️ Cooldown: 3 bars 📊 Visual Enhancements: Market Type Badge at top of table (Forex, Stocks, etc.) Session Status: Forex: Shows 🟢 LDN/NY, 🔵 London, 🟠 NY, 🔴 Asian Stocks: Shows 🟢 Open or 🔴 Closed Session Background Colors on chart (optional) Current Settings Display: Shows your Min score, ADX threshold, Cooldown ⚙️ How to Use: For Forex: Enable "Avoid Asian Session" Best signals during London/NY overlap For Stocks: Enable "Trade Stock Hours Only" Watch for gap warnings avantcoin.comChỉ báo Pine Script®của AvantCoin180
System Core B Monthly Value + Weekly RegimeWhat this indicator does This indicator builds a weekly “regime engine” around a manual monthly value area and then summarizes everything in a small on-chart dashboard. It answers four questions: Are we inside monthly value, near an edge, or trading outside it? Is the weekly action rotating, compressing, or escaping away from value? How has price moved inside the weekly range vs two weeks ago (up / down / flat)? Are weekly range and volume “normal”, tight, or quiet relative to recent history? You provide the monthly VAH / VAL once, and the script monitors how weekly bars behave around that zone. Core logic Monthly value area You manually enter Monthly VAH (upper) and Monthly VAL (lower). The script checks whether each weekly close is: Outside above VAH Outside below VAL Inside but near VAH Inside but near VAL Inside and away from edges A small “Location” label reports this as: Outside Above VAH Outside Below VAL Inside (Near VAH) Inside (Near VAL) Inside Value The “near” zone width is controlled by a percent buffer of the monthly value width. Weekly range and volume stats On the weekly timeframe the script calculates: RangeRatio (RR) = weekly high–low divided by weekly ATR(14) VolumeRatio (VR) = weekly volume divided by a volume SMA (configurable length) It then counts over a recent window: How many of the last 6 weeks had “normal” RR (between 0.6 and 1.1 × ATR). How many of the last 4 weeks had tight RR (RR < 0.8). How many of the last 4 weeks had quiet volume (VR ≤ 1.0). How many of the last 6 weekly closes were inside monthly value. These counts drive the regime classification and are also shown in the dashboard. Regime classification The regime engine is designed around three states: Rotating (A – Rotating) All 6 of the last 6 weekly closes are inside monthly value. At least 4 of those 6 weeks have normal RR. → Typical “range / rotation around value” environment. Compressing (A – Compressing) Last 4 weekly closes all inside monthly value. At least 3 of the last 4 weeks have tight RR. At least 3 of the last 4 weeks have quiet volume. → Volatility contraction and quieter trade inside value. Escaping (B – Escaping) At most 3 of the last 6 weekly closes are still inside value. Last 3 weekly closes are clustered in the top or bottom quartile of their ranges. At least 1 recent week shows high RR (“impulse” move). Current weekly close is progressing further in that direction vs two weeks ago. → Expansion / trend away from value. Priority is: Escaping > Compressing > Rotating. If monthly VAH/VAL are missing, regime is set to MISSING monthly VAH/VAL. If none of the patterns fit cleanly, regime is labeled MIXED. A separate “Progress vs 2w ago” tag reports: Up vs 2w ago Down vs 2w ago Flat vs 2w ago based on the position of the current weekly close within its range compared to two weeks prior. Visuals Lines Optional Monthly VAH and Monthly VAL horizontal lines. Background shading (optional) If Shade background by regime is enabled and monthly values are present: Compressing → blue tint Escaping → orange tint Rotating → green tint Other / mixed → light gray tint If the shading option is off or monthly VAH/VAL are missing, the background is not modified. Dashboard table A compact table (corner is configurable) shows: Row 0: Weekly Regime – regime label (B Escaping / A Compressing / A Rotating / MIXED / missing) Row 1: Location – monthly value location text (inside / near edge / outside) Row 2: Progress – up / down / flat vs two weeks ago Row 3: Inside (6w) – count of weeks inside value out of last 6 Row 4: RR Normal (6w) – count of “normal RR” weeks in last 6 Row 5: Tight/Quiet (4w) – string summary: RR tight: X | Vol quiet: Y (counts over last 4 weeks) Inputs Monthly VAH / VAL (manual) Monthly VAH (upper value) Monthly VAL (lower value) Show Monthly VAH / VAL (on/off) Monthly buffer Near-edge buffer (% of value width) – defines how close to VAH/VAL counts as “near”. Weekly Regime Engine Top percentile threshold (0..1) – default 0.75 (top quartile of weekly range) Bottom percentile threshold (0..1) – default 0.25 Weekly volume SMA length – lookback for VR normalization Shade background by regime – enable/disable colored background Dashboard Show dashboard – show/hide the table Dashboard corner – Top Left / Top Right / Bottom Left / Bottom Right How to use it Set Monthly VAH / VAL for the current contract / product. Watch the regime label + background color to know if weekly structure is: Ranging around value Compressing quietly inside value Attempting to escape and trend away Use Location and Inside Count to judge how anchored price still is to the monthly value area. Use the RR / volume counts and Progress vs 2w ago to decide whether to treat current moves as range trades, breakout attempts, or fading candidates. This is built to be a weekly “state of the environment” layer you can combine with your more granular entry tools.Chỉ báo Pine Script®của jackes870
Ultimate Open Marker with Time ZonesYour Ultimate Open Marker with Time Zones: Preset Market Opens: NY Open (9:30 AM ET) - default London Open (8:00 AM GMT) Frankfurt Open (9:00 AM CET) Tokyo Open (9:00 AM JST) Hong Kong Open (9:30 AM HKT) Sydney Open (10:00 AM AEST) Custom Time Zone Option: 18 major time zones to choose from: Set any hour (0-23) and minute (0-59) for your custom open Custom label text (e.g., "RTH Start", "Open", etc.) Works on every timeframe including custom ones. Marker Settings: - Default: Sky blue flag with background highlight and time label for the NY open as default. You can change all that in the settings. - Various marker shape options: Triangle, Diamond, Label Flag, Arrow Up/Down, Arrow this, Arrow that... So you can pick whatever annoys you the least lol - Auto-positioning: above bear candles, below bull candles (default) - or always above/below - 5 sizes from tiny to huge - Vertical offset fine-tuning - you can move your marker closer to the bar if you like, or farther from it Vertical Lines Options: - Line ON the 9:30 bar - Line BEFORE the 9:30 bar (so on 5min you'd see a line on 9:25, on 15min on 9:15, etc. - this way you can see the open candle well) Time Label Option: Default "9:30 EST" label (customizable text, color, size) Automatically shows the open time and timezone abbreviation For custom: shows your label + time + timezone (e.g., "Open 9:30 AM ET") Date Label Option: Four format options: - MM/DD/YY (American) - DD/MM/YY (European) - DD Mon. 'YY (Written, like "04 Feb. '26") - Mon DD, YYYY (Full) Plus optional day of week (short or full) Bonus: Background highlight option for the open bar Let me know if you need any adjustments. Thanks. : )Chỉ báo Pine Script®của Stokrotka4