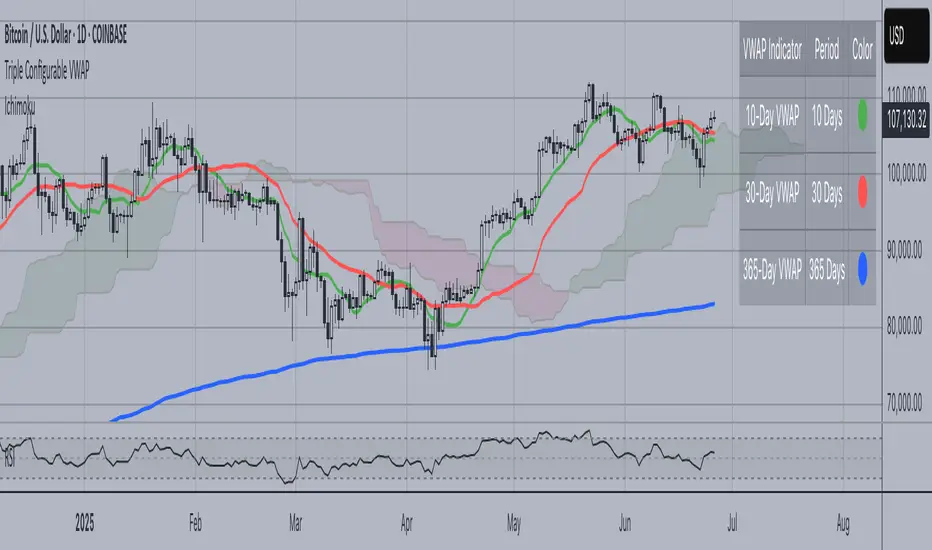
Institutional Rolling VWAPs • 3 lines + editable σ bands3 rolling vwaps, time stamped, same on htf and lft for high level executionChỉ báo Pine Script®của HTK2326
Technical Summary VWAP | RSI | VolatilityTechnical Summary VWAP | RSI | Volatility The Quantum Trading Matrix is a multi-dimensional market-analysis dashboard designed as an educational and idea-generation tool to help traders read price structure, participation, momentum and volatility in one compact view. It is not an automated execution system; rather, it aggregates lightweight “quantum” signals — VWAP position, momentum oscillator behaviour, multi-EMA trend scoring, volume flow and institutional activity heuristics, market microstructure pivots and volatility measures — and synthesizes them into a single, transparent score and signal recommendation. The primary goal is to make explicit why a given market looks favourable or unfavourable by showing the individual ingredients and how they combine, enabling traders to learn, test and form rules based on observable market mechanics. Each module of the matrix answers a distinct market question. VWAP and its percentage distance indicate whether the current price is trading above or below the intraday volume-weighted average — a proxy for intraday institutional control and value. The quantum momentum oscillator (fast and slow EMA difference scaled to percent) captures short-to-intermediate momentum shifts, providing a quickly responsive view of directional pressure. Multi-EMA trend scoring (8/21/50) produces a simple, transparent trend score by counting conditions such as price above EMAs and cross-EMAs ordering; this score is used to categorize market trend into descriptive buckets (e.g., STRONG UP, WEAK UP, NEUTRAL, DOWN). Volume analysis compares current volume to a recent moving average and computes a Z-score to detect spikes and unusual participation; additional buy/sell pressure heuristics (buyingPressure, sellingPressure, flowRatio) estimate whether upside or downside participation dominates the bar. Institutional activity is approximated by flagging large orders relative to volume baseline (e.g., volume > 2.5× MA) and estimating a dark pool proxy; this is a heuristic to highlight bars that likely had large players involved. The dashboard also performs market-structure detection with small pivot windows to identify recent local support/resistance areas and computes price position relative to the daily high/low (dailyMid, pricePosition). Volatility is measured via ATR divided by price and bucketed into LOW/NORMAL/HIGH/EXTREME categories to help you adapt stop sizing and expectational horizons. Finally, all these pieces feed an interpretable scoring function that rewards alignment: VWAP above, strong flow ratio, bullish trend score, bullish momentum, and favorable RSI zone add to the overall score which is presented as a 0–100 metric and a colored emoji indicator for at-a-glance assessment. The mashup is purposeful: each indicator covers a failure mode of the other. For example, momentum readings can be misleading during volatility spikes; VWAP informs whether institutions are on the bid or offer; volume Z-score detects abnormal participation that can validate a breakout; multi-EMA score mitigates single-EMA whipsaws by requiring a combination of price/EMA conditions. Combining these signals increases information content while keeping each component explainable — a key compliance requirement. The script intentionally emphasizes transparency: when it shows a BUY/SELL/HOLD recommendation, the dashboard shows the underlying sub-components so a trader can see whether VWAP, momentum, volume, trend or structure primarily drove the score. For practical use, adopt a clear workflow: (1) check the matrix score and read the component tiles (VWAP position, momentum, trend and volume) to understand the drivers; (2) confirm market-structure support/resistance and pricePosition relative to the daily range; (3) require at least two corroborating components (for example, VWAP ABOVE + Momentum BULLISH or Volume spike + Trend STRONG UP) before considering entries; (4) use ATR-based stops or daily pivot distance for stop placement and size positions such that the trade risks a small, pre-defined percent of capital; (5) for intraday scalps shorten holding time and tighten stops, for swing trades increase lookback lengths and require multi-timeframe (higher TF) agreement. Treat the matrix as an idea filter and replay lab: when an alert triggers, replay the bars and observe which components anticipated the move and which lagged. Parameter tuning matters. Shortening the momentum length makes the oscillator more sensitive (useful for scalping), while lengthening it reduces noise for swing contexts. Volume profile bars and MA length should match the instrument’s liquidity — increase the MA for low-liquidity stocks to reduce false institutional flags. The trend multiplier and signal sensitivity parameters let you calibrate how aggressively the matrix counts micro evidence into the score. Always backtest parameter sets across multiple periods and instruments; run walk-forward tests and keep a simple out-of-sample validation window to reduce overfitting risk. Limitations and failure modes are explicit: institutional flags and dark-pool estimates are heuristics and cannot substitute for true tape or broker-level order flow; volume split by price range is an approximation and will not perfectly reflect signed volume; pivot detection with small windows may miss larger structural swings; VWAP is typically intraday-centric and less meaningful across multi-day swing contexts; the score is additive and may not capture non-linear relationships between features in extreme market regimes (e.g., flash crashes, circuit breaker events, or overnight gaps). The matrix is also susceptible to false signals during major news releases when price and volume behavior dislocate from typical patterns. Users should explicitly test behavior around earnings, macro data and low-liquidity periods. To learn with the matrix, perform these experiments: (A) collect all BUY/SELL alerts over a 6-month period and measure median outcome at 5, 20 and 60 bars; (B) require additional gating conditions (e.g., only accept BUY when flowRatio>60 and trendScore≥4) and compare expectancy; (C) vary the institutional threshold (2×, 2.5×, 3× volumeMA) to see how many true positive spikes remain; (D) perform multi-instrument tests to ensure parameters are not tuned to a single ticker. Document every test and prefer robust, slightly lower returns with clearer logic rather than tuned “optimal” results that fail out of sample. Originality statement: This script’s originality lies in the curated combination of intraday value (VWAP), multi-EMA trend scoring, momentum percent oscillator, volume Z-score plus buy/sell flow heuristics and a compact, interpretable scoring system. The script is not a simple indicator mashup; it is a didactic ensemble specifically designed to make internal rationale visible so traders can learn how each market characteristic contributes to actionable probability. The tool’s novelty is its emphasis on interpretability — showing the exact contributing signals behind a composite score — enabling reproducible testing and educational value. Finally, for TradingView publication, include a clear description listing the modules, a short non-technical summary of how they interact, the tunable inputs, limitations and a risk disclaimer. Remove any promotional content or external contact links. If you used trademark symbols, either provide registration details or remove them. This transparent documentation satisfies TradingView’s requirement that mashups justify their composition and teach users how to use them. Quantum Trading Matrix — multi-factor intraday dashboard (educational use only). Purpose: Combines intraday VWAP position, a fast/slow EMA momentum percent oscillator, multi-EMA trend scoring (8/21/50), volume Z-score and buy/sell flow heuristics, pivot-based microstructure detection, and ATR-based volatility buckets to produce a transparent, componentized market score and trade-idea indicator. The mashup is intentional: VWAP identifies intraday value, momentum detects short bursts, EMAs provide structural trend bias, and volume/flow confirm participation. Signals require alignment of at least two components (for example, VWAP ABOVE + Momentum BULLISH + positive flow) for higher confidence. Inputs: momentum period, volume MA/profile length, EMA configuration (8/21/50), trend multiplier, signal sensitivity, color and display options. Use shorter momentum lengths for scalps and longer for swing analysis. Increase volume MA for thinly traded instruments. Limitations: Institutional/dark-pool estimates and flow heuristics are approximations, not actual exchange tape. VWAP is intraday-focused. Expect false signals during major news or low-liquidity sessions. Backtest and paper-trade before applying real capital. Risk Disclaimer: For education and analysis only. Not financial advice. Use proper risk management. The author is not responsible for trading losses. ________________________________________ Risk & Misuse Disclaimer This indicator is provided for education, analysis and idea generation only. It is not investment or financial advice and does not guarantee profits. Institutional activity flags, dark-pool estimates and flow heuristics are approximations and should not be treated as exchange tape. Backtest thoroughly and use demo/paper accounts before trading real capital. Always apply appropriate position sizing and stop-loss rules. The author is not responsible for any trading losses resulting from the use or misuse of this tool. ________________________________________ Risk Disclaimer: This tool is provided for education and analysis only. It is not financial advice and does not guarantee returns. Users assume all risk for trades made based on this script. Back test thoroughly and use proper risk management. Chỉ báo Pine Script®của aiTrendview-Charting-System1178
Uptrick: Zero Lag HMA Trend Suite1. Name and Purpose Uptrick: Zero Lag HMA Trend Suite is a Pine Version 6 script that builds upon the Hull Moving Average (HMA) to offer an advanced trend analysis tool. Its purpose is to help traders identify trend direction, potential reversals, and overall market momentum with reduced lag compared to traditional moving averages. By combining the HMA with Average True Range (ATR) thresholds, slope-dependent coloring, Volume Weighted Average Price (VWAP) ribbons, and optional reversal signals, the script aims to give a detailed view of price activity in various market environments. 2. Overview This script begins with the calculation of a Hull Moving Average, a method that blends Weighted Moving Averages in a way designed to cut down on lag while still smoothing out price fluctuations. Next, several enhancements are applied. The script compares current HMA values to previous ones for slope-based coloring, which highlights uptrends and downtrends at a glance. It also plots buy and sell signals when price moves beyond or below thresholds determined by the ATR and the user’s chosen signal multiplier. An optional VWAP ribbon can be shown to confirm bullish or bearish conditions relative to a volume-weighted benchmark. Additionally, the script can plot reversal signals (labeled with B) at points where price crosses back toward the HMA from above or below. Taken together, these elements allow traders to visualize both the short-term momentum and the broader context of how price interacts with volatility and overall market direction. 3. Why These Indicators Have Been Linked Together The reason the Hull Moving Average, the Average True Range, and the VWAP have been integrated into one script is to tackle multiple facets of market analysis in a single tool. The Zero Lag Hull Moving Average provides a responsive trend line, the ATR offers a measure of volatility that helps distinguish significant price shifts from typical fluctuations, and the VWAP acts as a reference for fair value based on traded volume. By layering all three, the script helps traders avoid the need to juggle multiple separate indicators and offers a holistic perspective. The slope-based coloring focuses on trend direction, the ATR-based thresholds refine possible buy and sell zones, and the VWAP ribbons provide insight into how price stands relative to an important volume-weighted level. The inclusion of up and down signals and reversal B labels further refines entries and exits. 4. Why Use Uptrick: Zero Lag HMA Trend Suite The Hull Moving Average is already known for reacting more quickly to price changes compared to other moving averages while retaining a degree of smoothness. This suite enhances the basic HMA by showing colored gradients that make it easy to spot trend direction changes, highlighting potential entry or exit points based on volatility-driven thresholds, and optionally layering a volume-based measure of bullish or bearish market sentiment. By relying on a zero lag approach and additional data points, the script caters to those wanting a more responsive method of identifying shifts in market dynamics. The added reversal signals and up or down alerts give traders extra confirmation for potential turning points. 5. How This Extension Improves on the Basic HMA This extension not only plots the Hull Moving Average but also includes data-driven alerts and visual cues that traditional HMA lines do not provide. First, it offers multi-layered slope coloring, making up or down trends quickly apparent. Second, it uses ATR-based thresholds to pinpoint moments when price may be extending beyond normal volatility, thus generating buy or sell signals. Third, the script introduces an optional VWAP ribbon to indicate whether the market is trading above or below this pivotal volume-weighted benchmark, adding a further confirmation step for bullish or bearish conditions. Finally, it incorporates optional reversal signals labeled with B, indicating points where price might swing back toward the main HMA line. 6. Core Components The script can be broken down into several primary functions and features. a. Zero Lag HMA Calculation Uses two Weighted Moving Averages (half-length and full-length) combined through a smoothing step based on the square root of the chosen length. This approach is designed to reduce lag significantly compared to other moving averages. b. Slope Detection Compares current and prior HMA values to determine if the trend is up or down. The slope-based coloring changes between turquoise shades for upward movement and magenta shades for downward movement, making trend direction immediately visible. c. ATR-Based Thresholding for Up and Down Signals The script calculates an Average True Range over a user-defined period, then multiplies it by a signal factor to form two bands around the HMA. When price crosses below the lower band, an up (buy) signal appears; when it crosses above the upper band, a down (sell) signal is shown. d. Reversal Signals (B Labels) Tracks when price transitions back toward the main HMA from an extreme zone. When enabled, these reversal points are labeled with a B and can help traders see potential turning points or mean-reversion setups. e. VWAP Bands An optional Volume Weighted Average Price ribbon that plots above or below the HMA, indicating bullish or bearish conditions relative to a volume-weighted price benchmark. This can also act as a kind of support/ resistance. 7. User Inputs a. HMA Length Controls how quickly the moving average responds to price changes. Shorter lengths react faster but can lead to more frequent signals, whereas longer lengths produce smoother lines. b. Source Specifies the price input, such as close or an alternative source, for the calculation. This can help align the HMA with specific trading strategies. c. ATR Length and Signal Multiplier Defines how the script calculates average volatility and sets thresholds for buy or sell alerts. Adjusting these values can help filter out noise or highlight more aggressive signals. d. Slope Index Determines how many bars to look back for detecting slope direction, influencing how sensitive the slope coloring is to small fluctuations. e. Show Buy and Sell Signals, Reversal Signals, and VWAP Lets users toggle the display of these features. Turning off certain elements can reduce chart clutter if traders prefer a simpler layout. 8. Calculation Process The script’s calculation follows a step-by-step approach. It first computes two Weighted Moving Averages of the selected price source, one over half the specified length and one over the full length. It then combines these using 2*wma1 minus wma2 to reduce lag, followed by applying another weighted average using the square root of the length. Simultaneously, it computes the ATR for a user-defined period. By multiplying ATR by the signal multiplier, it establishes upper and lower bands around the HMA, where crossovers generate buy (up) or sell (down) signals. The script can also plot reversal signals (B labels) when price crosses back from these bands in the opposite direction. For the optional VWAP feature, Pine Script’s ta.vwap function is used, and differences between the HMA and VWAP levels determine the color and opacity of the ribbon. 9. Signal Generation and Filtering The ATR-based thresholds reduce the influence of small, inconsequential price swings. When price falls below the lower band, the script issues an up (buy) signal. If price breaks above the upper band, a down (sell) signal appears. These signals are visible through labels placed near the bars. Reversal signals, labeled with B, can be turned on to help detect when price retraces from an extended area back toward the main HMA line. Traders can disable or enable these signals to match their preferred level of chart detail or risk tolerance. 10. Visualization on the Chart The Zero HMA Lag Trend Suite aims for visual clarity. The HMA line is plotted multiple times with increasing transparency to create a gradient effect. Turquoise gradients indicate upward slopes, and magenta gradients signify downward slopes. Bar coloring can be configured to align with the slope direction, providing quick insight into current momentum. When enabled, buy or sell labels are placed under or above the bars as price crosses the ATR-defined boundaries. If the reversal option is active, B labels appear around areas where price changes direction. The optional VWAP ribbons form background bands, using distinct coloration to signal whether price is above or below the volume-weighted metric. 11. Market Adaptability Because the script’s parameters (HMA length, ATR length, signal multiplier, and slope index) are user-configurable, it can adapt to a wide range of markets and timeframes. Intraday traders may prefer a shorter HMA length for quick signals, while swing or position traders might use a longer HMA length to filter out short-lived price changes. The source setting can also be adjusted, allowing for specialized data inputs beyond just close or open values. 12. Risk Management Considerations The script’s signals and labels are based on past price data and volatility readings, and they do not guarantee profitable outcomes. Sharp market reversals or unforeseen fundamental events can produce false signals. Traders should combine this tool with broader risk management strategies, including stop-loss placement, position sizing, and independent market analyses. The Zero HMA Lag Trend Suite can help highlight potential opportunities, but it should not be relied upon as the sole basis for trade decisions. 13. Combining with Other Tools Many traders choose to verify signals from the Zero HMA Lag Trend Suite using popular indicators like the Relative Strength Index (RSI), Moving Average Convergence Divergence (MACD), or even simple volume-based metrics to confirm whether a price movement has sufficient momentum. Conventional techniques such as support and resistance levels, chart patterns, or candlestick analysis can also supplement signals generated by the script’s up, down, or reversal B labels. 14. Parameter Customization and Examples a. Short-Term Day Trading Using a shorter HMA length (for instance, 9 or 14) and a slightly higher ATR multiplier might provide timely buy and sell signals, though it may also produce more whipsaws in choppy markets. b. Swing or Position Trading Selecting a longer HMA length (such as 50 or 100) with a moderate ATR multiplier can help users track more significant and sustained market moves, potentially reducing the effect of minor fluctuations. c. Multiple Timeframe Blends Some traders load two versions of the indicator on the same chart, one for short-term signals (with frequent B label reversals) and another for the broader trend direction, aligning entry and exit decisions with the bigger picture. 15. Realistic Expectations Even though the Hull Moving Average helps minimize lag and the script incorporates volatility-based filters and optional VWAP overlays, it cannot predict future market behavior with complete accuracy. Periods of low liquidity or sudden market shocks can still lead to signals that do not reflect longer-term trends. Frequent parameter review and manual confirmation are advised before executing trades based solely on the script’s outputs. 16. Theoretical Background The Hull Moving Average formula aims to balance smoothness with reactivity, accomplished by combining Weighted Moving Averages at varying lengths. By subtracting a slower average from a faster one and then applying another smoothing step with the square root of the original length, the HMA is designed to respond more promptly to price changes than typical exponential or simple moving averages. The ATR component, introduced by J. Welles Wilder, calculates the average range of price movement over a user-defined period, allowing the script to assess volatility and adapt signals accordingly. VWAP provides a volume-weighted benchmark that many institutional traders track to gauge fair intraday value. 17. Originality and Uniqueness Although multiple HMA-based indicators can be found, Uptrick: Zero Lag HMA Trend Suite sets itself apart by merging slope-based coloring, ATR thresholds, VWAP ribbons, up or down labels, and optional reversal signals all in one cohesive platform. This synergy aims to reduce chart clutter while still giving traders a comprehensive look at trend direction, volatility, and volume-based sentiment. 18. Summary Uptrick: Zero Lag HMA Trend Suite is a specialized trading script designed to highlight potential market trends and reversals with minimal delay. It leverages the Hull Moving Average for an adaptive yet smooth price line, pairs ATR-based thresholds for detecting possible breakouts or dips, and provides VWAP-based ribbons for added volume-weighted context. Traders can further refine their entries and exits by enabling up or down signals and reversal labels (B) where price may revert toward the HMA. Suitable for a wide range of timeframes and instrument types, the script encourages a disciplined approach to trade management and risk control. 19. Disclaimer This script is provided for informational and educational purposes only. Trading and investing involve significant financial risk, and no indicator can guarantee success under all conditions. Users should practice robust risk management, including the placement of stop losses and position sizing, and should confirm signals with additional analysis tools. The developer of this script assumes no liability for any trading decisions or outcomes resulting from its use.Chỉ báo Pine Script®của UptrickCập nhật 1414 1.2 K
BK Multiple MA, RMA, SMA, HMA, VWAP, Rolling VWAP **Indicator Description** I’m incredibly proud to introduce my third indicator to the TradingView community: **BK Multiple MA with HMA, VWAP, and Rolling VWAP**! This tool has been a game-changer in my trading strategy, and I’m excited to share it with others who are navigating the markets. This indicator holds a special place in my heart because it represents the first technical analysis concept introduced to me by my mentor when I began apprenticing under him. His wisdom, guidance, and passion for trading—and for life—left an indelible mark on my journey. I dedicate this work, and every indicator I introduce, to the foundation he helped me build, while giving glory first and foremost to God. **Moving Averages (MAs)** are one of the most widely used tools in technical analysis, and this indicator takes them to the next level. It allows you to plot **six fully customizable moving averages simultaneously**, with options including: - **Exponential Moving Average (EMA)** - **Simple Moving Average (SMA)** - **Relative Moving Average (RMA)** - **Hull Moving Average (HMA)** - **Volume Weighted Average Price (VWAP)** - **Rolling VWAP** This flexibility makes the indicator highly versatile, whether you’re a day trader, swing trader, or long-term investor. By customizing periods, colors, and line widths for each MA, you can tailor the indicator to perfectly suit your trading style. **Key Features** 1. **Six Fully Customizable MAs**: - Adjust periods, line colors, and widths to match your preferences. - Select from EMA, SMA, RMA, HMA, VWAP, or Rolling VWAP for each line. 2. **Unique Rolling VWAP Option**: - Rolling VWAP calculates the volume-weighted average price over a user-defined period, such as 200 candles. - This feature is ideal for traders seeking volume-weighted levels that don’t reset with each session, making it invaluable for trend-following and swing trading. 3. **HMA for Smoother Trends**: - The Hull Moving Average (HMA) is designed to reduce lag and provide a responsive, noise-free view of price trends. - It’s a powerful tool for spotting reversals and confirming directional momentum. 4. **Session VWAP**: - Traditional VWAP resets with each trading session, making it a reliable benchmark for intraday support and resistance levels. **How It Works** - **VWAP**: Reflects the average price weighted by volume for the current trading session, commonly used by institutional traders to identify key price levels. - **Rolling VWAP**: Extends VWAP functionality by calculating over a user-defined period, allowing for flexible multi-timeframe analysis. - **HMA**: A fast, smooth moving average that reacts quickly to price changes while filtering out noise. The combination of these options provides traders with a comprehensive view of market dynamics, enabling better decision-making. **Final Thoughts** This indicator is deeply meaningful to me because it represents the first concept my mentor introduced when I began apprenticing under him. His wisdom, guidance, and passion for trading—and for life—left an indelible mark on my journey. I dedicate this work, and every indicator I introduce, to the foundation he helped me build, while giving glory first and foremost to God. If this indicator helps you succeed, I humbly ask that you honor the blessings in your life by giving back—whether through acts of kindness, philanthropy, or helping others in need. May the Almighty guide us all toward wisdom and success in our endeavors. All glory belongs to God!Chỉ báo Pine Script®của Ki11a_BCập nhật 72
MERCURY by DrAbhiramSivprasad"MERCURY by DrAbhiramSivprasad" Developed from over 10 years of personal trading experience, the Mercury Indicator is a strategic tool designed to enhance accuracy in trading decisions. Think of it as a guiding light—a supportive tool that helps traders refine and build more robust strategies by integrating multiple powerful elements into a single indicator. I’ll be sharing some examples to illustrate how I use this indicator in my own trading journey, highlighting its potential to improve strategy accuracy. Reason behind the combination of emas , cpr and vwap is it provides very good support and resistance in my trading carrier so now i brought them together in one plate How It Works: Mercury combines three essential elements—EMA, VWAP, and CPR—each of which plays a vital role in detecting support and resistance: Exponential Moving Averages (EMAs): Known for their strength in providing dynamic support and resistance levels, EMAs help in identifying trends and shifts in momentum. This indicator includes a dashboard with up to nine customizable EMAs, showing whether each is acting as support or resistance based on real-time price movement. Volume Weighted Average Price (VWAP): VWAP also provides valuable support and resistance, often regarded as a fair price level by institutional traders. Paired with EMAs, it forms a dual-layered support/resistance system, adding an additional level of confirmation. Central Pivot Range (CPR): By combining CPR with EMAs and VWAP, Mercury highlights “traffic blocks” in your target journey. This means it identifies zones where price is likely to stall or reverse, providing additional guidance for navigating entries and exits. Why This Combination Matters: Using these three tools together gives you a more complete view of the market. VWAP and EMAs offer dynamic trend direction and support/resistance, while CPR pinpoints critical price zones. This combination helps you find high-probability trades, adding clarity to complex market situations and enabling stronger confirmation on trend or reversal decisions. How to Use: Trend Confirmation: Check if all EMAs are aligned (green for uptrend, red for downtrend), which is visible in the EMA dashboard. An alignment across VWAP, CPR, and EMAs signifies high confidence in trend direction. Breakouts & Breakdowns: Mercury has an alert system to signal when a price breakout or breakdown occurs across VWAP, EMA1, and EMA2. This can help in spotting strong directional moves. Example Application: In my trading, I use Mercury to identify support/resistance zones, confirming trends with EMA/VWAP alignment and using CPR as a checkpoint. I find this especially useful for day trading and swing setups. Recommended Timeframes: Day Trading: 5 to 15-minute charts for swift, actionable insights. Swing Trading: 1-hour or 4-hour charts for broader trend analysis. Note: The Mercury Indicator should be used as a supportive tool rather than a standalone strategy, guiding you toward informed decisions in line with your trading style and goals. EXAMPLE OF TRADE you can see the cart of XAUUSD on 11th nov 2024 1.SHORT POSITION - TIME FRAME 15 MIN So here for a short position you need to wait for a breakdown candle which will print in orange post the candle you need to check ema dashboard is completly red that indicates no traffic blocks in your journey to destiny target from ema's and you can take the target from nearest cpr support line TAKEN IN XAUUSD you can see in chart of XAUUSD on 7th nov 2.LONG POSITION - TIME FRAME 15 MIN - So here for long position you need to wait for a breakout candle from indicator thats here is blue and check all ema boxes are green and candle body should close above all the 3 lines here it is the both ema 1 and 2 and the vwap line then you can take and entry and your target will be the nearest resistance from the daily cpr 3. STOP LOSS CRITERIA After the entry any candle close below any of the last line from entry for example we have 3 lines vwap and ema 1 and 2 lines and u have made an entry and the last line before the entry is vwap then if any candle closes below vwap can be considered as stoploss like wise in any lines The MERCURY indicator is a comprehensive trading tool designed to enhance traders' ability to identify trends, breakouts, and reversals effectively. Created by Dr. Abhiram Sivprasad, this indicator integrates several technical elements, including Central Pivot Range (CPR), EMA crossovers, VWAP levels, and a table-based EMA dashboard, to offer a holistic trading view. Core Components and Functionality: Central Pivot Range (CPR): The CPR in MERCURY provides a central pivot level along with Below Central (BC) and Top Central (TC) pivots. These levels act as potential support and resistance, useful for identifying reversal points and zones where price may consolidate. Exponential Moving Averages (EMAs): MERCURY includes up to nine EMAs, with a customizable EMA crossover alert system. This feature enables traders to see shifts in trend direction, especially when shorter EMAs cross longer ones. VWAP (Volume-Weighted Average Price): VWAP is incorporated as a dynamic support/resistance level and, combined with EMA crossovers, helps refine entry and exit points for higher probability trades. Breakout and Breakdown Alerts: MERCURY monitors conditions for upside and downside breakouts. For an upside breakout, all EMAs turn green and a candle closes above VWAP, EMA1, and EMA2. Similarly, all EMAs turning red, combined with a close below VWAP and EMA1/EMA2, signals a downside breakdown. Continuous alerts are available until the trend shifts. Real-Time EMA Dashboard: A table displays each EMA’s relative position (Above or Below), helping traders quickly gauge trend direction. Colors in the table adjust to long/short conditions based on EMA alignment. Usage Recommendations: Trend Confirmation: Use the CPR, EMA alignments, and VWAP to confirm uptrends and downtrends. The table highlights trends, making it easy to spot long or short setups at a glance. Breakout and Breakdown Alerts: The alert system is customizable for continuous notifications on critical price levels. When all EMAs align in one direction (green for long, red for short) and the close is above or below VWAP and key EMAs, the indicator confirms a breakout/breakdown. Adaptable for Different Styles: Day Trading: Traders can set shorter EMAs for quick insights. Swing Trading: Longer EMAs combined with CPR offer insights into sustained trends. Recommended Settings: Timeframes: MERCURY is suitable for timeframes as low as 5 minutes for intraday traders, up to daily charts for trend analysis. Symbols: Works across forex, stocks, and crypto. Adjust EMA lengths for asset volatility. Example Strategy: Long Entry: When the price crosses above CPR and closes above both EMA1 and EMA2. Short Entry: When the price falls below CPR with a close below both EMA1 and EMA2.Chỉ báo Pine Script®của DRABHIRAMSS22397
Adaptive VWAP [QuantAlgo]Introducing the Adaptive VWAP by QuantAlgo 📈🧬 Enhance your trading and investing strategies with the Adaptive VWAP , a versatile tool designed to provide dynamic insights into market trends and price behavior. This indicator offers a flexible approach to VWAP calculations by allowing users to adapt it based on lookback periods or fixed timeframes, making it suitable for a wide range of market conditions. 🌟 Key Features: 🛠 Customizable VWAP Settings: Choose between an adaptive VWAP that adjusts based on a rolling lookback period, or switch to a fixed timeframe (e.g., daily, weekly, monthly) for a more structured approach. Adjust the VWAP to suit your trading or investing style. 💫 Dynamic Bands and ATR Filter: Configurable deviation bands with multipliers allow you to visualize price movement around VWAP, while an ATR-based noise filter helps reduce false signals during periods of market fluctuation. 🎨 Trend Visualization: Color-coded trend identification helps you easily spot uptrends and downtrends based on VWAP positioning. The indicator fills the areas between the bands for clearer visual representation of price volatility and trend strength. 🔔 Custom Alerts: Set up alerts for when price crosses above or below the VWAP, signaling potential uptrend or downtrend opportunities. Stay informed without needing to monitor the charts constantly. ✍️ How to Use: ✅ Add the Indicator: Add the Adaptive VWAP to your favourites and apply to your chart. Choose between adaptive or timeframe-based VWAP calculation, adjust the lookback period, and configure the deviation bands to your preferred settings. 👀 Monitor Bands and Trends: Watch for price interaction with the VWAP and its deviation bands. The color-coded signals and band fills help identify potential trend shifts or price extremes. 🔔 Set Alerts: Configure alerts for uptrend and downtrend signals based on price crossing the VWAP, so you’re always informed of significant market movements. ⚙️ How It Works: The Adaptive VWAP adjusts its calculation based on the user’s chosen configuration, allowing for a flexible approach to market analysis. The adaptive setting uses a rolling lookback period to continuously adjust the VWAP, while the fixed timeframe option anchors VWAP to key timeframes like daily, weekly, or monthly periods. This flexibility enables traders and investors to use the tool in various market environments. Deviation bands, calculated with customizable multipliers, provide a clear visual of how far the price has moved from the VWAP, helping you gauge potential overbought or oversold conditions. To reduce false signals, an ATR-based filter can be applied, ensuring that only significant price movements trigger trend confirmations. The tool also includes a fast exponential smoothing function for the VWAP, helping smooth out price fluctuations without sacrificing responsiveness. Trend confirmation is reinforced by the number of bars that price stays above or below the VWAP, ensuring a more consistent trend identification process. Disclaimer: The Adaptive VWAP is designed to enhance your market analysis but should not be relied upon as the sole basis for trading or investing decisions. Always combine it with other analytical tools and practices. No statements or signals from this indicator constitute financial advice. Past performance is not indicative of future results.Chỉ báo Pine Script®của QuantAlgoCập nhật 44331
Anchored VWAPs + DeviationsAnchored VWAPS *6 anchors to play with *Pre-defined anchors from pivot points (May need manual adjustment due to timezone difference) *Drag each anchor right from the screen instead of manually going to the settings>inputs Deviations: *Select from which anchor should the deviations start from *Manually input the desired deviation value/ratio, can be customised **Tips: To avoid clicking on the AVWAPS to enable the dragging line, just click on the title of the indicator. ***Work in progressChỉ báo Pine Script®của Jmorgado89Cập nhật 11167
MIDAS VWAP Jayy his is just a bash together of two MIDAS VWAP scripts particularly AkifTokuz and drshoe. I added the ability to show more MIDAS curves from the same script. The algorithm primarily uses the "n" number but the date can be used for the 8th VWAP I have not converted the script to version 3. To find bar number go into "Chart Properties" select " "background" then select Indicator Titles and "Indicator values". When you place your cursor over a bar the first number you see adjacent to the script title is the bar number. Put that in the dialogue box midline is MIDAS VWAP . The resistance is a MIDAS VWAP using bar highs. The resistance is MIDAS VWAP using bar lows. In most case using N will suffice. However, if you are flipping around charts inputting a specific date can be handy. In this way, you can compare the same point in time across multiple instruments eg first trading day of the year or an election date. Adding dates into the dialogue box is a bit cumbersome so in this version, it is enabled for only one curve. I have called it VWAP and it follows the typical VWAP algorithm. (Does that make a difference? Read below re my opinion on the Difference between MIDAS VWAP and VWAP ). I have added the ability to start from the bottom or top of the initiating bar. In theory in a probable uptrend pick a low of a bar for a low pivot and start the MIDAS VWAP there using the support. For a downtrend use the high pivot bar and select resistance. The way to see is to play with these values. Difference between MIDAS VWAP and the regular VWAP MIDAS itself as described by Levine uses a time anchored On-Balance Volume (OBV) plotted on a graph where the horizontal (abscissa) arm of the graph is cumulative volume not time. He called his VWAP curves Support/Resistance VWAP or S/R curves. These S/R curves are often referred to as "MIDAS curves". These are the main components of the MIDAS chart. A third algorithm called the Top-Bottom Finder was also described. (Separate script). Additional tools have been described in "MIDAS_Technical_Analysis" Midas Technical Analysis: A VWAP Approach to Trading and Investing in Today’s Markets by Andrew Coles, David G. Hawkins Copyright © 2011 by Andrew Coles and David G. Hawkins. Denoting the different way in which Levine approached the calculation. The difference between "MIDAS" VWAP and VWAP is, in my opinion, much ado about nothing. The algorithms generate identical curves albeit the MIDAS algorithm launches the curve one bar later than the VWAP algorithm which can be a pain in the neck. All of the algorithms that I looked at on Tradingview step back one bar in time to initiate the MIDAS curve. As such the plotted curves are identical to traditional VWAP assuming the initiation is from the candle/bar midpoint. How did Levine intend the curves to be drawn? On a reversal, he suggested the initiation of the Support and Resistance VVWAP (S/R curve) to be started after a reversal. It is clear in his examples this happens occasionally but in many cases he initiates the so-called MIDAS S/R VWAP right at the reversal point. In any case, the algorithm is problematic if you wish to start a curve on the first bar of an IPO . You will get nothing. That is a pain. Also in Levine's writings, he describes simply clicking on the point where a S/R VWAP is to be drawn from. As such, the generally accepted method of initiating the curve at N-1 is a practical and sensible method. The only issue is that you cannot draw the curve from the first bar on any security, as mentioned without resorting to the typical VWAP algorithm. There is another difference. VWAP is launched from the middle of the bar (as per AlphaTrends), You can also launch from the top of the bar or the bottom (or anywhere for that matter). The calculation proceeds using the top or bottom for each new bar. The potential applications are discussed in the MIDAS Technical Analysis book. Chỉ báo Pine Script®của jayyCập nhật 2121474
Day trade futures - ES VWAP Pullback v2.0 [Signals]ES VWAP Institutional Pullback v2.0 —— STRATEGY VERSION —— A futures day-trading system built specifically for /ES (S&P 500 E-mini) on the 5-minute timeframe. Designed around the premise that institutional algorithms benchmark entries against VWAP and that the highest-probability trades come from entering trend continuations after pullbacks — not from predicting reversals. This is not a typical MACD crossover strategy. Every component is filtered and confirmed before a signal fires. █ HOW IT WORKS The system requires four conditions to align before entering a trade: 1. Higher-Timeframe Trend Confirmation Uses a 50 EMA pulled from the 15-minute chart via request.security(). Price must be above this EMA for longs, below for shorts. This replaces the common approach of plotting a 200 EMA on the entry timeframe, which on a 5-minute chart represents ~17 hours of data and reacts too slowly to intraday regime changes. 2. VWAP Institutional Bias Price must be above the session VWAP for longs, below for shorts. VWAP is the benchmark institutional algorithms use to evaluate execution quality. Trading in the direction of VWAP bias aligns your entries with the dominant order flow. 3. MACD Histogram Reversal (Not Raw Crossover) Rather than entering on a standard MACD line crossover (which lags significantly on short timeframes), the system detects when the MACD histogram flips from negative to positive territory after being negative for at least two consecutive bars. This catches the exact moment selling pressure exhausts and buying momentum resumes — typically 1–3 bars earlier than a traditional crossover. 4. Volume Spike Confirmation The entry bar must have volume ≥ 1.2× its 20-bar simple moving average. A MACD histogram flip on thin volume is noise. Requiring a volume spike confirms that institutional participation is actually present at the reversal point. █ SESSION FILTER Futures trade nearly 24 hours, but VWAP-based strategies degrade outside Regular Trading Hours when volume thins and price action becomes erratic. The system enforces a hard session window of 9:30 AM – 3:30 PM Eastern by default. All positions are automatically closed at session end if the EOD close option is enabled. █ RISK MANAGEMENT Dynamic ATR-Based Stops Stop loss is calculated as 1.5× the 14-period ATR at the moment of entry. During volatile opens, your stop widens to give the trade room. During quiet midday action, it tightens to protect capital. This replaces fixed-point stops that get hunted during volatility expansion. Partial Profit at 1R When price reaches 1× your initial risk (the 1R level), 50% of the position is closed automatically. This locks in profit and reduces psychological pressure on the remaining runner. Trailing Stop After reaching the 1R trigger, a trailing stop activates at 0.75× ATR behind the current price. It only moves in your favor — never backward. This lets winners run in trending sessions while protecting gains. Full Take Profit at 2R The remaining position targets 2× the initial risk. Combined with the partial at 1R, the effective average exit on a full winner is approximately 1.5R. █ BACKTEST REALISM The strategy models: • $2.50 per contract commission (round-trip ~$5.00, typical for /ES) • 2-tick slippage ($25 per contract) • No fills on close — orders process on the next bar This matters. Many published strategies show inflated results because they assume zero friction. The performance you see in the Strategy Tester should be closer to what you would actually experience. █ DASHBOARD A real-time info table displays: • Current HTF trend direction • VWAP bias (above/below) • Current ATR value • Volume ratio vs. SMA (with color coding for spike detection) • Session status (active/closed) • Position status • MACD histogram value █ SETTINGS GUIDE Inputs are grouped logically. Key tuning parameters: Volume Multiple (default 1.2×) — Lower to 1.0× if you're getting too few signals in quieter sessions. Raise to 1.5× for stricter filtering. HTF Timeframe (default 15m) — The 15-minute 50 EMA represents ~12.5 hours of trend data. You can try 30m for a slower, more conservative filter. Trail Trigger (default 1.0R) — Set to 0.75R for more aggressive trailing. Set to 1.5R if you want the trail to activate later and give more room. Trail Offset (default 0.75 ATR) — Lower values trail tighter (more likely to get stopped but lock more profit). Higher values give more room but risk giving back gains. All filters (HTF, VWAP, Volume, Session) can be individually toggled off for testing which components add value in your specific market conditions. █ WHAT THIS IS NOT • This is not a scalping system. It targets 2R moves, not 2-tick scratches. • This is not a reversal catcher. It trades pullbacks within established trends. • This will not protect you from news events. Avoid FOMC, CPI, NFP, and other high-impact macro releases — no algorithm can predict those. • This is not financial advice. Futures are leveraged instruments. Backtest results do not guarantee future performance. █ RECOMMENDED USAGE • Chart: /ES 5-minute • Session: RTH only (9:30 AM – 3:30 PM ET) • Avoid: 15 minutes before/after high-impact economic data • Combine with: Level 2 / DOM for discretionary confirmation if available —— INDICATOR VERSION —— Same logic as the strategy but packaged as an indicator() for live discretionary trading: • No backtest engine overhead — lighter on your chart • Entry labels display exact SL, TP, and risk in points at signal time • 1R level plotted in cyan for visual partial-profit reference • Signal levels auto-expire after 50 bars or when SL/TP is hit • Alert conditions registered for both long and short signals — configure through TradingView's alert dialogChỉ báo Pine Script®của DayTradingMD19921
_mr_beach Liquidity Sweep + VWAP V2 Trend Filter, Presets_mr_beach Liquidity Sweep + VWAP Reversal V2 (Trend Filter, Presets) Overview This strategy models a common institutional market behavior: Liquidity is taken above the previous day’s high or below the previous day’s low, followed by a return toward fair value (VWAP) and a reversal in the direction of the dominant trend. The script is designed as a TradingView Strategy for systematic backtesting and optimization. ________________________________________ Core Logic • Liquidity Levels o Previous Day High o Previous Day Low Used as typical stop-liquidity zones. • Fair Value o VWAP is used as confirmation that price has returned to a fair value area. • Trend Filter o EMA-based trend direction filter to avoid counter-trend trades. ________________________________________ Trading Rules Trend Filter • Long trades only when price closes above EMA. • Short trades only when price closes below EMA. Liquidity Sweep • Bullish sweep: Price trades below Previous Day Low. • Bearish sweep: Price trades above Previous Day High. Entry Confirmation • Long o Sweep below Previous Day Low o Close back above Previous Day Low o Close above VWAP • Short o Sweep above Previous Day High o Close back below Previous Day High o Close below VWAP ________________________________________ Risk Management • Stop Loss: ATR-based • Take Profit: ATR-based • Risk automatically adapts to market volatility. • All multipliers are user-adjustable. ________________________________________ Preset Profiles The script includes ready-to-use preset profiles: • Index – conservative, session-based, one trade per day • Forex – session-filtered, moderate volatility settings • Crypto – higher volatility parameters, no session filter • Custom – fully manual configuration Presets control EMA length, ATR settings, SL/TP multipliers, session usage, and trade frequency. ________________________________________ Session & Trade Control • Optional session filter (default: US regular session) • Optional one trade per day limit to reduce overtrading and noise ________________________________________ Chart Elements • EMA (trend direction) • VWAP (fair value) • Previous Day High / Low (liquidity zones) ________________________________________ Alerts • Long setup: Liquidity sweep + VWAP reversal • Short setup: Liquidity sweep + VWAP reversal ________________________________________ Recommended Usage • Markets: Indices, liquid stocks, Forex majors, crypto • Timeframes: 5m and 15m • Parameters should be optimized per market and timeframe. ________________________________________ Disclaimer This script is for educational and backtesting purposes only. It does not constitute financial advice. Performance depends on market conditions, timeframe, fees, and execution. Tags: Liquidity, VWAP, EMA, Reversal, Sweep, Smart Money, ICT, ATR, Strategy Chiến lược Pine Script®của ReneHerkert11218
_mr_beach Liquidity Sweep + VWAP ReversalLiquidity Sweep + VWAP Reversal (Trend Filter, Session, 1 Trade per Day) Overview This strategy models a common institutional market behavior: liquidity is taken above the previous day’s high or below the previous day’s low, followed by a return toward fair value (VWAP) and a reversal in the direction of the prevailing trend. Designed as a TradingView strategy for structured backtesting in the Strategy Tester. Core Components Liquidity Levels: Previous Day High / Previous Day Low Fair Value Reference: VWAP Trend Filter: EMA (default: 200) Volatility-Based Risk: ATR Trading Rules Trend Filter Long only when price closes above EMA Short only when price closes below EMA Liquidity Sweep Bullish sweep: Low < Previous Day Low Bearish sweep: High > Previous Day High Entry Confirmation Long: After a sweep below the Previous Day Low, price closes back above the level and above VWAP Short: After a sweep above the Previous Day High, price closes back below the level and below VWAP Risk Management Stop Loss: ATR-based (slATR) Take Profit: ATR-based (tpATR) Automatically adapts to changing market volatility Session & Trade Frequency Optional session filter (default: 09:30–16:00 exchange time) Optional one trade per day limit to reduce overtrading Chart Elements EMA (trend direction) VWAP (fair value) Previous Day High / Low (liquidity zones) Alerts Long setup: Liquidity sweep + VWAP reversal Short setup: Liquidity sweep + VWAP reversal Recommended Usage Markets: Indices, liquid stocks, Forex majors, crypto Timeframes: 5m, 15m Note: Parameters such as ATR multipliers and session settings should be optimized per market Disclaimer This is a backtesting strategy, not financial advice. Results depend on market conditions, timeframe, fees, and slippage. Tags: Liquidity, VWAP, EMA, Reversal, Sweep, Smart Money, ICT, ATR, StrategyChiến lược Pine Script®của ReneHerkert37
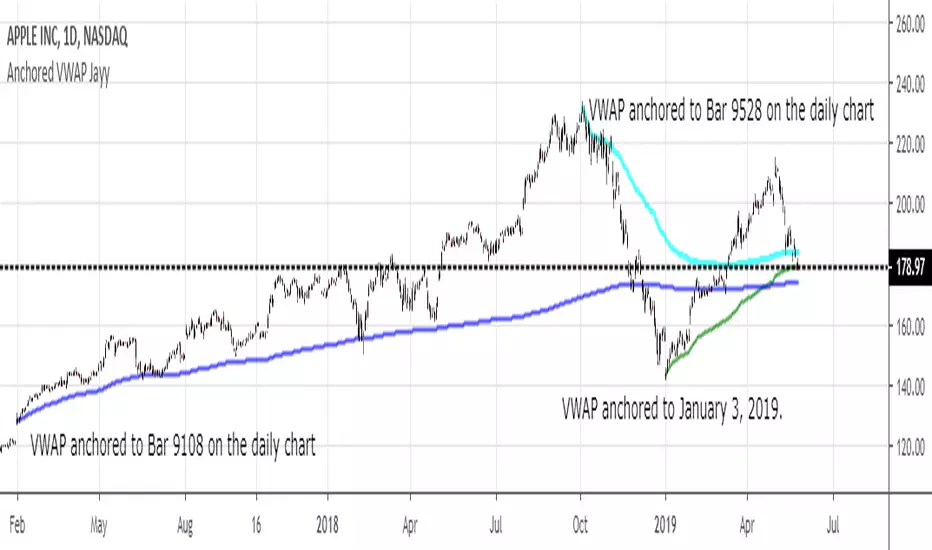
Anchored VWAPThe Anchored VWAP Indicator: A Dynamic Reference for Pivotal Market Events This script implements a specialized and highly customizable trading tool known as an Anchored Volume-Weighted Average Price (VWAP). Its core innovation and primary utility lie not in a novel mathematical formula, but in its temporal flexibility. Unlike the standard VWAP, which resets at the fixed start of each trading day, this indicator allows the trader to manually define the precise moment from which the calculation begins. This transforms it from a generic daily benchmark into a powerful, event-specific dynamic support and resistance level. What It Does and How It Works The indicator plots a single, continuous line on the price chart. This line represents the average price paid for an asset over a specified period, weighted by trading volume, but crucially, starting from a user-chosen timestamp. The calculation follows this logic: Anchor Point Definition: The user specifies a "Start Time" (e.g., "2024-05-22 11:45:00"). This is the anchor—the moment deemed significant for a new market phase. Initialization: On the very first candle at or immediately after the anchor time, the indicator initializes its calculation. It uses the candle's high price and volume to set an initial value, establishing a starting point for the cumulative calculation. Cumulative Calculation: For every subsequent candle, the script calculates the Typical Price (High + Low + Close) / 3 for that period. It then: Adds (Typical Price * Volume) to a running cumulative total. Adds the Volume to a running cumulative volume total. VWAP Plotting: The anchored VWAP line for each candle is simply the cumulative total price-value divided by the cumulative total volume up to that point. The line is only plotted for the period on and after the user-defined anchor time. How to Use It: The Strategic Application The power of this tool is unlocked through strategic anchor point selection. It is not a standalone signal generator but a dynamic reference framework for price action. It belongs to the family of Price Action-Based, Event-Driven Analysis and Dynamic Support/Resistance methodologies. Traders use it to contextualize price movement relative to a key market "reset" event. Common anchor points include: Major Economic News Releases: Anchor at the exact time of a CPI, FOMC, or jobs report to see the fair-value price discovery after the news, filtering out prior, irrelevant noise. Significant Technical Breaks: Anchor at the moment a price conclusively breaks a major trendline, a multi-month high/low, or a key chart pattern (like the neckline of a head and shoulders). The VWAP then acts as a dynamic gauge of momentum following the breakout. Session or Shift Changes: For 24-hour markets, anchor at the open of a specific session (e.g., London Open, US Open) to analyze intra-session flow. Instrument-Specific Events: Anchor at the start of a merger announcement, earnings call, or product launch. Once anchored, traders interpret price interaction with the line: Trend Validation: Price sustaining above a rising anchored VWAP (anchored at a breakout point) confirms bullish momentum. Conversely, holding below a falling VWAP confirms bearish momentum. Dynamic Support/Resistance: In a trending move, pullbacks towards the anchored VWAP often find support (in uptrends) or resistance (in downtrends). This makes it a potential area for trend-continuation entries. Mean Reversion & Exhaustion Signals: A sharp, high-volume move far away from the anchored VWAP may signal an overextended market, prompting watch for a reversion back to the mean (the VWAP line). The Core Philosophy and Rationale The underlying principle is that volume-confirmed price action following a defining event establishes a new, more relevant fair-value equilibrium. The standard daily VWAP includes all overnight or pre-event noise, which can distort the relevant average for the new market regime initiated by the event. This anchored approach: Filters Irrelevance: It isolates analysis to the market structure after the catalyst, providing a cleaner analytical canvas. Respects Market Microstructure: By weighting price by volume, it acknowledges that high-volume price levels are more significant than low-volume spikes, creating a more robust and "traded" average. Provides a Self-Adjusting Baseline: It creates a moving benchmark that evolves with the new trend, offering a continuous, objective measure of whether prices are becoming relatively "expensive" or "cheap" within the current move, not compared to the entire day. In essence, this Anchored VWAP shifts the perspective from a fixed, time-based cycle (the trading day) to a flexible, event-based cycle. It empowers traders to draw a dynamic line in the sand at their chosen moment of structural shift, turning a simple average into a sophisticated gauge of post-event market sentiment and momentum.Chỉ báo Pine Script®của neeson19879
ORB Breakout Strategy with VWAP and Volume FiltersOverview This strategy implements the classic Opening Range Breakout (ORB) methodology, a well-documented approach in trading literature that has been used by institutional and retail traders for decades. The strategy identifies the high and low of the first 15 minutes of the trading session, then trades breakouts with defined risk management. This implementation includes multiple customizable filters (VWAP, Volume, Candle Strength) that traders can enable, disable, and tune to find configurations that work for their specific markets and trading style. How It Works Opening Range Calculation The strategy captures the high and low of the first N bars after the session open (default: 3 bars on a 5-minute chart = 15 minutes). These levels become the breakout triggers for the session. Entry Logic Long Entry: When a bar closes above the ORB High and all enabled filters pass Short Entry: When a bar closes below the ORB Low and all enabled filters pass Exit Logic Take Profit: Configurable multiple of the ORB range (default: 1x = full range beyond breakout level) Stop Loss: Opposite side of the ORB range Breakeven: Optional stop adjustment to entry price when trade reaches configurable profit threshold Session Close: All positions automatically closed at end of trading session Configurable Filters All filters can be independently enabled or disabled: 1. VWAP Filter Requires price above/below session-anchored VWAP Requires VWAP slope confirmation (configurable lookback and minimum slope) Purpose: Align trades with intraday trend direction 2. Volume Filter Requires minimum volume on the breakout bar Purpose: Confirm institutional participation in the breakout 3. Candle Strength Filter Requires close in upper/lower portion of the bar range Purpose: Filter out weak breakouts with poor conviction Strategy Properties Initial Capital - $50.000USD Position Size - 1 contract (fixed) Commission - $4.00 per contract Slippage - 2 ticks Margin - 1% Pyramiding - Disabled Backtest Results (NQ) Recent Performance (Jan 2025 - Jan 2026) Total Trades - 243 Win Rate - 39.09% Profit Factor - 1.03 Net P&L - $3,581 (+7.16%) Max Drawdown - $25,447 (39.96%) Long-Term Performance (2010 - 2026) Total Trades - 1699 Win Rate - 37.61% Profit Factor - 0.756 Net P&L - ($49,632) (-99.26%) Max Drawdown - $50,262 (99.27%) Important: Long-term results show negative expectancy with default settings. This strategy is published as a research framework, not a ready-to-trade system. Users are encouraged to experiment with different configurations to find their edge. Settings Guide Main Settings ORB Bars: Number of bars for opening range (3 = 15 min on 5-min chart) Trading Session: Time window for trading (e.g., 0930-1200 for morning only) Timezone: Your market's timezone Take Profit: Multiple of ORB range for target Breakeven Trigger: Distance to move stop to entry Max Trades Per Day: Daily trade limit VWAP Filter Use VWAP Filter: Enable/disable VWAP Slope Lookback: Bars to measure VWAP direction Min VWAP Slope: Minimum slope threshold Volume Filter Use Volume Filter: Enable/disable Min Breakout Volume: Minimum contracts required Candle Strength Filter Use Candle Strength Filter: Enable/disable Min Candle Strength: Required close position (0.7 = top/bottom 30%) Research Suggestions This strategy provides a foundation for exploring ORB-based approaches. Consider testing: Different ORB periods: 5, 10, 15, or 30 minutes Session variations: Morning only (0930-1200), afternoon, or full day Direction bias: Long-only or short-only based on daily trend Filter combinations: Different mixes of VWAP, volume, and candle filters Take profit ratios: 0.5x, 1x, 1.5x, or 2x ORB range Market regimes: Performance may vary in trending vs ranging markets Different instruments: Test on ES, NQ, MNQ, or other futures Visual Elements Orange Background: ORB forming period Green Background: Active trading session Green Line: ORB High level Red Line: ORB Low level VWAP Line: Green = upslope, Red = downslope, Gray = flat White Line: Trade entry price Lime Line: Take profit level Red Line: Stop loss level Orange Line: Breakeven trigger level Blue Background: Breakeven activated Triangles: Entry signals (only appear when trade executes) Limitations Negative long-term expectancy: Default settings do not produce profitable results over extended periods Parameter sensitivity: Results highly dependent on filter settings and market conditions Market regime dependent: May perform differently in trending vs choppy markets Commission impact: Frequent trading accumulates significant transaction costs Curve fitting risk: Optimized settings may not persist in future markets Disclaimer This strategy is provided for educational and research purposes only. It does not constitute financial advice. Past performance does not guarantee future results Backtested results may not reflect actual trading conditions The long-term backtest shows significant negative returns Always paper trade before risking real capital Never risk more than you can afford to lose Conduct your own research and due diligence This is a research framework designed for traders to explore and customize, not a plug-and-play trading system.Chiến lược Pine Script®của luiscaballeroCập nhật 2239
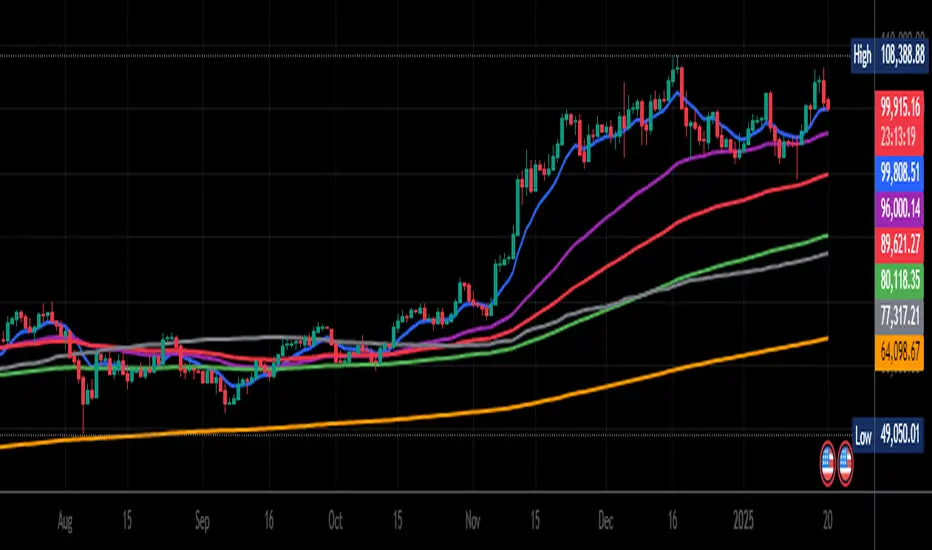
Anchored VWAP PercentageINDICATOR: ANCHORED VWAP PERCENTAGE (AVWAP) 1. Overview The Anchored VWAP Percentage (AVWAP) is a quantitative momentum and mean-reversion tool. It measures the percentage distance between the current price and a Volume Weighted Average Price (VWAP) that resets automatically based on specific time cycles. It allows traders to identify overextended market conditions relative to institutional value. --- 2. Core Logic & Calculation The script tracks the relationship between price and volume starting from a specific Anchor Point . * Volume-Weighted Foundation: Unlike simple moving averages, this indicator uses the VWAP formula: sum(Volume * Price) / sum(Volume) . * Automatic Anchoring: The starting point (Anchor) resets automatically depending on the chart timeframe (e.g., resets weekly on a 15m chart, or yearly on a Daily chart). * Percentage Deviation: It calculates the precise gap between the price and the VWAP, plotted as an oscillator: ((Price - VWAP) / VWAP) * 100 . --- 3. Adaptive Intelligence (Multi-Asset & Multi-TF) The AVWAP is built with an internal database of 85th Percentile (P85) volatility thresholds. It recognizes that different assets have different "stretching" limits: 1. Asset-Specific Calibration: It includes optimized data for Bitcoin, Ethereum, Altcoins, Forex, and Indices . 2. Dynamic Timeframe Mapping: The anchor period and the exhaustion thresholds adjust automatically. For example: * Intraday (1m-5m): Anchors to an 8-hour (480 min) cycle. * Mid-Term (15m-60m): Anchors to a Weekly (W) cycle. * Swing (Daily): Anchors to a Yearly (12M) cycle. --- 4. Visual Anatomy The indicator is designed for high-speed decision-making: * The Histogram: * Green: Price is trading above the VWAP (Bullish premium). * Red: Price is trading below the VWAP (Bearish discount). * P85 Threshold Lines: * These lines represent the 85th percentile of historical deviations . Historically, the price stays within these boundaries 85% of the time. * Background Highlighting: When the histogram crosses the P85 line, the background glows, signaling a Statistical Exhaustion Zone where a retracement to the mean is highly probable. --- 5. How to Trade with AVWAP * Mean Reversion: When the histogram reaches the P85 Zone , the price is "statistically overextended." This is a prime area to look for reversals or to take profits on existing trends. * Trend Strength: If the histogram stays near the Zero Line while the price moves, the trend is supported by healthy volume. * Value Area: The Zero Line represents the Fair Value . Buying near the Zero Line during a bullish histogram (Green) offers a high-probability entry with low risk. --- 6. Technical Parameters * Asset Selection: A dropdown to switch between Crypto, Forex, and Indices. * Color Customization: User-defined colors for bullish and bearish sentiment. * Precision Control: 4-decimal precision for accurate tracking of thin-margin assets like Forex.Chỉ báo Pine Script®của AlchimistOfCrypto1150
Victoria Overlay - HTF 200 + VWAP + ATR Stop + MA TrioConsolidated road to minions Buy Setup: EMA1 crosses above SMA3. RSI confirms above 50. Volume increasing (confirming momentum). Candle closes above SMA1 base. Sell Setup: EMA1 crosses below SMA3. RSI drops below 50 or exits overbought. Volume confirms (declining or reversing). Candle closes below SMA1 base. Tips: Think of EMA1 as the scalper’s trigger. SMA3 is your momentum check. SMA1 (base) = short-term bias. Avoid entries during low-volume chop. Use for day trades or tight scalps; exits happen fast. Overlay (Smoothed Heikin Ashi + Swing + VWAP + ATR Stop + 200-SMA) Purpose: Multi-layer trend confirmation + clean structure. Type: Swing alignment tool. 🟩 BUY / CALL Conditions Green “Buy (Gated)” arrow appears. Price is above VWAP, above 200-SMA, and above ATR stop. ATR stop (green line) sits under price → support confirmed. Heikin-Ashi candles are green/lime. Bias label says “Above VWAP | Above 200 | Swing Up”. 🟥 SELL / PUT Conditions Red “Sell (Gated)” arrow appears. Price is below VWAP, below 200-SMA, and below ATR stop. ATR stop (red line) sits above price → resistance confirmed. Heikin-Ashi candles are red. Bias label says “Below VWAP | Below 200 | Swing Down”. Exit / Risk Control: Close position when price crosses ATR stop. If Heikin candles flip color, momentum is reversing. Best Use Cases: For next-day or multi-hour swing entries. Use ATR Stop for dynamic stop loss. Stay out when the bias label is mixed (e.g. “Above VWAP | Below 200 | Swing Down”). Pro Tip: On big news days, let VWAP reset post-open before acting on arrows — filters fake signals. RSI Panel Pro (v6) Purpose: Strength + exhaustion confirmation. Type: Momentum filter. Key Levels: Overbought: 80+ → take profits soon. Oversold: 20– → watch for bounce setups. Bull regime: RSI above 60 = momentum strong. Bear regime: RSI below 40 = weakness. Buy / Entry Signals: RSI crosses up from below 40 or 20. RSI line is above RSI-EMA (gray line). Higher timeframe RSI (if used) is also rising. Trim / Exit: RSI drops under 60 after being strong. RSI crosses below its EMA. Sell / Put Setup: RSI fails at 60 or drops below 40. RSI crosses under EMA after a bounce. Tips: Pair RSI panel with Victoria Overlay — only take gated buys when RSI confirms. RSI < 40 but above 20 = “loading zone” for reversals. RSI > 70 = overextended → wait for confirmation before entering. Combined Execution Rules Goal What to Watch Action Entry (CALL) EMA1 > SMA3, Buy (Gated) arrow, RSI rising > 50 Buy call / open long Entry (PUT) EMA1 < SMA3, Sell (Gated) arrow, RSI < 50 Buy put / open short Exit Early Price crosses ATR stop or RSI flips under EMA Exit trade / protect gains Trend Filter VWAP + 200-SMA alignment Only trade in that direction Avoid Trades Conflicting bias label or low volume Stay flat Pro Tips VWAP → Intraday mean: above = bullish control, below = bearish control. ATR Stop → Dynamic trailing stop: never widen it manually. Smoothed Heikin-Ashi → filters noise: trend stays until color flips twice. RSI Panel → confirms whether to hold through pullbacks. If RSI and Overlay disagree — wait, not trade. Chỉ báo Pine Script®của selectingocean542
Institutional Orderflow Pro — VWAP, Delta, and Liquidity Institutional Orderflow Pro is a next-generation order flow analysis indicator designed to help traders identify institutional participation, directional bias, and exhaustion zones in real time. Unlike traditional volume-based indicators, it merges VWAP dynamics, cumulative delta, relative volume, and liquidity proximity into a single unified dashboard that updates tick-by-tick — without repainting. The indicator is open-source, transparent, and educational. It aims to provide traders with a clearer read on who controls the market — buyers or sellers — and where liquidity lies. The indicator combines multiple institutional-grade analytics into one framework: RVOL (Relative Volume) = Compares current volume against the average of recent bars to identify strong institutional participation. zΔ (Delta Z-Score) = Normalizes the buying/selling delta to reveal unusually aggressive market behavior. CVDΔ (Cumulative Volume Delta Change) = Shows which side (buyers/sellers) is dominating this bar’s order flow. VWAP Direction & Slope = Determines whether price is trading above/below VWAP and whether VWAP is trending or flat. PD Distance (Prev Day Confluence) = Measures the current price’s distance from previous day’s high, low, close, and VWAP in ATR units — highlighting liquidity zones. ABS/EXH Detection = Identifies institutional absorption and exhaustion patterns where momentum may reverse. Bias Computation = Combines VWAP direction + slope to give a simplified regime signal: UP, DOWN, or FLAT. All metrics are displayed through a color-coded, non-repainting HUD: 🟢 = bullish / favorable conditions 🔴 = bearish / weak conditions ⚫ = neutral / flat 🟡 = absorption (potential trap zone) 🟠 = exhaustion (momentum fading) | Metric | Signal | Meaning | | ---------------------- | ------- | ---------------------------------------------- | | **RVOL ≥ 1.3** | 🟢 | High institutional activity — valid setup zone | | **zΔ ≥ 1.2 / ≤ -1.2** | 🟢 / 🔴 | Unusual buy/sell aggression | | **CVDΔ > 0** | 🟢 | Buyers dominate this bar | | **VWAP dir ↑ / ↓** | 🟢 / 🔴 | Institutional bias long/short | | **Slope ok = YES** | 🟢 | Trending market | | **PD dist ≤ 0.35 ATR** | 🟢 | Near key liquidity zones | | **Bias = UP/DOWN** | 🟢 / 🔴 | Trend-aligned environment | | **ABS/EXH active** | 🟡 / 🟠 | Caution — possible reversal zone | How to Use Confirm Volume Context → RVOL > 1.2 Align with Bias → Take longs only when Bias = UP, shorts only when Bias = DOWN. Check Slope and VWAP Dir → Ensure trending context (Slope = YES). Confirm CVD and zΔ → Flow should agree with price direction. Avoid ABS/EXH Triggers → These signal exhaustion or absorption by large players. Enter Near PD Zones → Ideal trade zones are within 0.35 ATR of prior-day levels. This multi-factor confirmation reduces noise and focuses only on high-probability institutional setups. Originality This script was written from scratch in Pine v6. It does not reuse existing public indicators except for standard built-ins (ta.vwap, ta.atr, etc.). The unique combination of delta z-scoring, VWAP slope filtering, and real-time confluence zones distinguishes it from typical orderflow tools or cumulative delta overlays. The core innovation is its merged real-time HUD that integrates institutional metrics and natural-language feedback directly on the chart, allowing traders to read market context intuitively rather than decode multiple subplots. Notes & Disclaimers This indicator does not repaint. It’s intended for educational and analytical purposes only — not as financial advice or a guaranteed signal system. Works best on liquid instruments (Futures, Indices, FX majors). Avoid non-standard chart types (Heikin Ashi, Renko, etc.) for accurate readings. Open-source, modifiable, and compatible with Pine v6. Recommended Use Apply it with clean charts and standard candles for the best clarity. Use alongside a basic structure or volume profile to contextualize institutional bias zones. Author: Dhawal Ranka Category - Orderflow / VWAP / Institutional Analysis Version: Pine Script™ v6 License: Open Source (Educational Use) Chỉ báo Pine Script®của thewallrankaCập nhật 1313693
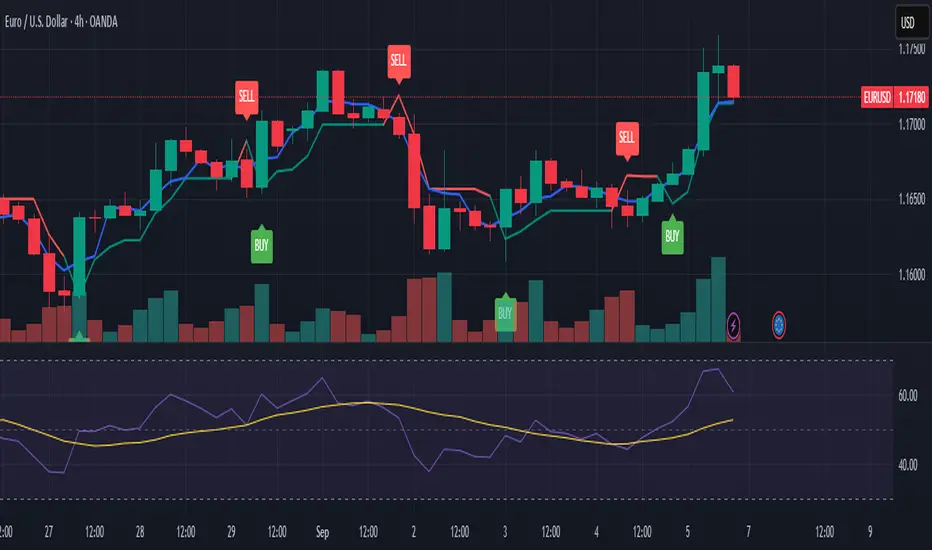
SAP121212 — Close vs VWAP + Optional RSI (Signals)This indicator combines Supertrend, VWAP with bands, and an optional RSI filter to generate Buy/Sell signals. How it works Supertrend Flip (ATR-based): Detects when trend direction changes (from bearish to bullish, or bullish to bearish). VWAP Band Filter: Signals only trigger if the candle close is beyond the VWAP bands: Buy = Supertrend flips up AND close > VWAP Upper Band Sell = Supertrend flips down AND close < VWAP Lower Band Optional RSI Filter: Buy requires RSI < 20 Sell requires RSI > 80 Can be enabled/disabled in settings. Features Choice of VWAP band calculation mode: Standard Deviation or ATR. Adjustable ATR/StDev length and multiplier for VWAP bands. Toggle Supertrend, VWAP lines, and Buy/Sell labels. Alerts included: add alerts on BUY or SELL conditions (use Once Per Bar Close to avoid intrabar signals). Use Works best on intraday or higher timeframes where VWAP is relevant. Use the RSI filter for more selective signals. Can be combined with your own stop-loss and risk management rules. ⚠️ Disclaimer: This script is for educational and research purposes only. It is not financial advice. Always test thoroughly and trade at your own risk.Chỉ báo Pine Script®của InvestingIsBoring65
NY Anchored VWAP and Auto SMANY Anchored VWAP and Auto SMA This script is a versatile trading indicator for the TradingView platform that combines two powerful components: a New York-anchored Volume-Weighted Average Price (VWAP) and a dynamic Simple Moving Average (SMA). Designed for traders who utilize VWAP for intraday trend analysis, this tool provides a clear visual representation of average price and volatility-adjusted moving averages, generating automated alerts for key crossover signals. Indicator Components 1. NY Anchored VWAP The VWAP is a crucial tool that represents the average price of a security adjusted for volume. This version is "anchored" to the start of the New York trading session, resetting at the beginning of each new session. This provides a clean, session-specific anchor point to gauge market sentiment and trend. The VWAP line changes color to reflect its slope: Green: When the VWAP is trending upwards, indicating a bullish bias. Red: When the VWAP is trending downwards, indicating a bearish bias. 2. Auto SMA The Auto SMA is a moving average with a unique twist: its lookback period is not fixed. Instead, it dynamically adjusts based on market volatility. The script measures volatility using the Average True Range (ATR) and a Z-Score calculation. When volatility is expanding, the SMA's length shortens, making it more sensitive to recent price changes. When volatility is contracting, the SMA's length lengthens, smoothing out the price action to filter out noise. This adaptive approach allows the SMA to react appropriately to different market conditions. Suggested Trading Strategy This indicator is particularly effective when used on a one-minute chart for identifying high-probability trade entries. The core of the strategy is to trade the crossover between the VWAP and the Auto SMA, with confirmation from a candle close. The strategy works best when the entry signal aligns with the overall bias of the higher timeframe market structure. For example, if the daily or 4-hour chart is in an uptrend, you would look for bullish signals on the one-minute chart. Bullish Entry Signal: A potential entry is signaled when the VWAP crosses above the Auto SMA, and is confirmed when the one-minute candle closes above both the VWAP and the SMA. This indicates a potential continuation of the bullish momentum. Bearish Entry Signal: A potential entry is signaled when the VWAP crosses below the Auto SMA, and is confirmed when the one-minute candle closes below both the VWAP and the SMA. This indicates a potential continuation of the bearish momentum. The built-in alerts for these crossovers allow you to receive notifications without having to constantly monitor the charts, ensuring you don't miss a potential setup.Chỉ báo Pine Script®của immediatePerso447731143
Smart MTF S/R Levels[BullByte] Smart MTF S/R Levels Introduction & Motivation Support and Resistance (S/R) levels are the backbone of technical analysis. However, most traders face two major challenges: Manual S/R Marking: Drawing S/R levels by hand is time-consuming, subjective, and often inconsistent. Multi-Timeframe Blind Spots: Key S/R levels from higher or lower timeframes are often missed, leading to surprise reversals or missed opportunities. Smart MTF S/R Levels was created to solve these problems. It is a fully automated, multi-timeframe, multi-method S/R detection and visualization tool, designed to give traders a complete, objective, and actionable view of the market’s most important price zones. What Makes This Indicator Unique? Multi-Timeframe Analysis: Simultaneously analyzes up to three user-selected timeframes, ensuring you never miss a critical S/R level from any timeframe. Multi-Method Confluence: Integrates several respected S/R detection methods—Swings, Pivots, Fibonacci, Order Blocks, and Volume Profile—into a single, unified system. Zone Clustering: Automatically merges nearby levels into “zones” to reduce clutter and highlight areas of true market consensus. Confluence Scoring: Each zone is scored by the number of methods and timeframes in agreement, helping you instantly spot the most significant S/R areas. Reaction Counting: Tracks how many times price has recently interacted with each zone, providing a real-world measure of its importance. Customizable Dashboard: A real-time, on-chart table summarizes all key S/R zones, their origins, confluence, and proximity to price. Smart Alerts: Get notified when price approaches high-confluence zones, so you never miss a critical trading opportunity. Why Should a Trader Use This? Objectivity: Removes subjectivity from S/R analysis by using algorithmic detection and clustering. Efficiency: Saves hours of manual charting and reduces analysis fatigue. Comprehensiveness: Ensures you are always aware of the most relevant S/R zones, regardless of your trading timeframe. Actionability: The dashboard and alerts make it easy to act on the most important levels, improving trade timing and risk management. Adaptability: Works for all asset classes (stocks, forex, crypto, futures) and all trading styles (scalping, swing, position). The Gap This Indicator Fills Most S/R indicators focus on a single method or timeframe, leading to incomplete analysis. Manual S/R marking is error-prone and inconsistent. This indicator fills the gap by: Automating S/R detection across multiple timeframes and methods Objectively scoring and ranking zones by confluence and reaction Presenting all this information in a clear, actionable dashboard How Does It Work? (Technical Logic) 1. Level Detection For each selected timeframe, the script detects S/R levels using: SW (Swing High/Low): Recent price pivots where reversals occurred. Pivot: Classic floor trader pivots (P, S1, R1). Fib (Fibonacci): Key retracement levels (0.236, 0.382, 0.5, 0.618, 0.786) over the last 50 bars. Bull OB / Bear OB: Institutional price zones based on bullish/bearish engulfing patterns. VWAP / POC: Volume Weighted Average Price and Point of Control over the last 50 bars. 2. Level Clustering Levels within a user-defined % distance are merged into a single “zone.” Each zone records which methods and timeframes contributed to it. 3. Confluence & Reaction Scoring Confluence: The number of unique methods/timeframes in agreement for a zone. Reactions: The number of times price has touched or reversed at the zone in the recent past (user-defined lookback). 4. Filtering & Sorting Only zones within a user-defined % of the current price are shown (to focus on actionable areas). Zones can be sorted by confluence, reaction count, or proximity to price. 5. Visualization Zones: Shaded boxes on the chart (green for support, red for resistance, blue for mixed). Lines: Mark the exact level of each zone. Labels: Show level, methods by timeframe (e.g., 15m (3 SW), 30m (1 VWAP)), and (if applicable) Fibonacci ratios. Dashboard Table: Lists all nearby zones with full details. 6. Alerts Optional alerts trigger when price approaches a zone with confluence above a user-set threshold. Inputs & Customization (Explained for All Users) Show Timeframe 1/2/3: Enable/disable analysis for each timeframe (e.g., 15m, 30m, 1h). Show Swings/Pivots/Fibonacci/Order Blocks/Volume Profile: Select which S/R methods to include. Show levels within X% of price: Only display zones near the current price (default: 3%). How many swing highs/lows to show: Number of recent swings to include (default: 3). Cluster levels within X%: Merge levels close together into a single zone (default: 0.25%). Show Top N Zones: Limit the number of zones displayed (default: 8). Bars to check for reactions: How far back to count price reactions (default: 100). Sort Zones By: Choose how to rank zones in the dashboard (Confluence, Reactions, Distance). Alert if Confluence >=: Set the minimum confluence score for alerts (default: 3). Zone Box Width/Line Length/Label Offset: Control the appearance of zones and labels. Dashboard Size/Location: Customize the dashboard table. How to Read the Output Shaded Boxes: Represent S/R zones. The color indicates type (green = support, red = resistance, blue = mixed). Lines: Mark the precise level of each zone. Labels: Show the level, methods by timeframe (e.g., 15m (3 SW), 30m (1 VWAP)), and (if applicable) Fibonacci ratios. Dashboard Table: Columns include: Level: Price of the zone Methods (by TF): Which S/R methods and how many, per timeframe (see abbreviation key below) Type: Support, Resistance, or Mixed Confl.: Confluence score (higher = more significant) React.: Number of recent price reactions Dist %: Distance from current price (in %) Abbreviations Used SW = Swing High/Low (recent price pivots where reversals occurred) Fib = Fibonacci Level (key retracement levels such as 0.236, 0.382, 0.5, 0.618, 0.786) VWAP = Volume Weighted Average Price (price level weighted by volume) POC = Point of Control (price level with the highest traded volume) Bull OB = Bullish Order Block (institutional support zone from bullish price action) Bear OB = Bearish Order Block (institutional resistance zone from bearish price action) Pivot = Pivot Point (classic floor trader pivots: P, S1, R1) These abbreviations appear in the dashboard and chart labels for clarity. Example: How to Read the Dashboard and Labels (from the chart above) Suppose you are trading BTCUSDT on a 15-minute chart. The dashboard at the top right shows several S/R zones, each with a breakdown of which timeframes and methods contributed to their detection: Resistance zone at 119257.11: The dashboard shows: 5m (1 SW), 15m (2 SW), 1h (3 SW) This means the level 119257.11 was identified as a resistance zone by one swing high (SW) on the 5-minute timeframe, two swing highs on the 15-minute timeframe, and three swing highs on the 1-hour timeframe. The confluence score is 6 (total number of method/timeframe hits), and there has been 1 recent price reaction at this level. This suggests 119257.11 is a strong resistance zone, confirmed by multiple swing highs across all selected timeframes. Mixed zone at 118767.97: The dashboard shows: 5m (2 SW), 15m (2 SW) This means the level 118767.97 was identified by two swing points on both the 5-minute and 15-minute timeframes. The confluence score is 4, and there have been 19 recent price reactions at this level, indicating it is a highly reactive zone. Support zone at 117411.35: The dashboard shows: 5m (2 SW), 1h (2 SW) This means the level 117411.35 was identified as a support zone by two swing lows on the 5-minute timeframe and two swing lows on the 1-hour timeframe. The confluence score is 4, and there have been 2 recent price reactions at this level. Mixed zone at 118291.45: The dashboard shows: 15m (1 SW, 1 VWAP), 5m (1 VWAP), 1h (1 VWAP) This means the level 118291.45 was identified by a swing and VWAP on the 15-minute timeframe, and by VWAP on both the 5-minute and 1-hour timeframes. The confluence score is 4, and there have been 12 recent price reactions at this level. Support zone at 117103.10: The dashboard shows: 15m (1 SW), 1h (1 SW) This means the level 117103.10 was identified by a single swing low on both the 15-minute and 1-hour timeframes. The confluence score is 2, and there have been no recent price reactions at this level. Resistance zone at 117899.33: The dashboard shows: 5m (1 SW) This means the level 117899.33 was identified by a single swing high on the 5-minute timeframe. The confluence score is 1, and there have been no recent price reactions at this level. How to use this: Zones with higher confluence (more methods and timeframes in agreement) and more recent reactions are generally more significant. For example, the resistance at 119257.11 is much stronger than the resistance at 117899.33, and the mixed zone at 118767.97 has shown the most recent price reactions, making it a key area to watch for potential reversals or breakouts. Tip: “SW” stands for Swing High/Low, and “VWAP” stands for Volume Weighted Average Price. The format 15m (2 SW) means two swing points were detected on the 15-minute timeframe. Best Practices & Recommendations Use with Other Tools: This indicator is most powerful when combined with your own price action analysis and risk management. Adjust Settings: Experiment with timeframes, clustering, and methods to suit your trading style and the asset’s volatility. Watch for High Confluence: Zones with higher confluence and more reactions are generally more significant. Limitations No Future Prediction: The indicator does not predict future price movement; it highlights areas where price is statistically more likely to react. Not a Standalone System: Should be used as part of a broader trading plan. Historical Data: Reaction counts are based on historical price action and may not always repeat. Disclaimer This indicator is a technical analysis tool and does not constitute financial advice or a recommendation to buy or sell any asset. Trading involves risk, and past performance is not indicative of future results. Always use proper risk management and consult a financial advisor if needed. Chỉ báo Pine Script®của BullByteCập nhật 1414830
Triple Configurable VWAPTriple Configurable VWAP Indicator This advanced VWAP (Volume Weighted Average Price) indicator displays three independently configurable VWAP lines on your chart, providing multiple timeframe perspectives for better trading decisions. Key Features: • Three Customizable VWAP Periods: Configure each VWAP independently with periods ranging from 1 to 365 days Default: 10-day (Green), 30-day (Red), 365-day (Blue) • Dynamic Visual Elements: Color-coded lines for easy identification Smart labels at the current price level with matching colors Contrasting text colors for optimal readability • Interactive Information Table: Toggle on/off display Repositionable to any corner or side of the chart Shows each VWAP period with corresponding color indicators Larger, easy-to-read font size • Professional Calculation Method: Uses daily timeframe data for accurate VWAP calculations Anchored VWAP starting from your specified lookback periods Proper volume weighting for institutional-grade accuracy Use Cases: Short-term Trading: 10-day VWAP for recent price action analysis Medium-term Analysis: 30-day VWAP for monthly trend assessment Long-term Perspective: 365-day VWAP for yearly institutional levels Perfect for traders who need multiple VWAP timeframes simultaneously to identify key support/resistance levels, trend direction, and institutional price points across different time horizons.Chỉ báo Pine Script®của taika808Cập nhật 26
[Smith] VWAP Deviation + VWAP Deviation + Short Description: Advanced VWAP indicator with deviation bands, smart signal filtering, and session-based performance tracking. Features log-space scaling, RSI confirmation, volume filters, and market regime detection. Full Description: The VWAP Deviation + is a comprehensive trading indicator that combines Volume Weighted Average Price (VWAP) analysis with advanced signal filtering to identify high-probability trade opportunities. This indicator goes beyond basic VWAP by incorporating multiple confirmation layers and intelligent market analysis. 🎯 Key Features Core VWAP Analysis: - Custom volume-weighted mean calculation with deviation bands (2σ and 3σ) - Optional log-space scaling for proportional price movements - Real-time VWAP line with customizable visibility Smart Signal Detection: - RSI confirmation for all trade signals - Volume filter requiring above-average trading activity - Market regime detection (trending vs ranging markets) - Optional RSI divergence analysis Advanced Filtering: - Multi-condition signal validation - Session-based performance tracking (Asian, London, NY) - Real-time win rate calculation - Strong vs regular signal classification Visual Features: - Clean, professional interface with customizable colors - Optional signal shapes and annotations - Performance statistics table - Filled deviation bands for easy visualization 📊 How It Works The indicator identifies trade opportunities when: 1. Price touches VWAP deviation bands (2σ or 3σ) 2. RSI confirms oversold/overbought conditions 3. Volume exceeds the specified threshold 4. Market regime conditions are favorable Signal Types: - LONG : Price at lower bands + RSI oversold + volume confirmation - SHORT : Price at upper bands + RSI overbought + volume confirmation - STRONG : Same conditions but at 3σ bands for higher conviction trades ⚙️ Customization Options Core Settings: - VWAP length and source selection - Adjustable deviation multipliers - Log-space scaling toggle Signal Filters: - RSI length and threshold levels - Volume filter with customizable multiplier - Market type filtering options Advanced Features: - Session statistics tracking - RSI divergence detection - Market regime analysis Visual Controls: - Show/hide individual components - Custom color schemes - Signal display toggles 🔔 Alert System Built-in alerts for: - Long and short trade opportunities - Strong signal confirmations - RSI divergence signals 💡 Best Practices - Use higher timeframes (15m+) for more reliable signals - Combine with additional confirmation indicators - Pay attention to session statistics for timing optimization - Monitor market regime indicators for context This indicator is suitable for day traders, swing traders, and anyone looking to improve their VWAP-based trading strategies with advanced filtering and market analysis. Chỉ báo Pine Script®của SmithTradesBitcoinCập nhật 44653
RVMM IndicatorRVMM Indicator RVMM Indicator combines four indicators: RSI, VWAP, MFI, and Momentum to provide comprehensive technical analysis. This indicator helps traders identify potential market conditions based on the interaction of these indicators. Components of the RVMM Indicator 1. RSI (Relative Strength Index) RSI is a momentum indicator that measures the speed and change of price movements. RSI oscillates between 0 and 100 and is used to identify overbought and oversold conditions in the market. Buy Level: Set at 30. When RSI falls below 30, the market is considered oversold, which may suggest a potential upward trend reversal. Sell Level: Set at 70. When RSI rises above 70, the market is considered overbought, which may suggest a potential downward trend reversal. 2. VWAP (Volume Weighted Average Price) VWAP is an indicator that combines price and volume to calculate the average price weighted by volume. VWAP is used to identify support and resistance areas and assess the strength of price movements. Interpretation: If the price is above the VWAP line, the market is likely in an uptrend. If the price is below the VWAP line, the market is in a downtrend. 3. MFI (Money Flow Index) MFI is a momentum indicator that considers both price and volume. MFI oscillates between 0 and 100 and is used to identify overbought and oversold conditions in the market. Oversold Level: Set at 20. When MFI falls below 20, the market is considered oversold. Overbought Level: Set at 80. When MFI rises above 80, the market is considered overbought. 4. Momentum Momentum is an indicator that measures the speed of price changes. This indicator is used to identify the strength of a trend. Interpretation: High momentum values indicate a strong uptrend, while low momentum values indicate a strong downtrend. How to Use the RVMM Indicator Interpreting Market Conditions: RSI : Check RSI values below 30 to identify oversold conditions, and above 70 to identify overbought conditions. VWAP : Observe whether the price is above or below the VWAP line to determine if the market is in an uptrend or downtrend. MFI : Check if MFI is below 20 to identify oversold conditions, and above 80 to identify overbought conditions. Momentum : Analyze momentum values to gauge the strength of the current trend. Confirming Market Conditions: Use VWAP, MFI, and Momentum to confirm market conditions identified by RSI. If the price is above the VWAP line, and MFI and Momentum indicate the strength of the uptrend, the market may be in a bullish phase. If the price is below the VWAP line, and MFI and Momentum indicate the strength of the downtrend, the market may be in a bearish phase. Risk Management: Set stop-loss and take-profit levels based on technical analysis and your trading preferences. Monitor the market and adjust stop-loss and take-profit levels as market conditions change. Example of Application Here is an example of how to use the RVMM Indicator in practice: Bullish Phase: When the price is above the VWAP line, RSI is below 30, and MFI and Momentum indicate the strength of the uptrend, the market is likely in a bullish phase. Bearish Phase: When the price is below the VWAP line, RSI is above 70, and MFI and Momentum indicate the strength of the downtrend, the market is likely in a bearish phase.Chỉ báo Pine Script®của cryptosada38
RSI from Rolling VWAP [CHE]Introducing the RSI from Rolling VWAP Indicator Elevate your trading strategy with the RSI from Rolling VWAP —a cutting-edge indicator designed to provide unparalleled insights and enhance your decision-making on TradingView. This advanced tool seamlessly integrates the Relative Strength Index (RSI) with a Rolling Volume-Weighted Average Price (VWAP) to deliver precise and actionable trading signals. Why Choose RSI from Rolling VWAP ? - Clear Trend Detection: Our enhanced algorithms ensure accurate identification of bullish and bearish trends, allowing you to capitalize on market movements with confidence. - Customizable Time Settings: Tailor the time window in days, hours, and minutes to align perfectly with your unique trading strategy and market conditions. - Flexible Moving Averages: Select from a variety of moving average types—including SMA, EMA, WMA, and more—to smooth the RSI, providing clearer trend analysis and reducing market noise. - Threshold Alerts: Define upper and lower RSI thresholds to effortlessly spot overbought or oversold conditions, enabling timely and informed trading decisions. - Visual Enhancements: Enjoy a visually intuitive interface with color-coded RSI lines, moving averages, and background fills that make interpreting market data straightforward and efficient. - Automatic Signal Labels: Receive immediate bullish and bearish labels directly on your chart, signaling potential trading opportunities without the need for constant monitoring. Key Features - Inspired by Proven Tools: Building upon the robust foundation of TradingView's Rolling VWAP, our indicator offers enhanced functionality and greater precision. - Volume-Weighted Insights: By incorporating volume into the VWAP calculation, gain a deeper understanding of price movements and market strength. - User-Friendly Configuration: Easily adjust settings to match your trading preferences, whether you're a novice trader or an experienced professional. - Hypothesis-Driven Analysis: Utilize hypothetical results to backtest strategies, understanding that past performance does not guarantee future outcomes. How It Works 1. Data Integration: Utilizes the `hlc3` (average of high, low, and close) as the default data source, with customization options available to suit your trading needs. 2. Dynamic Time Window: Automatically calculates the optimal time window based on an auto timeframe or allows for fixed time periods, ensuring flexibility and adaptability. 3. Rolling VWAP Calculation: Accurately computes the Rolling VWAP by balancing price and volume over the specified time window, providing a reliable benchmark for price action. 4. RSI Analysis: Measures momentum through RSI based on Rolling VWAP changes, smoothed with your chosen moving average for enhanced trend clarity. 5. Actionable Signals: Detects and labels bullish and bearish conditions when RSI crosses predefined thresholds, offering clear indicators for potential market entries and exits. Seamless Integration with Your TradingView Experience Adding the RSI from Rolling VWAP to your TradingView charts is straightforward: 1. Add to Chart: Simply copy the Pine Script code into TradingView's Pine Editor and apply it to your desired chart. 2. Customize Settings: Adjust the Source Settings, Time Settings, RSI Settings, MA Settings, and Color Settings to align with your trading strategy. 3. Monitor Signals: Watch for RSI crossings above or below your set thresholds, accompanied by clear labels indicating bullish or bearish trends. 4. Optimize Your Trades: Leverage the visual and analytical strengths of the indicator to make informed buy or sell decisions, maximizing your trading potential. Disclaimer: The content provided, including all code and materials, is strictly for educational and informational purposes only. It is not intended as, and should not be interpreted as, financial advice, a recommendation to buy or sell any financial instrument, or an offer of any financial product or service. All strategies, tools, and examples discussed are provided for illustrative purposes to demonstrate coding techniques and the functionality of Pine Script within a trading context. Any results from strategies or tools provided are hypothetical, and past performance is not indicative of future results. Trading and investing involve high risk, including the potential loss of principal, and may not be suitable for all individuals. Before making any trading decisions, please consult with a qualified financial professional to understand the risks involved. By using this script, you acknowledge and agree that any trading decisions are made solely at your discretion and risk. Get Started Today Transform your trading approach with the RSI from Rolling VWAP indicator. Experience the synergy of momentum and volume-based analysis, and unlock the potential for more accurate and profitable trades. Download now and take the first step towards a more informed and strategic trading journey! For further inquiries or support, feel free to contact Best regards Chervolino Inspired by the acclaimed Rolling VWAP by TradingView Chỉ báo Pine Script®của chervolino33221