Tìm kiếm tập lệnh với "Volatility"

VolatilityVolatility - The amount of price deviation in the specified time interval.
The calculation is made from the opening point to the closing point, and the maximum and minimum deviation between them is also included. Any timeframes are supported.
Available information: the start date of the calculation (according to the time zone of the exchange), the current volatility from the initial opening point or from the last closing point, the total volatility for all periods.
An indicator of useful use in everyday work.
Thanks for your attention!


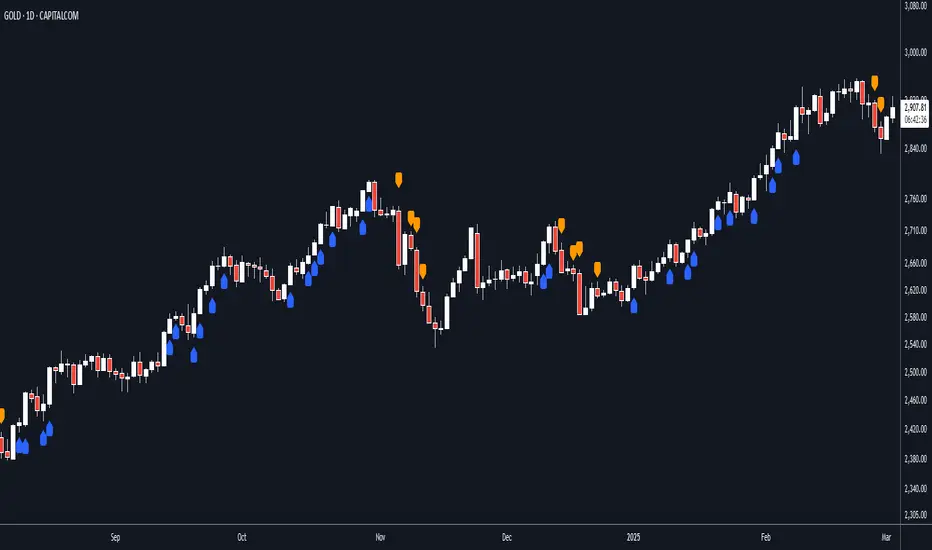
Volatility Tsunami RegimeVolatility Tsunami Regime
This indicator identifies periods of extreme volatility compression to help anticipate upcoming market expansions. It detects when volatility is unusually quiet, which historically precedes violent price moves.
The script pulls data from the CBOE VIX and VVIX indices regardless of the chart you are viewing. It calculates the standard deviation of both indices over a user-defined lookback period (default is 20). If the standard deviation drops below specific thresholds, the script flags the market regime as compressed.
The background color changes based on the severity of the compression. A red background signals a Double Compression, meaning both the VIX and VVIX are below their volatility thresholds. An orange background signals a Single Compression, meaning only one of the two indices has dropped below its threshold.
Use this tool to spot the "calm before the storm." When the background is red, volatility is statistically suppressed, making it a prime time to look for breakouts or buy options while premiums are cheap. Conversely, it serves as a warning to tighten stops if you are short volatility.

Volatility Forecast/*==============================================================================
Volatility Forecast — Publishable Documentation
Author: @BB_9791
License: Mozilla Public License 2.0
WHAT THIS INDICATOR SHOWS
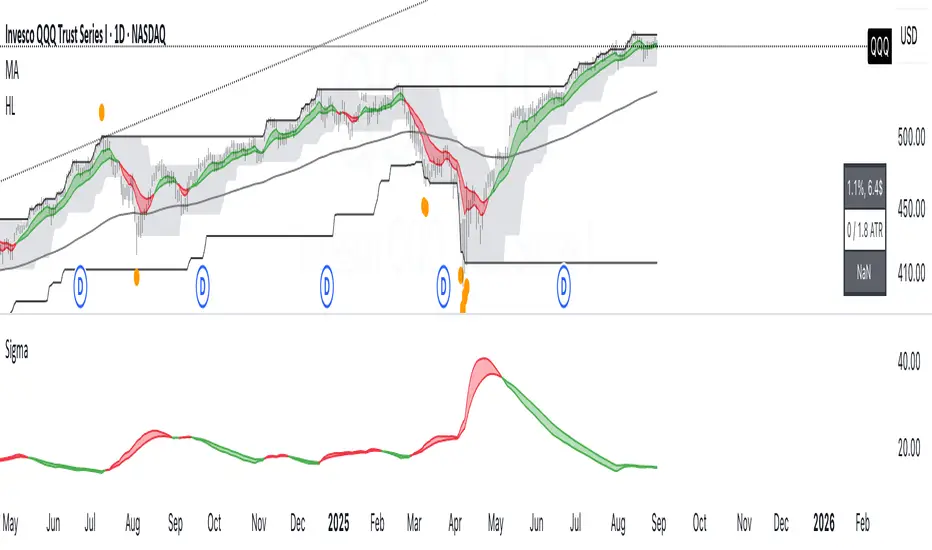
- A daily volatility estimate in percent points, called sigma_day.
- A slow volatility anchor, the 10-year EMA of sigma_day.
- A blended volatility series in percent points:
sigma_blend = (1 − p) * sigma_day + p * EMA_10y(sigma_day)
where p is the Slow weight %, default 30.
- Optional annualization by multiplying by 16, this is a daily-to-annual
conversion used by Robert Carver in his writings.
METHODOLOGY, CREDIT
The estimator follows the approach popularized by Robert Carver
("Systematic Trading", "Advanced Futures Trading Strategies", blog qoppac).
Current daily volatility is computed as an exponentially weighted standard
deviation of daily percent returns, with alpha = 2 / (span + 1).
The slow leg is a long EMA of that volatility series, about 10 years.
The blend uses fixed weights. This keeps the slow leg meaningful through
large price level changes, since the blend is done in percent space first.
MATH DETAILS
Let r_t be daily percent return:
r_t = 100 * (Close_t / Close_{t−1} − 1)
EWMA mean and variance:
m_t = α * r_t + (1 − α) * m_{t−1}
v_t = α * (r_t − m_t)^2 + (1 − α) * v_{t−1}
where α = 2 / (span_current + 1)
Current daily sigma in percent points:
sigma_day = sqrt(v_t)
Slow leg:
sigma_10y = EMA(sigma_day, span_long)
Blend:
sigma_blend = (1 − p) * sigma_day + p * sigma_10y
Annualized option:
sigma_ann = 16 * sigma_blend
INPUTS
- Threshold (percent points): horizontal guide level on the chart.
- Short term span (days): EW stdev span for sigma_day.
- Long term span (days): EMA span for the slow leg, choose about 2500 for 10 years.
- Slow weight %: p in the blend.
- Annualize (x16): plot daily or annualized values.
- Show components: toggles Current and 10y EMA lines.
- The script uses the chart symbol by default.
PLOTS
- Blended σ% as the main line.
- Optional Current σ% and 10y EMA σ%.
- Editable horizontal threshold line in the same units as the plot
(percent points per day or per year).
- Optional EMA 9 and EMA 20 cloud on the blended series, green for uptrend
when EMA 9 is above EMA 20, red otherwise. Opacity is configurable.
HOW TO READ
- Values are percent points of movement per day when not annualized,
for example 1.2 means about 1.2% typical daily move.
- With annualize checked, values are percent points per year, for example 18
means about 18% annualized volatility.
- Use the threshold and the EMA cloud to mark high or low volatility regimes.
NOTES
- All calculations use daily data via request.security at the chart symbol.
- The blend is done in percent space, then optionally annualized, which avoids
bias from the price level.
- This script does not produce trading signals by itself, it is a risk and
regime indicator.
CREDITS
Volatility forecasting method and scaling convention credited to Robert Carver.
See his books and blog for background and parameter choices.
VERSION
v1.0 Initial public release.
==============================================================================*/


Volatility measurement indicator.Volatility measurement indicator. Helps to determine the volatility for Forex pairs

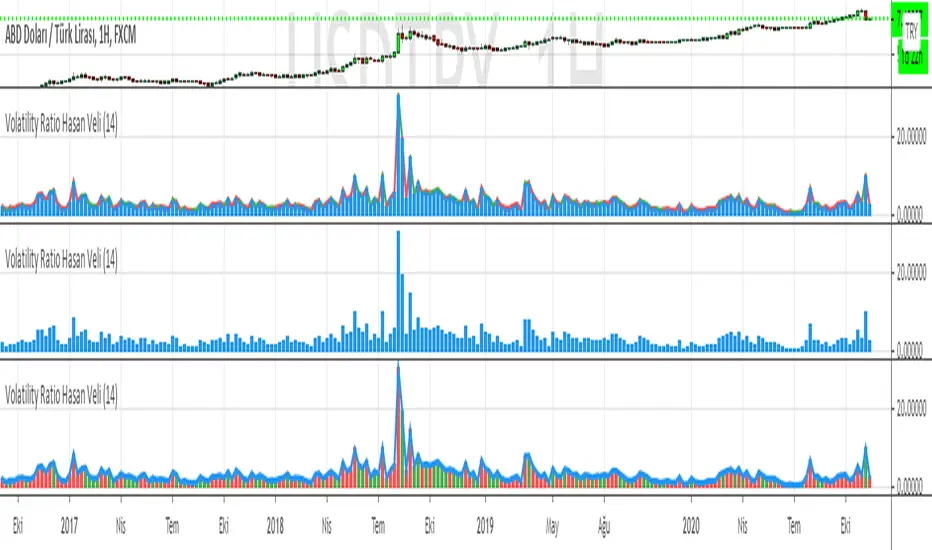
Volatility Hasan VeliVolatility of the price against ATR value. By comparing the ATR value, you can calculate the estimated move capacity of the price.
Please write your comments.
Kind regards from İstanbul, Turkey
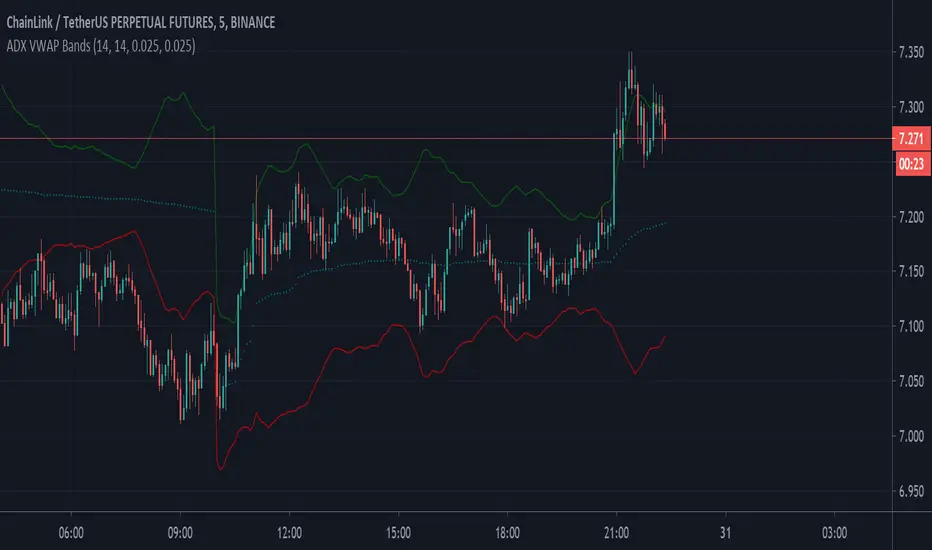
VOLATILITY Based VWAP Bands with Upper% and Lower% BandsVolatility based VWAP Bands with an Upper band x% higher than the normal VWAP and a Lower band x% lower.
The script uses ADX to create much better OVERBOUGHT and OVERSOLD regions.
- Settings Guide -
~ 0.01 in settings = 1% +/- VWAP
~ Step increment of 0.005 to make setting changes easier.


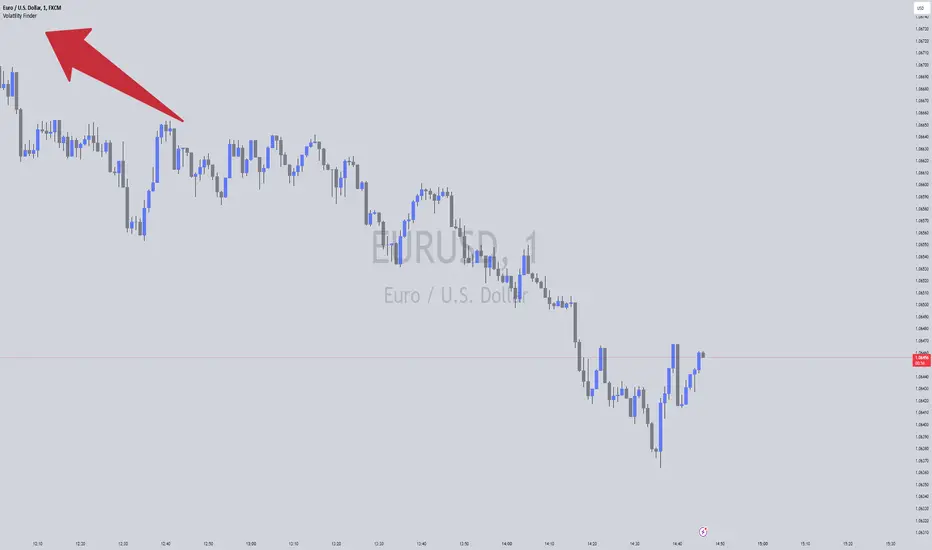
Volatility FinderVolatility Finder / Daily Range.
This indicator will measure the Average amount of Pips/Points movement of price, over an X amount of time.
This is often referred to as "Forex Volatility" Most pairs have different amounts of volatility. Exotics pairs are considered very volatile, Forex Majors is less volatile.
So this Indicator, will measure the amount of ADR/Average Daily Range.
Average amount of Pips/Points of movement, within a specific period of time, and tell you that.
- In the settings, you can choose how many days you want the indicator to measure from, and it will tell you the average amount of pips, based on the average movement on those days.
The Default setting is set to 90 days/3 months.
IMPORTANT:
To see the number the indicator tells you, you have to RIGHT-click up in the Left-side corner, where you see the Pair you have open on your Chart. And make sure to Enable "INDICATOR VALUES". Then if you However over the Indicator area, where the indicators you have open. You will see the number that the indicator has found. Based on the Settings you have set in the Settings Menu.
* One applicable way to use this information is if you are inside a trade, and price has moved past the Daily Range. It could be less probable it will continue in the same direction when it has Met the Daily Range.
* Another is to use this, to find pairs that you might want to trade. If the Average Price movement over the time you input, is High, you can use this information to help you decide if this pair is to Volatile for you to consider trading, or if it moving to slow for you.
It's very accurate, if you want to compare, you can go to 3rd party websites like
Mataf / mataf.net/en/forex/tools/volatility
Investing.com / investing.com/tools/forex-volatility-calculator

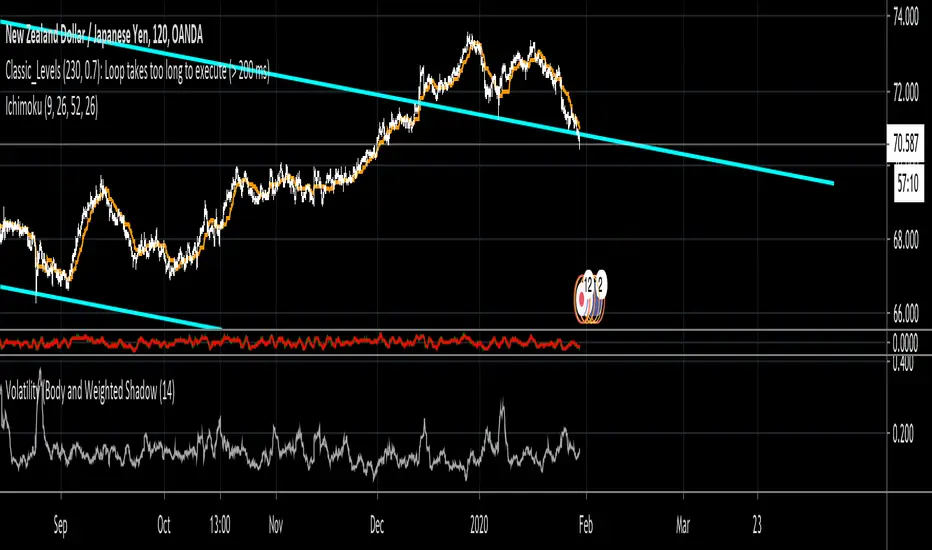
Volatility (Body and Weighted Shadow)- Volatility Indicator
- Replacement for ATR
- As each pair holds a different level of volatility, a stop loss can be set using this indicator rather than via a ratio 2:1, etc. e.g. 2 X Volatility Value = S/L...
- This indicator averages the bodies of candlesticks over a default length of 14 periods. It also considers the length of shadows via a weighted average. This is done as it is assumed that financial institutions tend to move price to levels that do not hold (shadows). Therefore, wick lengths are less significant than the candlestick bodies, so they are weighted to hold less value.
Volatility Spectrum - Whvntr"Volatility Spectrum" is a useful technical indicator crafted for traders who prioritize precision in volatility analysis. This tool revolutionizes the traditional Average True Range (ATR) concept by offering a nuanced, multi-faceted view of market volatility.
Key Features:
Enhanced Volatility Insights: Seamlessly integrates standard ATR with an average ATR for a more detailed volatility analysis.
Customizable Parameters: Users can tailor the ATR and average ATR lengths to align with various trading styles and timeframes.
Multiple Smoothing Techniques: Options like RMA, SMA, EMA, or WMA are available to customize the ATR's responsiveness.
Dynamic Color Indicators: Unique color gradients visually represent different levels of volatility, aiding in quick and effective analysis.
Configurable Volatility Alerts: Set up alerts for specific high or low volatility conditions to assist in making informed decisions.
Intuitive Backgrounds: The background color shifts in response to volatility levels, offering an instant read on market dynamics .
Personalized Color Settings: Customize the color scheme for high and low volatility indicators to fit personal preferences and trading dashboards.
When and Where to Use:
Diverse Market Application: Suitable for various markets, including stocks, forex, and commodities.
Strategy Enhancement: Integrates with trading strategies for improved risk management and optimized entry/exit points.
Adaptable for All Trading Styles: Effective for both short-term day trading and long-term investment approaches.
Informed Trading Decisions: Best used in conjunction with other indicators for a well-rounded approach to volatility-based trading.
"Volatility Spectrum" is an essential tool for traders looking to enrich their understanding of market volatility. Its adaptability and depth make it a valuable component in any trader's toolkit, suitable for a range of markets and trading strategies.
"While 'Volatility Spectrum' provides valuable insights into market volatility, its indications should not be interpreted as definitive predictions or guarantees of future market behavior."

Volatility vs ATRVolatility vs ATR Indicator Description for TradingView
Volatility vs ATR is a powerful custom indicator designed to help traders analyze and compare market volatility with the Average True Range (ATR). This indicator provides valuable insights into the dynamic behavior of asset prices, enabling traders to make informed decisions about market trends, potential reversals, and risk management.
What Does It Measure?
Volatility: Represents the degree of price variation over a given period. Calculated using standard deviation or other measures, it highlights periods of heightened or reduced market activity.
Average True Range (ATR): Measures the average range of price movement over a specific period, providing a sense of the asset's price fluctuations and market activity.
How It Works
The indicator plots both Volatility and ATR on the same chart, making it easy to visualize how these metrics interact.
Rising Volatility often signals increased market uncertainty or the beginning of strong trends.
ATR Spikes typically accompany high volatility, helping identify potential breakout or breakdown scenarios.
By tracking the interplay between these metrics, traders can anticipate shifts in momentum, recognize consolidation phases, and plan trades more effectively.
Key Features
Dual-Line Display: Clearly plots both Volatility (red) and ATR (blue) for easy comparison.
Customizable Periods: Allows you to adjust the lookback period for both metrics to match your trading style.
Versatile Application: Works across all asset classes, including stocks, forex, crypto, and commodities.
Why Use Volatility vs ATR?
Trend Analysis: Identify trending vs. ranging markets by observing the relationship between Volatility and ATR.
Breakout Confirmation: Use Volatility and ATR spikes as confirmation signals for potential breakouts.
Risk Management: Plan stop-loss levels and position sizing based on ATR values.
How to Use It
Add the indicator to your chart.
Look for periods where Volatility diverges from ATR to spot potential market shifts.
Use the indicator in conjunction with price action and other technical tools for a comprehensive analysis.
This indicator is ideal for traders looking to enhance their strategies by understanding market dynamics through the lens of volatility and average price movement.
Let me know if you’d like further refinement!


Volatility Based Momentum by QTX Algo SystemsVolatility Based Momentum by QTX Algo Systems
Overview
This indicator is designed to determine whether a market trend is genuinely supported by both momentum and volatility. It produces per-candle signals when a smoothed momentum oscillator is above its moving average, a Price – Moving Average Ratio confirms overall trend strength by remaining above a preset level with a positive slope, and when at least one of two distinct volatility metrics is rising. This integrated approach offers traders a consolidated and dynamic view of market energy, delivering more actionable insights than a simple merger of standard indicators.
How It Works
The indicator fuses two complementary volatility measures with dual momentum assessments to ensure robust signal generation. One volatility metric evaluates long-term market behavior by analyzing the dispersion of logarithmic price changes, while the other—derived from a Bollinger Band Width Percentile—captures recent price variability and confirms that market volatility remains above a minimum threshold. A trading signal is generated only when at least one of these volatility measures shows a sustained upward trend over several candles.
For momentum, a double‐smoothed Stochastic Momentum Index provides a refined, short-term view of price action, filtering out market noise. In addition, the PMARP serves as a confirmation tool by comparing the current price to its moving average, requiring that its value remains above a defined level with a positive slope to indicate a strong trend. Together, these elements ensure that a signal is only produced when both the market’s momentum and volatility are in alignment.
Although the components used are based on well-known technical analysis methods, the thoughtful integration of these elements creates a tool that is more than the sum of its parts. By combining long-term volatility assessment with a real-time measure of recent price variability—and by merging short-term momentum analysis with a confirmation of overall trend strength—the indicator delivers a more reliable and comprehensive view of market energy. This holistic approach distinguishes it from standard indicators.
How to Use
Traders can adjust the volatility threshold setting to tailor the indicator to their preferred market or timeframe. The indicator displays per-candle signals when both the refined momentum criteria and the dynamic volatility conditions are met. These signals are intended to be used as part of a broader trading strategy, in conjunction with other technical analysis tools for confirming entries and exits.
Disclaimer
This indicator is for educational purposes only and is intended to support your trading strategy. It does not guarantee performance, and past results are not indicative of future outcomes. Always use proper risk management and perform your own analysis before trading.
Volatility Based SMI with Dynamic Bands by QTX Algo SystemsVolatility Based SMI with Dynamic Bands by QTX Algo Systems
Overview
This advanced oscillator redefines the classic Stochastic Momentum Index (SMI) by incorporating adaptive volatility scaling and dynamically tilting its overbought and oversold levels based on market trends. The result is a context-sensitive momentum tool that adjusts its thresholds in real time, helping traders identify potential reversals or trend continuations more effectively.
How It Works
Enhanced SMI Calculation:
The indicator starts by computing a double‐smoothed SMI. Two layers of exponential moving averages—controlled by the “Smoothing K” and “Smoothing D” inputs—are applied to both the relative price range and the overall range (difference between the highest high and lowest low) over a fixed period. This process reduces short-term noise and isolates the underlying momentum.
Adaptive Volatility Scaling:
A normalized volatility measure is derived using a fixed Bollinger Band Width Percentile (BBWP) approach. This volatility metric is used to create an adaptive adjustment factor that scales the SMI, ensuring that the oscillator’s sensitivity reflects current market conditions without being distorted by temporary extremes.
Dynamic Threshold Adjustment:
The indicator then calculates trend strength using a lookback period (set by the “Trend Lookback Period” input) that compares the current price to a volume-weighted moving average (VWMA). This trend strength is used to adjust the base overbought and oversold levels (fixed at 50 and –50) through two mechanisms:
Band Tilt Strengths:
The “Upper Band Tilt Strength” and “Lower Band Tilt Strength” inputs determine how aggressively the respective thresholds are shifted in response to the prevailing trend. In an uptrend, for example, the oversold level is raised more noticeably, while in a downtrend, the overbought level is lowered.
Opposite Band Compression:
The “Opposite Band Compression Strength” input further refines this adjustment by accelerating the contraction of the opposite band during trend reversals, enhancing the indicator’s responsiveness.
How to Use and Input Adjustments
Smoothing K & Smoothing D:
Adjust these to control the degree of smoothing in the SMI calculation. Lower values provide quicker, albeit noisier, responses, while higher values yield smoother signals.
SMI EMA Length:
This sets the sensitivity of the moving average applied to the SMI, affecting how promptly crossover signals are generated.
Trend Lookback Period:
Defines the historical window for assessing trend strength. A longer period gives a more stable trend, while a shorter period increases responsiveness.
Upper/Lower Band Tilt Strength:
These parameters determine how much the overbought and oversold levels shift in response to the market’s trend. Increasing these values results in more pronounced threshold adjustments.
Opposite Band Compression Strength:
This setting influences how quickly the opposite band compresses during trend reversals, thereby fine-tuning the dynamic nature of the oscillator’s thresholds.
What Makes It Proprietary
Traditional SMI indicators typically rely on fixed thresholds for overbought and oversold conditions. Our approach is proprietary because it seamlessly integrates adaptive volatility scaling with dynamic, trend-based threshold adjustments. This fusion produces an oscillator that is acutely sensitive to current market conditions, offering a more nuanced and context-aware view of momentum that stands apart from conventional methods.
How to Use
Monitor the oscillator for crossovers between the SMI and its EMA, which serve as potential signals for reversals or confirmations of trend continuation. Fine-tune the input parameters to match your market conditions and trading style, and use the dynamically adjusted thresholds in conjunction with other technical analysis tools to refine your entry and exit decisions.
Disclaimer
This indicator is for educational purposes only and is intended to support your trading strategy. It does not guarantee performance, and past results are not indicative of future outcomes. Always use proper risk management and perform your own analysis before trading.

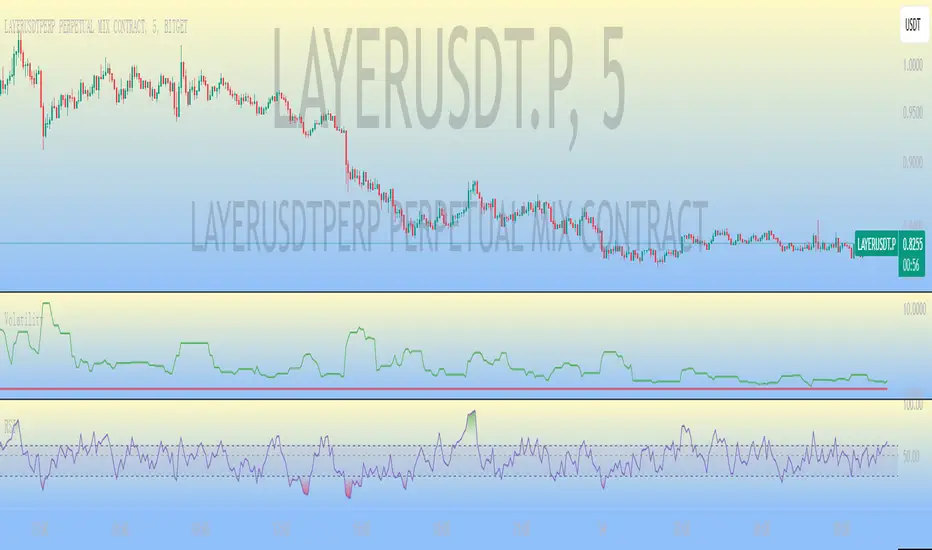
VolatilityThis is a filtering indicator Volatility in the CTA contract of BG Exchange. According to their introduction, it should be calculated using this simple method.
However, you may have seen the problem. According to the exchange's introduction, the threshold should still be divided by 100, which is in percentage form. The result I calculated, even if not divided by 100, still shows a significant difference, which may be due to the exchange's mistake. Smart netizens, do you know how the volatility of BG Exchange is calculated.
The official introduction of BG Exchange is as follows: Volatility (K, Fluctuation) is an additional indicator used to filter out positions triggered by CTA strategy signals in low volatility markets. Usage: Select the fluctuation range composed of the nearest K candlesticks, and choose the highest and lowest closing prices. Calculation: 100 * (highest closing price - lowest closing price) divided by the lowest closing price to obtain the recent amplitude. When the recent amplitude is greater than Fluctuation, it is considered that the current market volatility meets the requirements. When the CTA strategy's position building signal is triggered, position building can be executed. Otherwise, warehouse building cannot be executed.
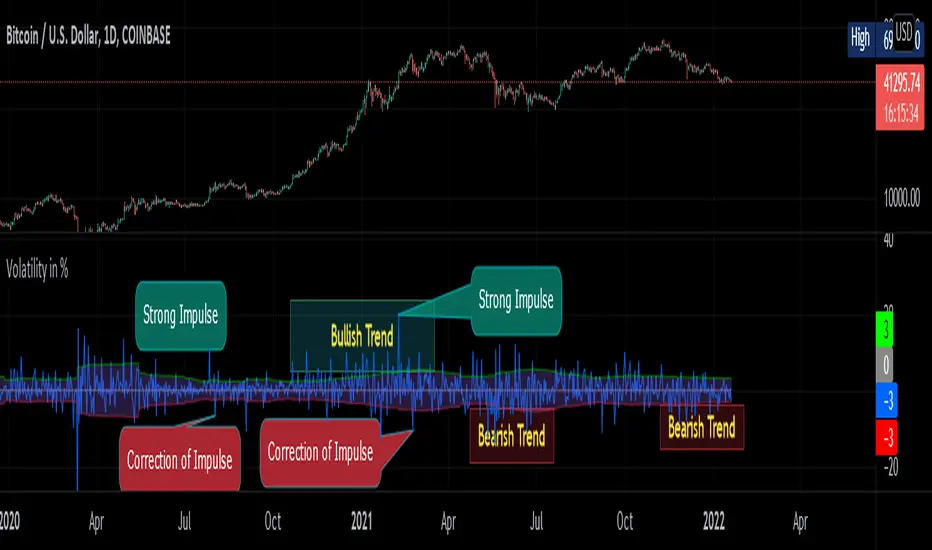
Volatility in % by zdmreVolatility is a statistical measure of the dispersion of returns for market index. In most cases, the higher the volatility, the higher the risk. Volatility is often measured as either the standard deviation or variance between returns from market index.
This indicator helps you identify the direction of the trend by calculating the standard deviation of the movement.