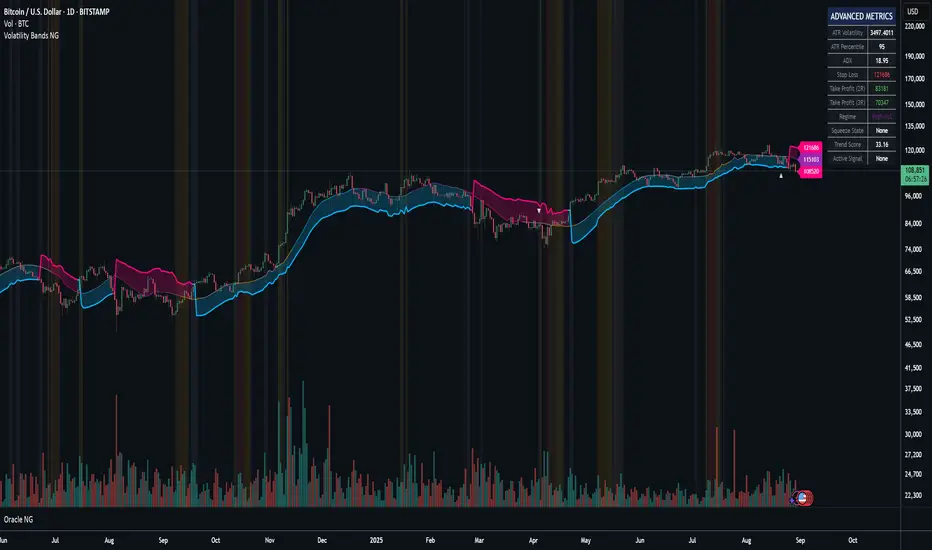
Volatility Bands NGThe Volatility Bands indicator is a sophisticated trading system that combines adaptive filtering technology with volatility-based band mechanics to identify high-probability trading opportunities. At its core, this indicator employs an Adaptive Gaussian Filter that dynamically adjusts to market conditions, providing smoother and more responsive trend detection than traditional moving averages.
Credit at @BigBeluga for his work on gaussian bands.
Key Technologies & Features:
Adaptive Gaussian Filter: Uses a weighted Gaussian distribution that automatically adjusts its sigma parameter based on current market volatility, creating a self-optimizing smoothing mechanism
Integrated ATR Model: Combines traditional ATR with volume-adjusted and momentum-weighted true range calculations (90% ATR + 1% Volume-Adjusted TR + 9% Momentum-Weighted TR) for superior volatility measurement
Trend State Machine: Tracks trend direction, strength (0-100%), and duration using a sophisticated scoring algorithm that weighs momentum (40%), direction consistency (40%), and volatility normalization (20%)
Market Regime Detection: Automatically identifies whether the market is Trending, Choppy, or in Low Volatility mode
Squeeze Detection System: Identifies compression periods using Bollinger Bands vs Keltner Channels methodology, alerting to potential explosive moves
Multi-Factor Confirmation: Validates signals using volume spikes and Money Flow Index (MFI) to filter out false breakouts
Automatic Risk Management: Calculates real-time stop-loss and take-profit levels (2R and 3R) based on current volatility
Primary Trading Strategies:
1. Trend Following with Confirmations
Enter LONG when price crosses above the lower band (bullish trend line) with green arrows showing confirmations
Enter SHORT when price crosses below the upper band (bearish trend line) with red arrows showing confirmations
Look for "✓" symbol indicating both volume and momentum confirmation for highest probability trades
2. Squeeze Breakout Strategy
Monitor orange background highlighting (squeeze active)
Prepare for breakout when squeeze releases (orange diamond appears)
Combine with trend direction for directional bias
Best used in ranging markets transitioning to trending
3. Retest Entry Strategy (Enable "Show Retest Signals")
After initial trend signal, wait for price to pull back to the adaptive filter line
Enter on retest signals (secondary arrows) for better risk/reward
Particularly effective in strong trending markets
4. Market Regime Adaptation
Trending Regime: Use standard trend-following entries with wider stops
Chop Regime: Focus on squeeze plays and avoid trend signals
Low Vol Regime: Tighten stops and reduce position sizes
Risk Management Guidelines:
Use the automatically calculated Stop Loss levels displayed in the info table
Scale out at 2R and 3R take profit levels
Reduce position size when Trend Score < 50%
Increase position size on confirmed signals (✓) with Trend Score > 70%
Advanced Filtering:
Combine trend direction with Market Regime for optimal entries
Use MFI levels (default 40/60) to avoid overbought/oversold entries
Monitor "Duration" in the info table - fresh trends (< 10 bars) often have more momentum
⚡ TL;DR
BUY: Green arrow + price above blue line + trend score > 50%
SELL: Red arrow + price below blue line + trend score < 50%
Best Signals: Arrows with "✓" symbol (full confirmation)
Avoid: Signals during orange squeeze periods (wait for release)
Exit: Use table's stop-loss (red) and take-profit levels (green)
Optimal Settings (already defaulted):
Adaptive Period: ON
Adaptive Sigma: ON
Require Confirmation: ON
Show Squeeze: ON
The indicator does the heavy lifting - just follow the arrows with confirmations and respect the risk levels shown in the table. Works best on 15m+ timeframes for crypto and 1H+ for forex/stocks.
🎯 Pro Tip: The indicator shines in trending markets. When the info table shows "Trending" regime with 70%+ trend score, increase position confidence.
If you’ve found value in Oracle NG and would like to support further development, feel free to donate:
BTC: bc1q2n4up8wzgqdsw9j3dzcn5jaelddu52t7ahydy6
ETH: 0x9b72b42326836528cA608c90811487E5244D7744
AVAX C-Chain: 0x9b72b42326836528cA608c90811487E5244D7744
Tìm kiếm tập lệnh với "Volatility"
Session Volatility MonitorOverview
Session Volatility Monitor is a versatile volatility indicator tailored for intraday and session-based trading. It computes the average maximum price deviation (either up or down) from the session's opening price over a user-specified number of prior days, providing insights into expected "room to move" in the current session. This helps traders gauge potential exhaustion points, set realistic targets or stops, and identify when a directional move has reached historical norms (flagged as "REACHED" with the exact price level).
Displayed via a customisable table and optional horizontal target lines, it's ideal for markets like forex, crypto, futures, or stocks where session volatility matters. The indicator supports custom sessions with timezone adjustments, making it adaptable to global trading hours (e.g., London, NY, or Asia kill zones). For assets with small tick sizes (e.g., forex pairs at 0.0001), a multiplier scales values for readability (e.g., showing pips as 67.0 instead of 0.00670).
Key Features
Session-Based Calculations:
Defines sessions via presets (e.g., "NY Kill Zone: 07:00-10:00") or custom HHMM-HHMM inputs. (please note that preset sessions are mainly for futures e.g. "Full Day18:01-17:00", but also can be useful for forex and crypto)
Adjustable UTC offset (e.g., -5 for ET) to align with your asset's timezone—ensures accurate detection regardless of TradingView's UTC internal clock.
Tracks the max one-sided move (high - open or open - low) per session, averaging over 1–N previous days (default: 14).
Table Display:
Avg Max Move: Historical average deviation, labeled with days averaged and session time.
Current Move: Real-time displacement from session open (positive for up, negative for down).
Room to Go Up/Down: Remaining distance to reach the average, updating live; appends "REACHED (price)" if hit during the session.
Customisable: Text color, font size (tiny to huge), position (e.g., bottom_left), and value scaling via multiplier/decimal places.
Target Lines:
Optional horizontal lines at "Up Target" (open + avg move) and "Down Target" (open - avg move).
Lines start at the session open bar and extend only through the session duration (e.g., stops at 12:00 for a 07:00-12:00 session)—no further projection post-session.
Fully customisable: Toggle on/off, color, style (solid/dotted/dashed), width, label text/background.
Display Adjustments for Forex/Crypto:
Multiplier: Scales raw values (e.g., set to 10000 for EURUSD to show pips like 45.0 instead of 0.0045).
Decimals: Controls precision (0–5 places) for table values.
How to Use
Add to Chart: Search for "Session Volatility Monitor" in TradingView's indicators and apply to your symbol (e.g., EURUSD for forex, NQ1! for futures, BTCUSD for crypto).
Configure Settings:
Select a session preset or custom range; adjust UTC offset if needed (e.g., +0 for UTC symbols like crypto).
Set "Number of Previous Days to Average" (e.g., 14 for a two-week look back).
For small-tick assets, set Multiplier (e.g., 100 for crypto points, 10000 for forex pips) and Decimals (e.g., 0 for whole numbers).
Customise table position/size/color and target lines for visibility.
Interpret Outputs:
Monitor the table for "room to go"—if Room Up is low/negative, upside might be limited; "REACHED" signals a potential reversal or exhaustion.
Use target lines as visual S/R levels; they auto-start at session open and halt at close.
Combine with price action, volume, or other indicators for entries (e.g., buy near down target if bullish bias).
Example Scenario:
Forex (GBPUSD, 1-min): Set session to "London Kill Zone: 02:00-05:00" (UTC+0), multiplier=10000. Table shows pips; lines mark expected highs/lows.
Limitations and Tips
Historical Data Limits: Averages are capped by TradingView's bar history (e.g., ~14 days on 1-min for free plans). Upgrade for deeper look backs or use higher timeframes.
Session Accuracy: Ensure UTC offset matches your chart—test with the "In Session" plot (enable in Style tab, zoom y-axis if columns are tiny).
No Alerts/Signals: Purely informational; add custom alerts via TradingView for "REACHED" conditions.
Performance: On very low timeframes with long sessions, lines might consume line limits (max ~50)—toggle off if needed.
Tips: For crypto/forex, experiment with multiplier to match your preferred units (e.g., points vs. decimals). Hide debug plot in Style tab for clean charts. If "REACHED" doesn't trigger, verify on historical data where moves exceed averages.
This tool draws from concepts like Average Daily Range but focuses on directional, session-specific volatility for precise intraday decision-making. Feedback welcome!
Disclaimer
This indicator is for educational purposes only and does not constitute financial advice. Always consult a professional before trading.

Volatility & Market Regimes [AlgoXcalibur]Analyze Market Conditions Like a Pro.
Volatility & Market Regimes is a specialized, institution-inspired indicator designed to help traders instantly identify the current conditions of the market with clarity and confidence.
By combining a real-time Volatility Histogram and Strength Line with a compact Regime Table, this tool reveals four essential market dimensions—Volatility, Strength, Participation, and Noise—in a clean and intuitive format. Whether you’re confirming trade setups or managing risk, knowing the current regimes enhances awareness across all assets and timeframes.
🧠 Algorithm Logic
This sophisticated tool continuously monitors four independent regimes, each reflecting a distinct dimension of market behavior:
• Volatility – Gauges how active or dormant the market is by comparing current price action movement to historical averages. A dynamic, color-gradient Volatility Histogram transitions from Low (ice blue/white) to Medium (green/yellow) to High (orange/red), giving you an immediate assessment of volatility and risk.
• Strength – Measures directional intensity by assessing trend momentum, pressure, and persistence. A color-gradient Strength Line ranges from weak (red) to strong (green), helping traders determine if directional strength is trending, weakening, or consolidating.
• Participation – Analyzes relative volume to assess the level of trader engagement. Higher volume indicates stronger participation and conviction, while low volume may signal uncertainty, fading momentum, or even liquidity traps.
• Noise – Evaluates structural stability by measuring how orderly or chaotic the price action is. High noise suggests choppy, unstable conditions, while low noise reflects clean, stable moves.
Each regime includes a High / Medium / Low classification and a color-coded directional arrow to indicate whether condition parameters are increasing or decreasing. Together, these components deliver real-time market context—helping you stay grounded in logic, not emotion.
⚙️ User-Selectable Features
Each component of the indicator—the Volatility Histogram, Strength Line, and Regime Table—can be independently made visible or hidden to match your preference. This flexibility allows you to display only the Regime Table and move it directly to your main chart, where it auto-positions to the center-right and integrates seamlessly with other AlgoXcalibur indicators that also use data tables for a cohesive and refined experience.
📊 Clarity, Not Guesswork
Volatility & Market Regimes is a unique, institution-inspired algorithm rarely seen in retail trading. Not only does it clearly display volatility—it translates complex market behavior into a clear context to reveal what’s happening behind the candles. By decoding core regimes in real-time, this tool transforms uncertainty into structured insight—empowering traders to act with clarity, not guesswork.
🔐 To get access or learn more, visit the Author’s Instructions section.

Volatility BandsThe Volatility Bands script is a custom indicator designed to help traders visualize volatility levels in the market. It calculates dynamic bands around a central moving average, providing insights into potential support and resistance levels based on recent price action.
The script calculates multiple volatility bands (u0, u1, u2, d0, d1, d2) that adjust based on recent price movements. The outer bands (u2 and d2) represent extreme volatility levels, while the inner bands (u0, u1, d0, d1) indicate more immediate support and resistance.
Look for price reactions at the band levels. A touch of the upper bands may indicate overbought conditions, while a touch of the lower bands may indicate oversold conditions.
Central Moving Average: A smoothed moving average that adapts to price changes, providing a clear trend direction.
The script has no input parameters.
Script Functions:
erf(x): Calculates the error function for a given input x. Used in the calculation of the smoothing factor for the UMA.
uma(input): Provides a smoothed average that adapts to recent price changes, reducing lag compared to traditional moving averages.
dev(input, mu): Used to calculate the volatility bands around the central moving average.

ATR Volatility Expansion FilterThe ATR Volatility Expansion indicator helps traders identify when market volatility is increasing.
It compares two ATR values: the Baseline ATR, which tracks long-term volatility, and the Current ATR, which measures recent price movements.
The core concept is that when short-term volatility significantly surpasses the long-term average, it signals a period of heightened price movement. Traders can use this information to adjust their strategies accordingly.
Baseline ATR (blue): Represents long-term volatility, serving as a benchmark.
Current ATR (orange): Measures short-term volatility, highlighting recent market shifts.
Threshold ATR (red): A customizable multiplier of the Baseline ATR, setting the threshold for volatility expansion.
When the Current ATR exceeds the Threshold ATR, the background turns green, indicating volatility expansion. This provides traders with ability to get involved in moving markets or avoid choppy conditions.
The indicator is fully customizable, allowing you to adjust the ATR lengths, timeframe, and threshold multiplier to align with your trading strategy.

Volatility Projection Levels (VPL)### Indicator Name: **Volatility Projection Levels (VPL)**
### Description:
The **Volatility Projection Levels (VPL)** indicator is a powerful tool designed to help traders anticipate key support and resistance levels for the E-mini S&P 500 (ES) by leveraging the CBOE Volatility Index (^VIX). This indicator utilizes historical volatility data to project potential price movements for the upcoming month, offering clear visual cues that enhance swing trading strategies.
### Key Features:
- **Volatility-Based Projections**: The VPL indicator uses the previous month’s closing value of the VIX, normalizing it for monthly analysis by dividing by the square root of 12. This calculated percentage is then applied to the E-mini S&P 500’s closing price from the last day of the previous month.
- **Upper and Lower Projection Levels**: The indicator calculates two essential levels:
- **Upper Projection Level**: The previous month’s closing price of the E-mini S&P 500 plus the calculated volatility percentage.
- **Lower Projection Level**: The previous month’s closing price of the E-mini S&P 500 minus the calculated volatility percentage.
- **Continuous Visualization**: The VPL indicator plots these projection levels on the chart throughout the entire month, providing traders with a consistent reference for potential support and resistance zones. This continuous visualization allows for better anticipation of market movements.
- **Previous Month's Close Reference**: Additionally, the indicator plots the previous month’s closing price as a reference point, offering further context for current price action.
### Use Cases:
- **Swing Trading**: The VPL indicator is ideal for swing traders looking to exploit predicted price ranges within a monthly timeframe.
- **Support & Resistance Identification**: It aids traders in identifying critical levels where the market may encounter support or resistance, thus informing entry and exit decisions.
- **Risk Management**: By forecasting potential price levels, traders can set more strategic stop-loss and take-profit levels, enhancing risk management.
### Summary:
The **Volatility Projection Levels (VPL)** indicator equips traders with a forward-looking tool that incorporates volatility data into market analysis. By projecting key price levels based on historical VIX data, the VPL indicator enhances decision-making, helping traders anticipate market movements and optimize their trading strategies.
Made by Serpenttrading

L&S Volatility IndexOverview
L&S Volatility Index is a tool designed to helps traders identify overpriced or underpriced moments in the market and adjust their trading strategies accordingly.
Calculations
This tool calculates how far the price is from the 21-period simple moving average as a ratio of the average historical volatility calculated over the last 21 candles.
How It Works
A L&S Volatility Index with a value greater than 30% may indicate that the asset is overpriced or underpriced relative to its average price.
How To Use
If the L&S Volatility Index > 30, the asset is overpriced or underpriced. This means that there is a good probability of initiating a mean reversion.
If the L&S Volatility Index < 30, the asset is in a fair price region. This means that it is acceptable to buy or sell in that price region.
Where To Use
Mean Reversion Strategy
Breakout Strategy
What Makes it Original
There is already an indicator that use a normalized calculation and a different approach to calculate historical volatility, whereas this script calculation is non-normalized and historical volatility is calculated using Don Fishback's formula. All calculations are used as originally described.
Credits
The L&S Volatility Index indicator was originally written by L&S Educação Financeira.
Historical Volatility calculation is based on the book "Odds: The Key to 90% Winners" written by Don Fishback.

Volatility Percentile (H-LINES)A simple script that adjusts the Volatility Percentile Indicator visibly in order to better accommodate entries/exits and certain trading setups/strategies.
--------------------------------------------------------------------------------------------------------------------------------------------------------
TL;DR - Remember after a full reset, we are looking for initial crosses UP on the UpperSwingline and crosses DOWN on the LowerSwingline for primary and secondary signal derivation.
Vice versa also works great but the prior method mentioned is a little more consistent in my experience, but you should mess around and optimise this for your own setups and strategies anyway.
--------------------------------------------------------------------------------------------------------------------------------------------------------
ORIGINAL SCRIPT HERE:
^Click image for a redirect to that script.
ALL CREDIT GOES TO: www.tradingview.com
He wrote everything so give credit where it's due, good bit of kit this here script is.
--------------------------------------------------------------------------------------------------------------------------------------------------------
HOW I USE MY VISUALLY ALTERED VERSION OF THIS SCRIPT
First of all, the alterations I've made seem only to be consistently viable with renko charts though if you can get the sought after results using candles or any other chart type then perfect, but be wary. All my back-testing done only with LinReg, HMA and SWMA - ATR type settings exclusively on renko charts. The changes I've made to the original script essentially just turns it visibly into an oscillator and uses a couple horizontal lines to generate signals, very simple - absolutely nothing has changed in the actual code of calculating this indicator.
What I believe my adjustments have achieved is quite simple. A full reset/oscillation on the indicator tries to map the strongest parts of a move or at least the part of the move where volume and the rate of transactions is at its peak to even facilitate said move. *take this statement with a pinch of salt though I do believe it's interacting with accumulation/distribution patterns, which is expected of volatility*
For ease of communication let's refer to the area between the the first UpperSwingline cross to the subsequent LowerSwingline cross, as the primary move. Then afterwards when it crosses the UpperSwingline again to make the full reset, the area in between those two points referred to as the secondary move.
Though more interestingly/practically the indicator ends up giving you two signals. In order for this to work we have to first decide that a spike up in volatility which crosses the UpperSwingline implies a significant level of interest at that price level. Usually that means a reversal is brewing, if price has already moved, trended and is approaching a certain area of value; which causes a spike of new positions to be taken, then you know that this is a level where contrarians are looking to enter. Now here's the tricky part, when volatility crosses the LowerSwingline price action becomes a little more open for interpretation, the way I personally like to look at this secondary signal is the potential for an exhaustion period to prolong itself a little longer. I know that's not the perfect analysis for what's going on, a more in-depth look into what's going on would best be described using Elliott Wave Theory, if a cross on the UpperSwingline near a significant area of value gives us a reversal trade lets just assume for the sake of argument that a new Elliott Wave can begin forming here. Making the move from that initial UpperSwngline cross to the cross on the LowerSwingline, the area that encompasses those two points: the impulse wave. After this point my analogy kind of falls apart and sadly my knowledge just isn't what it needs to be in order for me to properly analyse what's going on here but I must digress. Price after crossing the LowerSwingline up until the point where it makes a full reset by crossing the UpperSwingline again, within this area price seems to do either one of two things:
Situation 1 - Most likely occurs after a major trend reversal from major support/resistance or area of value (price has trended to new territory, maybe spent time a little time consolidating but hasn't broken the key level, momentum shifts, price action breaks current structure and you get the signal that primary move is a reversal) = Exhaustion Period, price will continue in direction of primary move during the secondary move. This here is for our trend-followers, you wanna take a continuation trade? Just wait for the pullback/rally to hit a FiB retracement level and enter - or any other means to find a decent support/resistance to enter.
Situation 2 - Most likely occurs when market enters a range or consolidation (price was previously seen as being at either a discount or premium so Situation 1 could have already played out and now you're looking at a full reset after that, imagine this spot to be the centre line of a linear regression channel or bang in the middle of your range, could even occur if price breaks a key moving average and decides it ought to consolidate around it for a while. Basically at any point where a somewhat prolonged consolidation is expected and not a quick reversal) = Corrective Wave, price will move against the direction of primary move during the secondary move. Now you might be expecting me to say this ones for you reversal traders but not really, if this is occurring then there probably isn't a definitive direction the market has chosen so you can use this opportunity to take range trades in the direction or against the direction of whatever the current trend or latest trend was depending on whatever slight bias you may have. <--- Situation 2 is very useful for finding cleaner entries if you do have a trend bias, say price underwent Situation 1, is now at key moving average but your bias is that it will break and continue up, so you wait and allow the secondary move of Situation 2 to take your entry to a much better R:R before entering a position.
--------------------------------------------------------------------------------------------------------------------------------------------------------

Volatility Weighted Moving AverageVolatility Weighted Moving Average (VAWMA) :
The Volatility Weighted Moving Average is a short and long term trend filter that weightes asset price buy "volatility significance" (percentages of total volatility over specified period) unlike that of the WMA which formulates an average based on the product of asset price and a deceding period significance . The result is a less noisy average which weights price based on its potential significance in trend, VAWMA tends to price when volatility is high and conversaly tends away from price when volatility is low.
Example :
As seen above the VAWMA tends to price more than both the SMA and EMA. The high volatility weightings allow for the VWMA to act as a potential trailing stop.
Dynamics :
- symbol volatility watchlist, change the ticker and corrosponding exchange to watch volatility over other markets.

Volatility Trackerhi there, fellows.
this is a very simple and quite straightforward indicator.
so far the simplest we've built.
on what it does
in regard to current chart and timeframe it plots
a. Open - Close as a percentage of the Open (we regard open as more relevant than close, for as you can use latest estimates in current candle) in daily change coloring (so one may have an idea if there is a trend or sideways move unfolding)
b. High - Low as a percentage of the Open, so one may compare extreme moves with final ones in the period
c. Volume as a percentage distance from its WMA200 (always this one, a way better reference for normalcy). (e. g. a positive value x means Volume is x% above its WMA200)
on what it means
to the best of our imperfect and incomplete understanding, we believe that low volatility periods lead to high volatility periods, so one might want to enter the market in low volatility periods to enjoy wild rides afterwards. such a trade of course would be, for the sake of making sense, a long volatility one.
the timing for entrance could be once that the volatility waves fades to chart minimums.
we're open to critics, suggestions and comments.
best regards.

Full Volatility Statistics and Forecast
This is a tool designed to translate the data from the expected volatility of different assets, such as for example VIX, which measures the volatility of SP500 index.
Once get the data from the volatility asset we want to measure(for this test I have used VIX), we are going to translate it the required timeframe expected move by dividing the initial value into :
252 = if we want to use the daily timeframe, since there are ~252 aproximative daily trading days
52 = if we want to use the weekly timeframe, since there 52 trading weeks in a year
12 = if we want to use the monthly timeframe, since there are 12 months in a year
For this example I have used 252 with the daily timeframe.
In this scenario, we can see that we had 5711 total cnadles which we analysed, and in this case, we had 942 crosses, where the daily movement ended up either above or below the channel made from the opening daily candle value + expected movement from the volatility, giving as a total of 16.5% of occurances that volatility was higher than expected, and in 83.5% of the times, we can see that the price stayed within our channel.
At the same time, we can see that we had 6 max losses in a row ( OUT) AND 95 max wins in a row (IN), and at the same time in those moments when the volatility crosses happen we had a 0.51% avg movements when the top crossed happened, and 0.67% avg movements when the bot happened.
Lastly on the second part of the panel, we had E which means the expected movement of today, for example it has 61.056$ , so lets say price opened on 4083, our top is 4083 + 61 and our bot is 4083 - 61 ( giving us the daily channel). At continuation we can see that overall the avg bull candle os 0.714% and avg bear candle was 0.805% .
I hope this tool will help you with your future analysis and trades !
If you have any questions please let me know !

Shotoki Volatility IndexHi, I finally coded a volatility index I'm proud of !
The formula is quite simple : It's the inverse of the maximal volatility that a candle can have
We find 2 lines : the white one, the volatility index ; the delayed index
The yellow area highlight the moment where we have more volatility
the gray one is when the market is quiet, it's not recommended to take decision in these moments
when the index is rising, there are less volatility
when the index is decreasing, the volatility is increasing
Shotoki

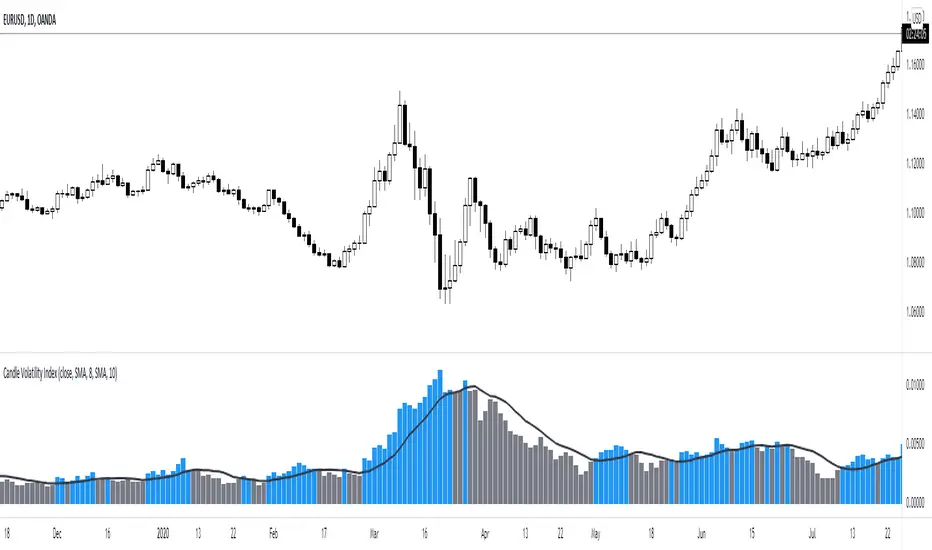
Candle Volatility Index [by NicoadW]This is the migration of the CandleVolatilitIndex from MT4.
The indicator works as following:
Step 1: The "Volatility Value" is calculated by applying a moving average to the change of the selected source (default: 10-Period-SMA applied to the change from last close to this close -> SMA(close-close , 10) )
Step 2: The signal line is calculated by applying a moving average onto the "Volatility Value" calculated in step 1.
The default settings are the same as in the original MT4 version.
Visualization:
The histogram shows the "Volatility Value" calculated in step 1.
Case 1:
The value is above the signal line (blue bar) -> Volatility is given
Case 2:
The value is below the signal line (grey bar) -> Volatility is not there
This is intended to be used as a Volume/Volatility Indicator for a NNFX-System but can be used in any strategy.
The Amplifier - Two Day Historical Bitcoin Volatility PlotThe 3rd piece to the other two pieces to our CoT study. This is the Amplifier, which turns select signals into 'Super' Buys/Sells
The other two being the 'Bitcoin Insider CoT Delta', and the on chart Price indicator most will have, if no others the 'Hunt Bitcoin CoT Buy/Sell Signals' that will indicate the key signals, ave 4 a year on the chart as they occur.
Why Bother another CoT signal?
Its different & focused on the Insider's.
Performance -
This Indicator provided a
1. Signal 1 = 26th March 2019 = SUPER LONG at $4,500 that saw a near $14,000 run up
2. Signal 2 = 18th & 24th June 2019 = SHORT at the second & final level $11,700 after repeated attempts & failure in the $13K range, the mini Echo Bitcoin Bull of 2019
3. Signal 3 = 17th December 2019 = LONG $6,900, Bitcoin rallied to Mid $10,500's
4. Signal 4 = 18th Feb 2020 = SUPER SHORT from $9,700's to a final extreme Low of $3,000, calling the CV-19 collapse
5. Signal 5 = 17th March 2020 = LONG from $5,400 no closure point yet
6. Signal 6 = 29th June 2020 = SUPER LONG reiterate from $10,700 no closure sell signal yet
7. Signal 7 = 17th May 2020 = LONG another accumulate LONG with no sell signal yet generated at Post H&S's low of $33,000
Note - This indicator only commences March 2019, as Bitcoin futures were a recent introduction and needed to settle for 6 months in both use and data, no signals were meaningful prior & data was light.
What is Provided. - Please note the need to also add the Hunt Bitcoin Historical Volatility Indicator for full understanding.
We provide 3 things with the 3 indicators.
'Insider' indications from Largest players in the futures market.
1. Bitcoin Macro Buy Signals.
a) The Bitcoin Commitment of Traders results see us focus solely on Largest 4 Short Open Interest & Largest 4 Long Open Interest aspects of the CoT Release data.
When the difference - is tight, a kind of pinch, these have been great Buy signals in Bitcoin.
We call this difference the Delta & When Delta is 5% or less Bitcoin is a Buy.
2. Bitcoin Macro Sells.
a) A sell signal is Triggered in Bitcoin at any point the Largest 4 short OI > or = to 70
3. AMPLIFIER Trade signals 'Super' Longs or Shorts -
Extreme low volatility events leads to highly impulsive & volatile subsequent moves, if either of 1 or 2 above occur, combined with extreme low volatility
a 'Super Long' or 'SUPER SELL' is generated. In the case of the short side, given Bitcoins general expansive and MACRO Bull trend since inception, we seek an additional component
that is an extreme differential/Delta reading between 4 biggest Longs & Shorts OI.
Namely CoT Delta also must be > 47.5%
We also have a Cautionary level, where it is not necessarily a good idea to accumulate Bitcon, as a better opportunity lower may avail itself, see conditions below.
So the required logic explicitly stated below for all Signals.
1. Long - Hunt Bitcoin CoT Delta < or = 5
2. SUPER Long - Hunt Bitcoin CoT Delta < or = 5; and 2 Day Historical Bitcoin Volatility = or < 20
3. Short - Largest 4 Sellers OI = or > 70
4. SUPER Short - Largest 4 Sellers OI = or > 70; AND..
Hunt Bitcoin CoT Delta = or > 47.5 AND 2 Day Historical BTC Volatility = or < 20
5. Caution - Largest 4 Sellers OI = or > 67.5 AND Hunt Bitcoin CoT Delta = or > 45
WARNING SEE Notes Below
Note 1 - = Largest 4 Open Interest Shorts
Note 2 - = Largest 4 Open Interest Longs
Note 3 - = Hunt Cot Delta = (Largest 4 sellers OI) -( Largest 4 Buyers OI)
Caution = Avoid new Bitcoin Accumulation Right Now, A sell signal might follow Enter on next Long
Note 4 - The Hunt Bitcoin COT Delta signal is a Largest 'Insider' Tracking tool based on a segment of Commitment of Traders data on Bitcoin Futures, released once a week on a Friday.
It is a Macro Timeframe signal , and should not be used for Day trading and Short Timeframe analysis , Entries may be optimised after a Hunt Bitcoin CoT Signal is generated by separate shorter Timeframe analysis.
Note 5 - The Historical Bitcoin Volatility is an additional 'Amplifier' component to the 'Hunt Bitcoin Cot Delta' Insider Signal
Note 6 - The Historical Bitcoin Volatility criteria varies by timeframe, the above levels are those applying on a Two Day TF Chart, select this custom timeframe in Trading View.
if additional criteria are met for LONG & SHORT insider signals, they may become 'Super Longs/Shorts', see conditions box above.

Scalpius Trend & Decreasing VolatilityScalpius Trend & Decreasing Volatility
Identify trends and 'decreasing volatility' trends (strong trends)
Can be used on any market
Setup usually used for 3 timeframes e.g. 2 min, 5 min, 10 min
Contains 2 parts:
I) Trend Indicator
Trends can be defined in several ways,
this indicator defines a trend that uses statistally significant price behaviour that includes the use of the Bollinger Bands
II) Decreasing Volatility Indicator
Trends that are accompanied by decreasing volatility are statistically more likely to go further and longer,
this indicator shows you when 'Decreasing Volalitility Mode' is on and when it turns off using 'pivot highs' and Average True Range
Using this indicator you can filter your trades to 2 types of trades: trend trades and mean reversion trades
I) Trend indicator
-----------------------
Trend Mode ON:
1) A candle touching the Bollinger Band (default settings: length=20, standard deviation=2) (the Bollinger Candle)
2a) (uptrend) A follow-up candle with a higher high and a higher close than the Bollinger Candle
2b) (downtrend) A follow-up candle with a lower low and a lower close than the low of the Bollinger Candle
Examples Trend Mode ON:
Uptrend
Downtrend
Trend Mode OFF when:
1) Price touches the opposite Bollinger Band
2) 20 candles without new high or low
3a) (uptrend) price closes consecutively below 2 EMA's (8 EMA & 21 EMA), above and below again, without making new trend highs
3b) (downternd) price closes consecutively above 2 EMA's (8 EMA & 21 EMA), below and above again, without making new trend lows
Examples Trend Mode OFF:
Uptrend ends because of opposite Bollinger Band touch:
Uptrend ends because of 20 candles without new high:
Uptrend ends because of price consecutively close below, above, below EMA 8 and EMA 21:
Downtrend ends because of opposite Bollinger Band touch:
Downtrend ends because of 20 candles without new low:
Downtrend ends because of price consecutively close above, below, above EMA 8 and EMA 21:
II) Decreasing Volatility Indicator
Decreasing Volatility Mode ON:
1) Trend Mode must be ON
2) Highest or lowest close in the trend must happen on a DOWNTICK in ATR (Average True Range, default setting=14)
Decreasing Volatility Mode OFF:
1) New ATR high in the trend
2) Breaking the pattern of lower lows and lower highs in ATR, aka 'pivot high' or '2 pivot high'
Examples DV Mode ON:
In an uptrend:
In a downtremd:
Examples DV Mode OFF:
In an uptrend:
In a downtremd:
If trend stops, DV Mode stays ON until DV OFF signal comes

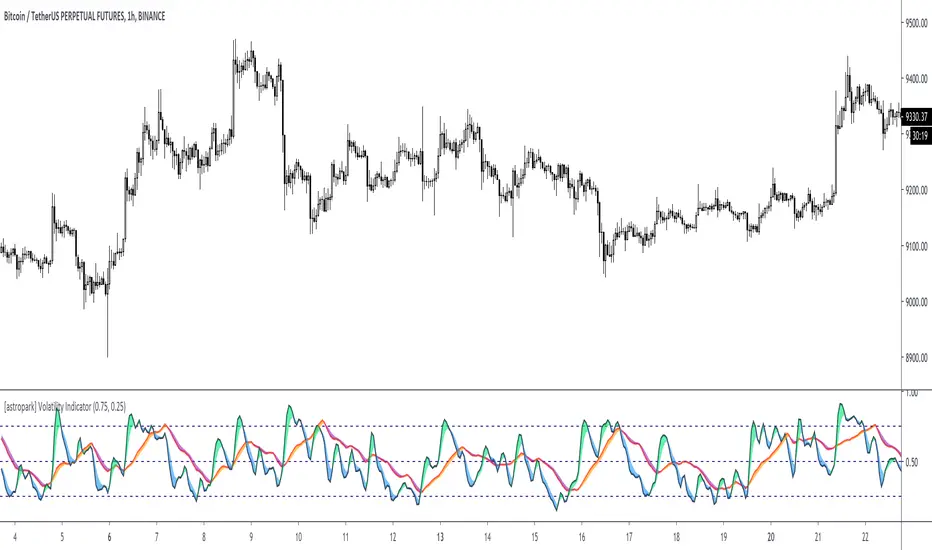
[astropark] Volatility IndicatorDear Followers,
today another interesting script: Volatility Indicator .
This indicator measures the volatility of the market you see in the timeframe you see, in a scale between 0 and 1.
It works on cryptocurrencies, commodities, stocks, indexes and forex.
You will see 2 volatility waves:
a black one (with green and blue shadow for increasing and decreasing mode), which is the "faster" one
a red one (with orange and purple shadow for increasing and decreasing mode), which is the "slower" one
The indicator highlights high volatility when it's near the top (1), while low volatility when near the bottom (0).
You can combine this indicator with your own strategy and indicators to validate them :
on low volatility it often happens that a signal fails to be profitable, as it lacks fuel
while it's better if volatility is over low level as price has more room to run while volatility increasing to the top
This indicator also lets you set alerts when volatility exceeds high level or low level.
This is a premium indicator , so send me a private message in order to get access to this script.
McMillan Volatility Bands w/ Buy & Sell Signals [optstrategist]BACKGROUND
McMillan Volatility Bands are an alternative approach to John Bollinger's "Bollinger Band" study and developed by world-renowned options trader and author Lawrence G. McMillan. Given his background in options trading, it was natural for Lawrence to approach any volatility-based study in the same manner options are priced --using Black-Scholes model. This model of pricing assumes a financial asset's volatility should be measured in percentage change rather than absolute value change.
OVERVIEW
The McMillan Volatility Bands indicator for TradingView will plot the 3 and 4-standard deviation bands around a 20-day moving average. This is how Larry has always used this system. The user can, however, change the standard deviation value as well as the moving average length to their preferred setting. This indicator can be used on any asset and on any timeframe.
Furthermore, the indicator will plot buy and sell signals based on a trading system used by Larry in his flagship newsletter publication The Daily Strategist. The system gives a signal when price closes outside the 4-sigma band and then closes back within the 3-sigma band. That 'signal bar' will be colored red or green for a sell or buy signal setup, respectively.
Finally, an arrow will be plotted on the chart where the system would actually enter the trade. This is determined when price trades a little beyond the extreme of the 'signal bar'. The level by which price has to go beyond the 'signal bar' is an input parameter and can be adjusted by the user. We've chosen the default value of 0.34. This means, the indicator will not give a buy or sell entry until the price moves: 1/3 x beyond the extreme signal bar. This is to prevent getting whipsawed by some setups that never really move in your favor. We've found it successfully removes the less-valuable trade setups.
PARAMETERS
ma_length => length of the moving average that the volatility bands work off of
outside_sigma => standard deviation of outer volatility band
inside_sigma => standard deviation of inner volatility band
entry_trigger_cushion => this refers to the percentage of the signal bar's range. The default value is 0.34. This means price will need to move 1/3 (~34%) of the signal bar's range beyond the high (for a buy) or low (for a sell) of the signal bar to trigger a buy/sell entry. This entry plots the arrow on the chart. We have found requiring this extra move in price eliminates many of the less-desirable signals at the expense of entering the better signals a little later.
WANT TO PURCHASE OR NEED MORE INFORMATION ON McMILLAN VOLATILITY BANDS?
Visit the link below to see purchasing options as well as screenshots of the indicator and how we trade it at McMillan Analysis Corp.

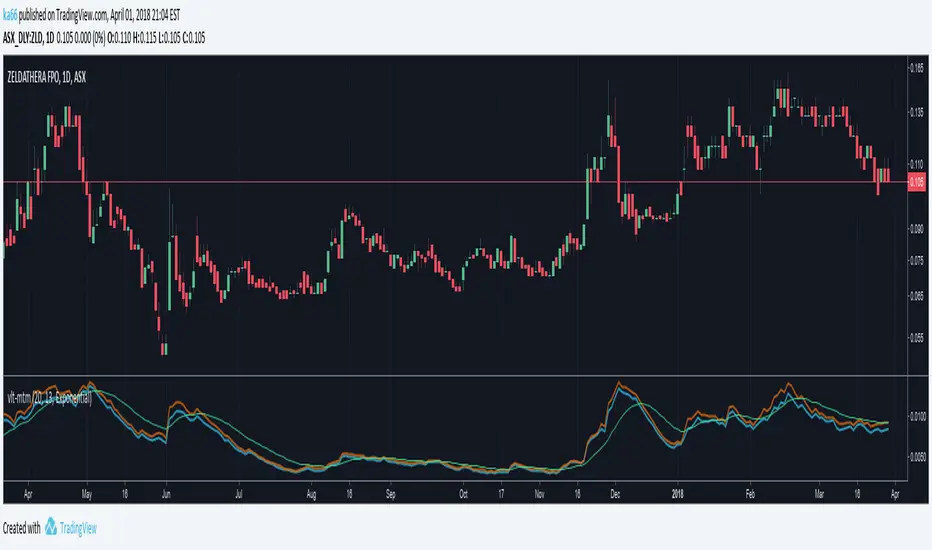
ka66: Volatility MomentumThis is a 'monitoring' indicator to see if an instrument is viable enough to be traded, by virtue of volatility (or lack of volatility in context may lead to a break out), or may become so. It shows the following information:
Price Range (high - low) averaged across a set of bars: Useful gauging potential trading profits. This was its initial goal, to not measure bars manually!
ATR : As a comparison point for the price range above. Divergence between true range (TR) and plain price range might signal volatility changes occurring in the instrument.
Signal volatility line : a moving average of the larger of the average price range and ATR. This takes inspiration from other indicators like MACD and Stochastic, and is a way of comparing change in recent volatility --- this achieves the momentum part. The larger was chosen to keep things simple, and not have a signal line per range!
avgRange = movingAvg(high - low, avgPeriod)
atr = movingAvg(trueRange, avgPeriod)
signal = movingAvg(max(avgRange, atr), avgPeriod)
Configurable periods and averaging mechanism.
Daily Historical Volatility StdDev LevelsDescription:
This indicator plots Daily Standard deviation levels on price chart based on Historical Volatility (HV). It uses the most common approach for calculating historical volatility as standard deviation of logarithmic returns, based on daily closing/settlement prices.
Assets: Currency Pairs, Commodities, also works on stocks, some indices.
Time Frames: 5min to 60min. This will also work on Daily Chart, by setting "DaystoExpire" to 21
Options:
Use Daily Data to Calculate StdDev HV (default), otherwise use the charts Time Frame
Lookback = number of days/periods to calculate stddev of HV (21 by default)
Annual = number of trading days in a calender year (252 by default)
Days to Expiry = number of days for the life of this option ( for auto calculation
this is 1 for intraday, 21 for daily and annual when chart TF used)
Settlement Source = close price by default, can use another source.
Settlement Volume Weighted Average Length = by setting this to >1 then an average
is used for settlement.
Display ### Standard Deviation Levels = select what levels are to be displayed.
References:
How To Use Standard Deviation In Your Trading Day: www.youtube.com
Deviation Levels Indicator: www.youtube.com
www.macroption.com
Historical Volatility based Standard Deviation_V2 by ucsgears
Historical Volatility Strategy by Hpotter
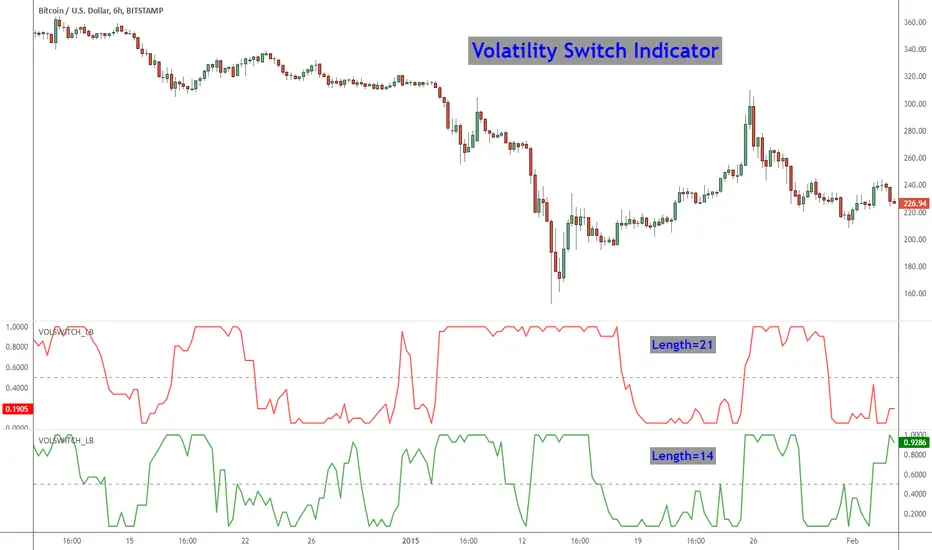
Volatility Switch Indicator [LazyBear]The Volatility Switch (VOLSWITCH) indicator, by Ron McEwan, estimates current volatility in respect to historical data, thus indicating whether the market is trending or in mean reversion mode. Range is normalized to 0 - 1.
When Volatility Switch rises above the 0.5 level, volatility in the market is increasing, thus the price action can be expected to become choppier with abrupt moves. When the indicator falls below the 0.5 level from recent high readings, volatility decreases, which may be considered a sign of trend formation.
Trading strategy as suggested by Ron McEwan is:
- If VOLSWITCH is less than 0.5, volatility decreases, which may be considered a sign of trend formation
- If VOLSWITCH is greater than 0.5, market is in high volatility mode. Can be choppy. Use RSI to look for OB/OS levels.
I have implemented support for 2 lengths (14 and 21) Note that, Pine doesn't support loops. Once it is introduced, I will publish an updated version.
Building a strategy out of this is straightforward (refer to my strategy explanation above), I strongly encourage new Pinescript coders to try to a plotarrow() based overlay indicator to get more familiar with Pine.
More info:
---------
The Volatility (Regime) Switch Indicator : traders.com
Complete list of my indicators:
-------------------------------------
docs.google.com
BT Volume & Volatility Spike
The BT Spike Indicator is aimed at identifying significant spikes in trading volume and price volatility on cryptocurrency or futures charts. It helps traders spot potential reversal or momentum shifts by combining volume analysis with volatility measures. The core logic revolves around detecting when volume surges above its historical average while volatility (measured via ATR) also spikes, signaling unusual market activity that could precede breakouts, pullbacks, or trend changes.
Key features include:
Inputs: Customizable parameters like lookback periods for averages (e.g., 14-bar EMA for volume), ATR length (default 14), and spike thresholds (e.g., volume multiplier of 2x the average).
Visuals: Plots bars or shapes on the chart for spike detections (e.g., green for bullish spikes, red for bearish), with optional alerts for real-time notifications.
Versions: We iterated on it, adding features like better alert conditions and visual signals, but rolled back to a simplified v0.1 for reliability, removing some experimental bug-prone elements like multi-timeframe checks.
BT Spike is a volume & volatility signal meant to alert traders that a move could begin soon, and is a supplementary tool to highlight confluence for existing high-probability setups.

Zscore correlation volatility Demi vie IlkerThis is an all-in-one "regime" dashboard for pairs trading. It's designed to stop you from taking bad mean-reversion trades by first identifying if the market conditions are stable.
It answers two key questions:
1. "Is this a good time to trade a mean-reversion strategy?" (The Regime Filter)
2. "If yes, how fast should I expect the trade to work?" (The Half-Life)
## 📈 Key Features
This script runs four main calculations at once:
1. The Price Z-Score (Blue Line)
This is your primary entry signal. It shows you how "cheap" (e.g., -2.0) or "expensive" (e.g., +2.0) the spread is relative to its short-term history (z_len).
2. The Regime Background (Green / Red)
This is the most important part. It acts as a "traffic light" for your trading:
• 🟢 GREEN (Stable Regime): It's safe to look for mean-reversion trades. This means both the correlation and volatility filters are stable.
• 🔴 RED (Unstable Regime): DO NOT trade mean-reversion. The relationship between the assets is broken. Any signal is likely a trap.
3. The Regime Filters (Your "Guards")
These two filters determine the background color:
• Correlation Z-Score (Purple Line): It measures the stability of the correlation. If this purple line drops below the red threshold (corr_z_threshold), it means the correlation has broken down, and the background turns RED.
• Volatility Ratio (Orange Line): It compares the volatility of the two assets. If one asset suddenly becomes much more volatile than the other (deviating from its average ratio), the background turns RED.
4. The Half-Life Dashboard (Top-Right Table)
This is your "speedometer." Based on an Ornstein-Uhlenbeck model, it calculates the average time (in bars) it takes for the spread to revert 50% of the way back to its mean.
• HL: 13.86 periods: You can expect it to take ~14 bars to go from a Z-Score of 2.0 to 1.0.
• N/A (Divergent): A critical warning. The math shows the spread is currently diverging and has no tendency to revert.
## 💡 How to Use This Indicator
Setup (Required):
1. Load a spread chart (e.g., type MES/MNQ or MGC/SIL into the TradingView search).
2. Add this indicator to the spread chart.
3. Go into the indicator's Settings (⚙).
4. In the "Inputs" tab, you must enter the two individual tickers:
• Symbol 1 Ticker: MGC
• Symbol 2 Ticker: SIL
(This is so the script can calculate the Correlation and Volatility filters).
Trading Signals
1. Mean-Reversion Signals
• BUY Signal (Green Triangle ▲): Appears only if the background is GREEN and the Price Z-Score (blue line) crosses below the -2.0 band.
• SELL Signal (Red Triangle ▼): Appears only if the background is GREEN and the Price Z-Score (blue line) crosses above the +2.0 band.
• EXIT: Your target is a reversion back to the 0 line. The Half-Life value gives you an idea of how long to wait.
2. Divergence Warning Signals
• Blue/Fuchsia Triangles (▲ / ▼): These appear at the exact moment the background turns RED. They warn you that the "stable" regime is broken and a new "divergence" or "trend" regime may be starting. This is a signal to stay out or manage any existing positions.
This tool is designed to add a layer of quantitative, risk-management logic to a standard Z-Score strategy. It helps you trade only when the statistics are in your favor.
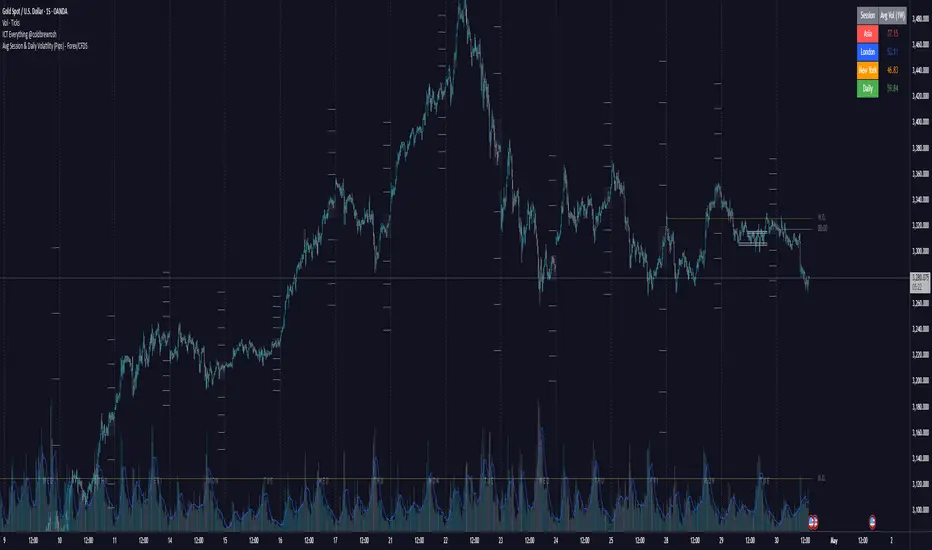
Avg Session & Daily Volatility (Pips) - Forex/CFDS🔍 Overview
The Avg Session & Daily Volatility (Pips) indicator measures the average High–Low range (volatility) of three major Forex sessions—Asia, London, New York—and the entire trading day, then displays the results in a compact overlay table.
⚙️ Key Features
Session Windows
Asia: Default 23:00 – 07:00 server time
London: 07:00 – 16:00
New York: 13:00 – 22:00
Daily Range
– Tracks the full High–Low from midnight to midnight.
Flexible Lookback
– Choose 1W / 2W / 4W / 8W (≈ 5 / 10 / 20 / 40 trading days)
Pip Conversion
Forex Pairs: 1 pip = 0.0001 → (ticks / mintick) / 10
XAU/USD (Gold): 1 pip = 1 USD → direct price difference
Custom Styling
– Pick your own colors per session & daily
– Table position: Left/Center/Right × Top/Middle/Bottom
📈 Benefits & Use Cases
Optimal Stop-Loss & Take-Profit
Gauge each session’s typical movement to size SL/TP appropriately.
Intraday Performance Check
Compare your real-time trade swings against historical averages.
Risk Management
Align position sizes with average volatility to control risk.
Multi-Asset Support
Works seamlessly for major Forex pairs and Gold (XAU/USD) thanks to smart pip logic.
🚀 How It Works
Session Scanning – Continuously tracks the session’s high and low.
Array Storage – At session close, calculates range in pips and pushes it into a rolling buffer.
Averaging – Computes the arithmetic mean of the last N values (your chosen lookback).
Visualization – Paints the four averages in a neat 2×5 table overlay.
👍 Pro Tips
Check Your Time Zone – Make sure chart timezone matches your broker’s session times.
Tweak Lookback – Use shorter windows (1W) to react quickly; longer (4–8W) to smooth out outliers.
Combine Indicators – Pair with volume or trend tools for deeper insights.
Happy Trading,
Riseofatrader