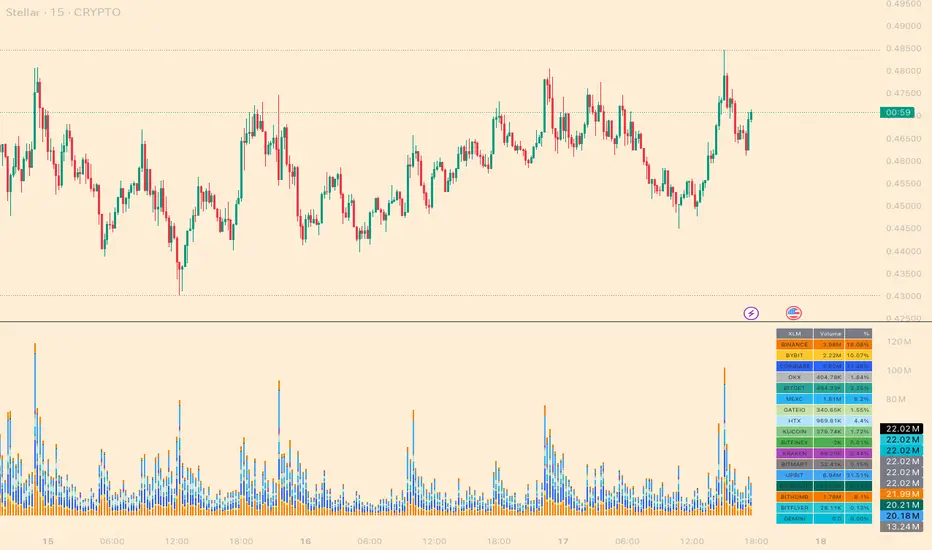
Cross-Exchange Any Volume[nakano]# Cross-Exchange Any Volume
This indicator aggregates the real-time trading volume of a specific crypto asset across multiple exchanges and displays it as a single, stacked column chart. It allows you to grasp the total volume and its composition across the market at a glance.
このインジケーターは、複数の取引所における特定の暗号資産の出来高をリアルタイムで合算し、一つの積み上げ棒グラフに表示します。市場全体の総出来高とその内訳を、一目で把握することができます。
## Features / 主な機能
* **Aggregate up to 20 Exchanges:** Simultaneously calculates and displays the volume from up to 20 user-defined exchanges.
* 最大20の取引所の出来高を同時に集計・表示します。
* **Customizable Exchanges:** Freely customize the exchange prefix for each slot in the settings (e.g., `BINANCE`, `COINBASE`, `BYBIT`).
* 設定画面から各取引所の取引所プリフィックスを自由に変更可能です(例:`BINANCE`、`COINBASE`、`BYBIT`)。
* **Flexible Quote Currencies:** Specify the quote currencies you want to aggregate for each exchange in a comma-separated list (e.g., `USDT,USDC`).
* 取引所ごとに集計したいクォート通貨をカンマ区切りで指定可能です(例:`USDT,USDC`)。
* **Individual Configuration:** Individually configure the color and visibility (On/Off) for each exchange slot.
* 各取引所の色や表示/非表示を個別に設定できます。
* **On-Chart Details:** Display a detailed volume breakdown on the chart as either a Table or a Label. Text size is also adjustable.
* チャート上に出来高の内訳をテーブル形式またはラベル形式で表示できます。文字サイズの調整も可能です。
* **Debug Report:** Includes a date-range-specific cumulative volume report for debugging and analysis purposes.
* デバッグや分析目的で、指定した期間の累計出来高レポートを表示する機能を搭載しています。
## How to Use / 設定方法
1. **Set Base Asset:** In the settings, enter the crypto asset symbol you want to analyze into the `Base Asset` field (e.g., `BTC`, `ETH`, `SOL`).
* 設定画面の`Base Asset`に、分析したい暗号資産のシンボル(例:`BTC`, `ETH`, `SOL`)を入力します。
2. **Configure Exchanges:** For each row (1-20), enable the checkbox for the exchange you want to use. Then, enter the correct exchange prefix (e.g., `BINANCE`) and the desired quote currencies (e.g., `USDT,USDC`). You can also customize the display color.
* 各行(1〜20)で、使用したい取引所のチェックボックスをONにします。次に、正しい取引所プリフィックス(例:`BINANCE`)と、集計したいクォート通貨(例:`USDT,USDC`)を入力します。表示色も自由にカスタマイズできます。
3. **Disable Unused Slots:** For any slots you are not using, simply leave the checkbox disabled. The script will ignore them.
* 不要なスロットは、チェックボックスをOFFのままにしてください。スクリプトはそれらを無視します。
## Notes / 注意事項
* **`request.security` Call Limit:** Pine Script has a limit on `request.security` calls (around 40 per script). If the total number of quote currencies across all enabled exchanges exceeds this limit, the script will stop with an error. For example, `USDT,USDC` counts as two pairs. Please be mindful of the total number of pairs in use.
* **`request.security`の呼び出し回数上限**: Pine Scriptには、スクリプトあたりの`request.security`呼び出し回数に上限(約40回)があります。有効にした全取引所のクォート通貨の合計数がこの上限を超えると、スクリプトはエラーで停止します。例えば、`USDT,USDC`は2ペアとしてカウントされます。有効にするペアの合計数にご注意ください。
* **Debug Report Timeout:** The Debug Report feature aggregates data over every single bar within the specified date range. Using this feature with a long date range on short timeframes (like the 1-minute chart) may cause the script to exceed TradingView's calculation limits and time out. It is recommended to use a shorter time range when enabling this feature on low timeframes.
* **デバッグレポートのタイムアウト**: デバッグレポート機能は、指定された期間のすべてのバーのデータを集計するため、特に1分足などの短い時間足で長期間を指定すると、TradingViewの計算リソースの限界を超え、チャートの読み込みがタイムアウトする可能性があります。この機能を使用する際は、短い期間に絞ってお試しいただくことをお勧めします。
Tìm kiếm tập lệnh với "Volume"
Session VolumeThis script tracks and displays 30-minute volume segments during the Regular Trading Hours (RTH) session. It allows traders to visually compare each time block’s volume today vs. the same block from the previous day, helping spot early signs of strength, weakness, or divergence.
Features:
Tracks 13 blocks from 9:30 AM to 4:15 PM ET.
Compares today's volume against historical volume from the same time block yesterday.
Highlights percentage changes per block.
Summary row totals show overall volume trend today vs. yesterday.
This tool is useful for discretionary traders, auction market theorists, and anyone who incorporates market-generated information into their decision-making.

Climax Volume FilterThis script helps filter out volume spikes caused by sudden market events (e.g. CPI, FOMC), which can distort volume-based analysis.
It identifies and optionally smooths or excludes high “climax” candles to provide a clearer view of natural volume trends during pullbacks and consolidations.
Use it to:
• Avoid misreading volume during news events
• Improve your reading of exhaustion vs. continuation
• Support better entry timing during flag or FVG setups
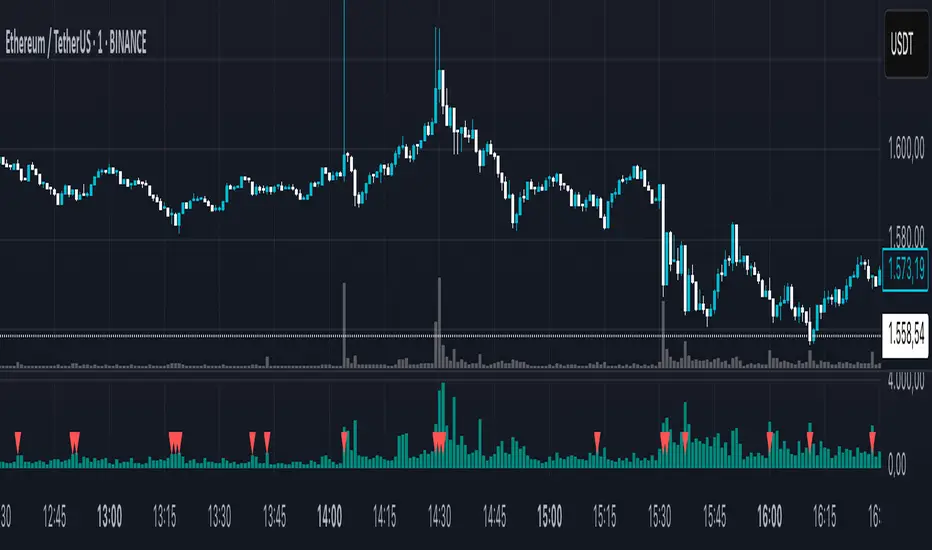
[g8] Volume Observer BasicA simple indicator to highlight surges and drops in recent average volume with custom settings and alerts.
How to interpret the signals: A white signal indicates a surge in recent average volume, meaning we expect a probable move in the direction of the highlighted candle. A gray signal is the opposite: a drop in volume suggesting the current move is losing momentum and may be nearing it's conclusion. Keep in mind that a surge does not always mean bullishness and a drop does not always mean a drop in price is coming, but rather view these signals as the market's interest in continuing or ending the current move.
I made this indicator because I'm terrible at interpreting regular volume bars. I hope you find it useful.

Cumulative Volume Delta with SignalThis premium-grade technical indicator provides deep insights into market sentiment by tracking the difference between buying and selling pressure through volume analysis. SCVD offers a sophisticated approach to volume profile analysis, helping traders identify potential trend reversals and momentum shifts before price action confirms them.
Key Features:
Real-Time Volume Delta Analysis: Visualizes buying vs. selling pressure through color-coded candles
Smart Signal Line Integration: EMA-based signal line helps identify trend changes and trading opportunities
Multi-Timeframe Capabilities: Automatically selects optimal lower timeframes for precision or can be customized
Daily Reset Option: Anchor period functionality for intraday delta analysis
Professional Visualization: Clean, color-coded display with zero reference line
Trading Applications:
Identify divergences between price action and volume delta for potential reversals
Spot accumulation/distribution patterns through delta behavior
Use signal line crossovers for entry/exit timing
Confirm trend strength by analyzing delta momentum
Detect potential false breakouts through volume confirmation
Perfect for day traders, swing traders, and institutional investors who rely on volume analysis for decision-making. This indicator combines sophisticated volume delta metrics with an intuitive interface to provide actionable trading insights across all markets and timeframes.

Projected VolumeCalculates Projected Volume for the current trading day. Builds on Pocket Pivot Breakout Script by simatricks.

Ticker Screener by Volume Heatmap [SS]Fun little screener that creates a heatmap by daily volume trend.
The numbers expressed are the Sell to Buy ratio (Selling volume / buying volume). The % is the % change over the lookback period.
The default lookback period is 25 days, but you can adjust it as you see fit. The brightness of the green and red will change based on the extent of buying / selling.
Anything 1 or over means there is a lot of selling. A percent change in the negatives is good, it means that selling is decreasing and buying is increasing. Vice versa for a percent change in the positives.
It will accomodate up to 12 tickers, there are some pre-set but you can obviously customize it with your own tickers of interest.
And that's pretty much the indicator, pretty simple indicator but I hope you enjoy!
Safe trades everyone!

Ace VolumeThis is volume indicator that can help you identify either the volume is increasing or decreasing gradually.
The color based on the previous volume price.
The bigger the volume from the previous, it will show bull color (white) and vice versa bear color (blue).
The example of the indicator volume as shown above. Feel free to used it. Thank you!
Performante's Average Bitcoin Volume IndicatorThe volume of all major exchanges, including:
Bitfinex, Coinbase, Bitstamp, Bitmex, Kraken, Binance, Bithumb, Flyer, and OkEx

Zanger Volume Profile ZVR v1This is an attempt to make a zanger volume profile indicator, it needs improvement and some sort of forward looking volume estimator.
LazyScalp Volume in Currency AVGThis indicator displays the volume in the currency of the asset.
It also draws the average for a certain period and the average multiplied by the coefficient. If the volume is higher than the average multiplied by the coefficient, then the histogram bars and candlesticks on the chart are highlighted in color.
Also, the indicator sends alerts at such moments.
The indicator allows you to quickly see when the volume rises sharply. Often these are very interesting points for trading.
The indicator has many settings and display styles.

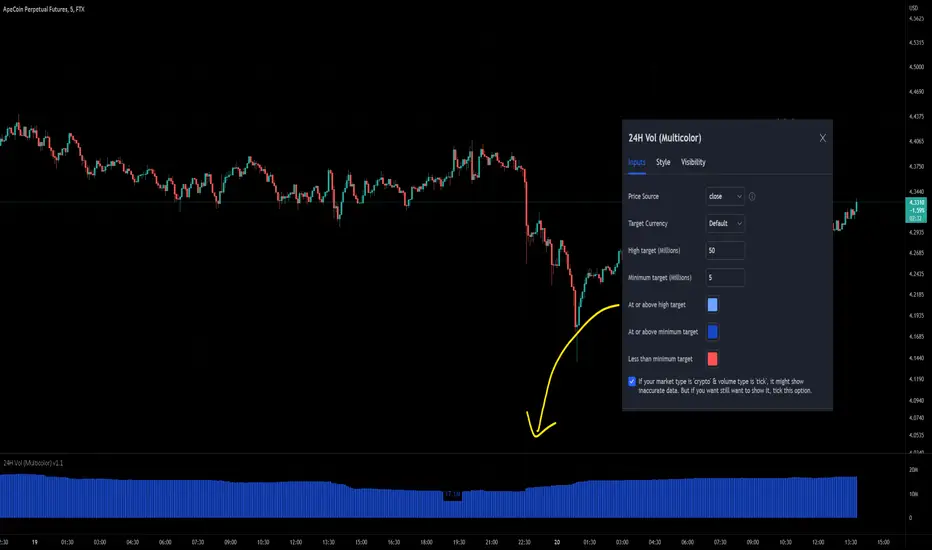
24-hour Volume (Multi-color with target size)This indicator has added the option to set different colors for a size target so you can set and instantly knows if the volume is above or below your target by seeing the different colors. Furthermore, I've added the option to opt-out of the error message that blocked the use of the 'crypto' market with the 'tick' type because maybe some users needed it, for example: BYBIT:APEUSDT is by default not available but personally I want to see it, so I can turn it on in this script.
Koalafied Volume Extension BubblesCircles based on extensions from volume Z-Score. Large volume candles can often signal exhaustion or show market strength in reversals or breakouts. Circles can be offset back to the start of the day/profile or left at the time where they occur.
Colours denoting deviations from the mean are
+2 std dev - Green
+1 std dev - Blue
-1 std dev - Red
-2 std dev - Purple
Concept is primarily as a pseudo volume profile delta tool. Obviously it's a very basic heuristic so would recommend further reading and use of actually footprint data to base trading decisions on.

Mehrdad banakar (volume / candle size)This indicator divided volume on size of candle. It developed base on the volume, and its fluctuate make a good perspective to user to analyze the market.

perp-spot Volume of Alts FTXJP※ This indicator works only on FTX.
Integrated "perp-spot" volume of all alts currently tradable by Japanese on FTX Japan that have both PERP and USD pairs.
It subtracts the volume of SPOT from the volume of PERP and integrates them.
Contains : volume of
(BTCPERP - BTCUSD)
(ETHPERP - ETHUSD)
SOLPERP - SOLUSD
XRPPERP - XRPUSD
DOTPERP - DOTUSD
LTCPERP - LTCUSD
FTTPERP - FTTUSD
BCHPERP - BCHUSD
BATPERP - BATUSD

Integration Volume of Alts FTXJPIntegrated volume of all alts (perp) currently tradable by Japanese on FTX Japan.
You can compare the overall trend of altcoins through the volume on the screen of a specific stock (BTC, ETH, etc.).
Contains :
(FTX:BTCPERP)
(FTX:ETHPERP)
FTX:SOLPERP
FTX:XRPPERP
FTX:DOTPERP
FTX:LTCPERP
FTX:FTTPERP
FTX:BCHPERP
FTX:XLMPERP
FTX:BATPERP

Buying Selling Volume v2Builds on Ceyhun's "Buying Selling Volume" indicator. This version allows users to define periods by effortlessly dragging two points or you may define periods by manually entering the start and end times in the settings window. Once the period is defined, both buying and selling volume will be totaled thus displaying the amount of buys and sells in that period.
I have found the information provided from the script helps in defining a period of consolidation as either being accumulative or distributive.

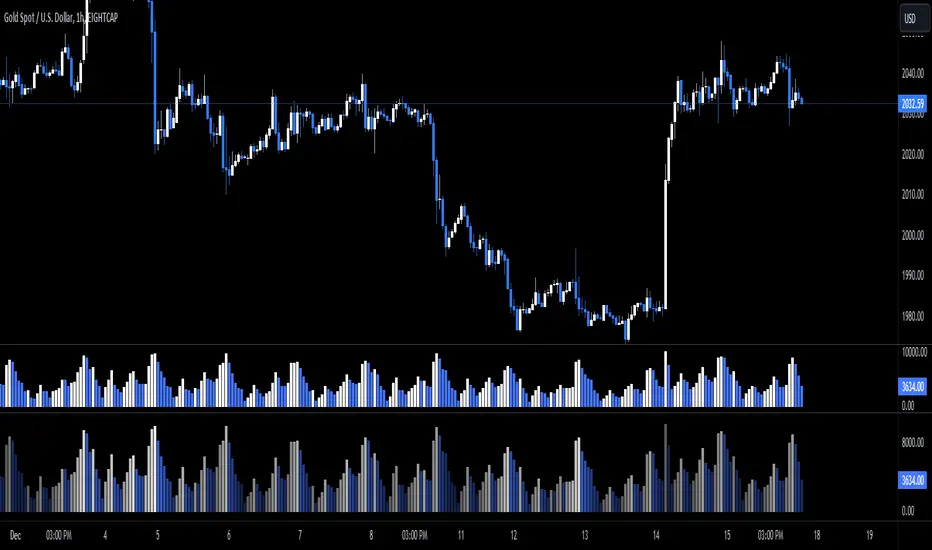
BTC Spot/Futures Volume RatioShows the ratio between the spot trading volume versus futures trading volume for Bitcoin. This ratio may be interpreted as how active the market currently is, and may lead to various interpretations. For example, when the price is at a high level and this ratio gradually decreases, it may imply the end of the distribution phase; when the price is low and the ratio is at the bottom, it may imply the bottom of the price.

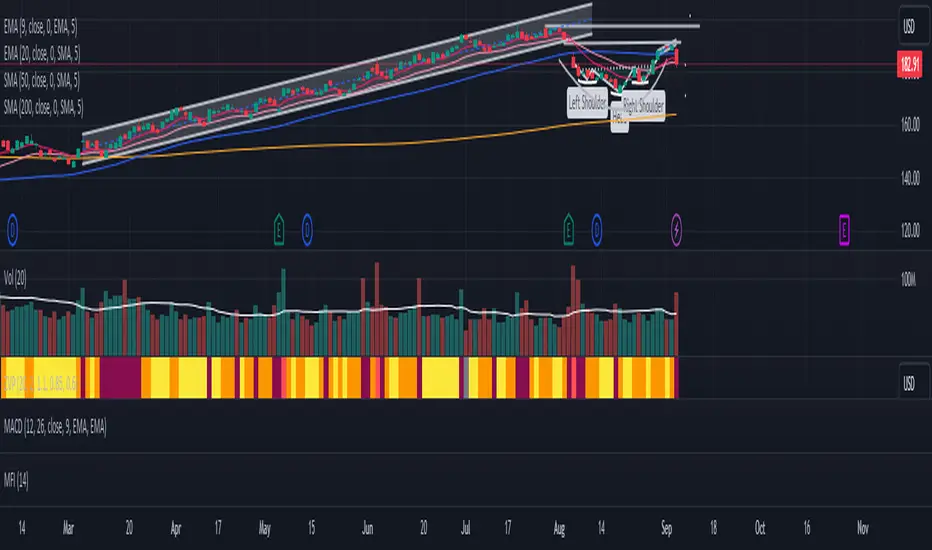
[HuD] MA VolumeMA Volume is a group of moving averages based on :
Value = ( volume ) x ( current price )
There are few Moving Average (MA) :
I. 10 EMA
2. 20 SMA
3. 50 EMA
4. 200 SMA
a) When 10 EMA > 20 SMA, then the band is green, and red when 10 EMA < 20 SMA.
b) Dot green = Golden cross when :
🔹ema10 crossover sma20
🔹ema10 crossover ema50
🔹sma20 crossover ema50
🔹ema50 crossover sma200
The purpose of this indi ( version 1 ), is just to get the overall view of how volume is related to price movement.

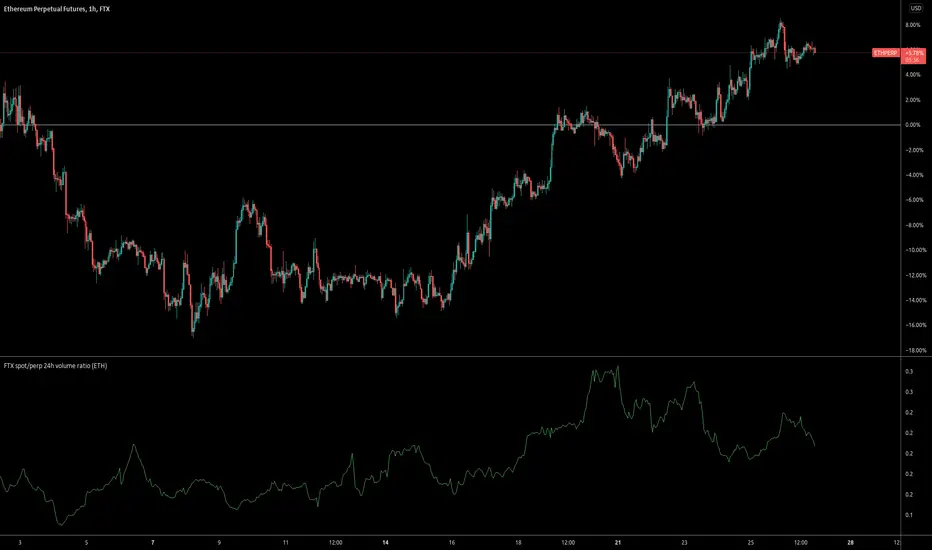
FTX spot/perp 24h volume ratioThis indicator gives the ratio between the 24h volume on the spot instrument versus the perpetual contract on FTX.
Base volumeCalculates volume in base currency. For example, in a pair bnbusdt will show the volume not in bnb, but in usdt (million).

TKP Volume Slope Bar ColoringUsing the slope of the 20 Period Volume Moving Averages to detect trend changes in Volume
*With respect to Indexes only*
Increasing Volume tends to be "Bearish" while decreasing volume tends to be "Bullish".
Color of the slope changes when the current slope is above or below the reading of the slope 3 days prior.

Dip Volume V1the very simple and very effective script, the script fetching the data from future contract data so that you can easily understand what is going inside the future data volume . and this is very important for Nifty and Bank Nifty traders
