VWolf – EquinoxOVERVIEW
The VWolf – Equinox strategy integrates multiple technical filters, skew deviation logic, and advanced momentum indicators to identify high-probability trend continuation and reversal setups. Built upon the Vumanchu framework, this strategy applies filters such as EMA, DEMA, Supertrend, QQE, ADX/DMI, and customized skew thresholds. It combines these with divergence detection, volatility conditions, and risk-managed trade execution for dynamic adaptability across market conditions.
Its architecture is designed to provide flexibility for both backtesting and forward testing periods, while allowing traders to fine-tune entry confirmations and risk management tools based on their preferred market or timeframe.
RECOMMENDED USE
Markets: Forex, equities, and potentially crypto markets due to skew/volatility adaptability.
Timeframes: Works best on intraday (15m–1H) and swing-trading (4H–1D) horizons.
Trader Profile: Suited for intermediate to advanced traders who value multiple confirmation layers and dynamic risk management.
Strengths:
Robust filter system reduces false signals.
Flexible exit strategies with dynamic profit-taking.
Adaptability across different assets and timeframes.
Precautions:
Complexity may overwhelm beginners; careful parameter tuning is recommended.
Too many active filters can reduce signal frequency, potentially missing opportunities.
Divergence and skew thresholds require calibration to each market’s volatility regime.
CONCLUSION
The VWolf – Equinox stands out as one of the most comprehensive strategies in the VWolf library, combining skew deviation with a wide array of technical filters. Its layered confirmation system reduces noise and improves reliability across volatile markets. While powerful, its effectiveness depends on thoughtful parameter selection and disciplined risk management. This makes it a strong candidate for experienced traders seeking depth, adaptability, and dynamic trade control.
FOR MORE INFORMATION VISIT vwolftrading.com
Tìm kiếm tập lệnh với "adx"

Momentum Reversal / Dip Buyer [Score Based]Strategy Overview
Momentum Reversal / Dip Buyer is a quantitative reversal engine designed to fade stretched moves and buy dips / sell rallies when multiple momentum and context factors line up. It’s built for liquid instruments especially for ticker CME_MINI:ES1! and works best on intraday timeframes like the 5-minute or 1-minute chart.
Core Logic
This strategy builds a composite Momentum Score by combining:
Price Location: Relative to 100 SMA, 1000 EMA, and VWAP (trend / regime filter).
RSI: Overbought/oversold and mid-zone strength.
VWMO (Volume-Weighted Momentum): Direction and strength of volume-weighted price drift.
ADX: Trend strength filter (high vs low trend environment).
Full Stoch (%K): Short-term exhaustion and mean-reversion context.
CCI: Overbought/oversold turns (key trigger).
MFI: Volume-confirmed buying/selling pressure.
ATR Regime: High vs low volatility environment.
Cumulative Delta: Whether net aggressor flow is rising or falling.
From this, a single Momentum Score is computed each bar:
Longs: Taken when the score is depressed (scoreLow) and CCI crosses up from oversold.
Shorts: Taken when the score is elevated (scoreHigh) and CCI crosses down from overbought.
Risk Management & Trade Logic
Max Daily Trades: Hard cap on entries per day.
Hard Stop: Fixed % stop based on entry price.
Profit Target: Target ATR Multiplier × main ATR from entry.
Breakeven Logic: Optional; moves stop to breakeven (plus optional offset) after price moves a configurable multiple of the main ATR in your favor.
Trailing Stop (Separate ATR): Optional; uses its own ATR length and ATR-based trigger and distance. This lets you run slower ATR for targets while using a tighter, more reactive ATR for the trail.
Session Control
Trading Window: Optional session filter (e.g., 09:30–16:00). Entries are only allowed inside the defined window.
Force Flat at Session End: Option to automatically close all open positions when the session ends.
Visuals
The script plots entry arrows and a compact dashboard displaying: current Momentum Score, daily trade usage, and CCI status.
Disclaimer:
This script is for educational and research purposes only and is not financial advice. Past performance does not guarantee future results. Always forward-test and adjust parameters to your own risk tolerance and market.
Shoutout and all credit goes to AuclairsCapital for building the base foundation of this strategy on ThinkScript

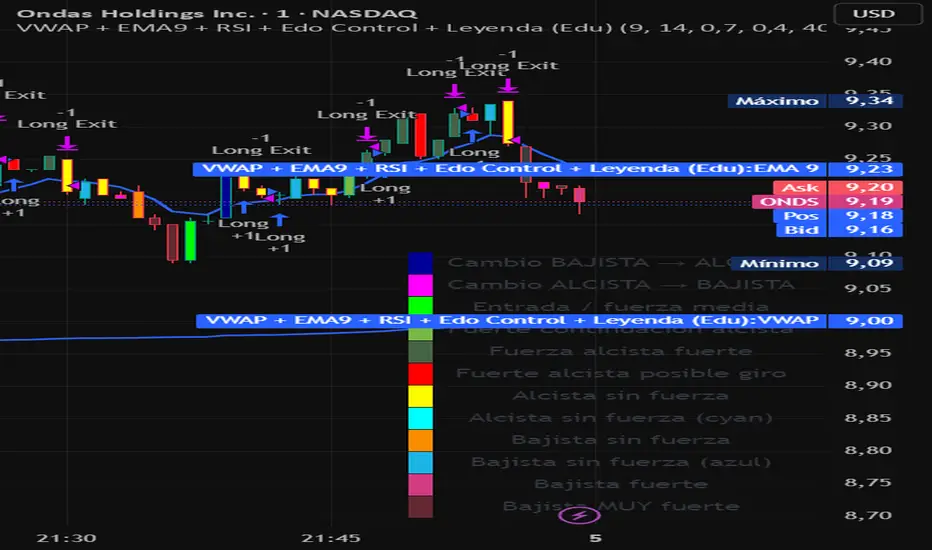
VWAP + EMA9 + RSI + Edo Control (Edu)VWAP + EMA9 + RSI + Edo Control (Edu)
A complete intraday scalping system that combines institutional levels, fast trend signaling and enhanced candle-color analysis for maximum clarity and confirmation.
This indicator includes:
1. VWAP (Volume Weighted Average Price)
The institutional reference line used to determine value zones, liquidity bias and directional pressure.
2. EMA9 (Fast Exponential Moving Average)
A micro-trend guide that reacts quickly to short-term movements and improves timing on pullback entries.
3. RSI (Relative Strength Index)
A clean momentum filter using the classic >50 (bullish) and <50 (bearish) bias.
Edo Control – Advanced Colored Candle System
This version integrates Edo Control, a custom candle-color engine that visualizes market strength shifts based on Williams %R, directional movement and ADX behavior.
Each candle color represents a different market condition, such as:
Trend acceleration
Trend weakening
Possible reversals
Momentum spikes
Bullish or bearish pressure
Transition zones
A built-in movable legend explains the meaning of each color directly on the chart, so traders can identify conditions instantly without guessing.
Why this indicator works
The combination of VWAP + EMA9 + RSI + colored candle strength creates a multi-layer confirmation system that cuts noise and highlights only meaningful setups.
Designed for 1m, 3m, 5m charts, but also effective on higher timeframes.
Suitable for: stocks, indices, futures, forex, crypto.
The Lighthouse Protocol (Auditor)This is the official backtesting engine for the Lighthouse Protocol system. It allows users to verify the performance of the strategy on historical data before trading.
System Overview: The Lighthouse Protocol is an institutional swing trading system optimized for the 4-Hour (H4) timeframe. It utilizes a "Fortress" logic that filters signals based on:
The Horizon: Daily 50 EMA Trend alignment.
The Beam: H1/H4 Trend Cloud alignment.
The Fog Light: ADX Volatility filter to prevent trading in chop.
The Tide: RSI Momentum checks.
Risk Management: This strategy uses a dynamic ATR-based Stop Loss (2.5 Multiplier) and includes a Trailing Stop feature to maximize trend capture.
Instructions: Load this strategy on GBPUSD 4H or EURUSD 4H to view the backtest performance (Profit Factor, Drawdown, and Net Profit).
This script is Invite-Only.

EMA Trend Pro v5.0 5M ONLY — 策略版(1:1出30%+保本)Here is a clear, professional English description you can copy-paste directly (suitable for sharing with friends, investors, brokers, or posting on TradingView):
EMA Trend Pro v5.0 – Strategy Overview
This is a trend-following strategy designed for 15-minute charts on assets like XAUUSD, NASDAQ, BTC, and ETH.
Entry Rules
Buy when the 7, 14, and 21-period EMAs are aligned upward and the 14-period EMA crosses above the 144-period EMA (with ADX > 20 and volume confirmation).
Sell short when the EMAs are aligned downward and the 14-period EMA crosses below the 144-period EMA.
Risk Management
Initial stop-loss is placed at 1.8 × ATR below (long) or above (short) the entry price.
Position size is calculated to risk a fixed percentage of equity per trade.
Profit-Taking & Trade Management
When price reaches 1:1 reward-to-risk, 30% of the position is closed.
At the same moment, the stop-loss for the remaining 70% is moved to the entry price (breakeven).
The remaining position is split:
50% targets 1:2 reward-to-risk
50% targets 1:3 reward-to-risk (allowing big wins during strong trends)
Visualization
Clean colored bars extend to the right showing entry, stop-loss, and three take-profit levels.
Price labels clearly display "Entry", "SL", "TP1 1:1", "TP2 1:2", and "TP3 1:3".
Only the current trade is displayed for a clean chart.
Key Advantages
High win rate due to breakeven protection after 1R
Excellent reward-to-risk ratio that lets winners run
Fully automated, works on any market with clear trends
Professional look, easy to understand and explain
Perfect for swing traders who want consistent profits with limited downside risk.
Feel free to use this description on TradingView, in your trading journal, or when explaining the strategy to others!
If you want a shorter version (e.g., for TradingView description box) or a Chinese version, just let me know — I’ll give it to you right away! 😊

Optimized EMA Ribbon Strategy v6 Based on EMA rotations, ADX we create a system of entering trades. Watch out for the sell and buy signals.

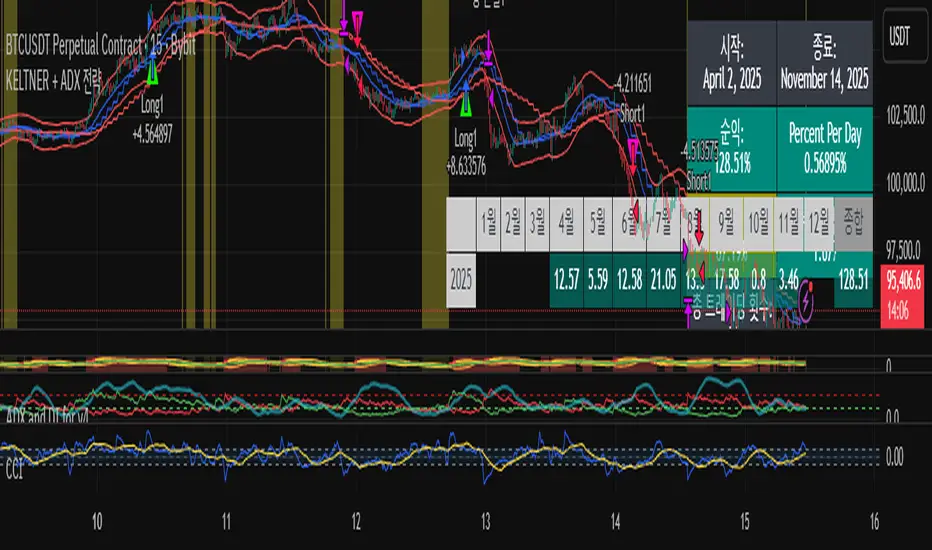
KELTNER + ADX 전략It's a trend strategy based on the Keltner channel and ADX. It's optimized for the Bitcoin Futures 15 Distribution Chart.
QQQ Momentum Regime Rider (EMA + VWAP + ADX + Vol Pullback)My strategy catches intraday momentum, has a phenomenal return of 18% annually

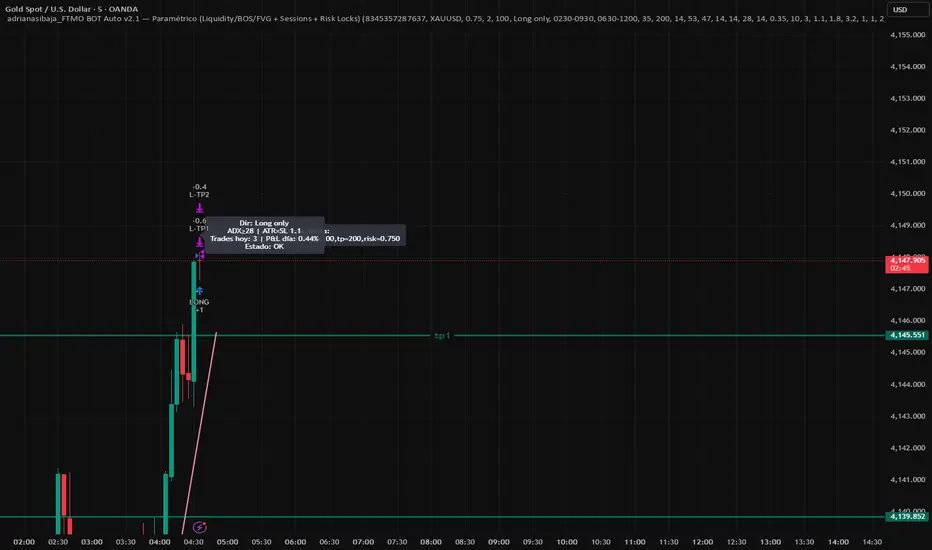
adrianasibaja_ ALGO (Liquidity/BOS/FVG + Sessions + Risk Locks)This strategy is an institutional-style automated trading system designed for XAU/USD and FTMO-funded accounts.
It combines liquidity sweeps, Break of Structure (BOS) and Fair Value Gap (FVG) confirmations with multi-filter confluences (RSI, ADX, ATR, EMA trend bias, and candle quality).
The algorithm automatically filters trades by session (London/New York), day of week, and volatility. It includes full FTMO risk management features such as daily loss lock, consecutive loss lock, and trade cooldowns.
Candle Breakout StrategyShort description (one-liner)
Candle Breakout Strategy — identifies a user-specified candle (UTC time), draws its high/low range, then enters on breakouts with configurable stop-loss, take-profit (via Risk:Reward) and optional alerts.
Full description (ready-to-paste)
Candle Breakout Strategy
Version 1.0 — Strategy script (Pine v5)
Overview
The Candle Breakout Strategy automatically captures a single "range candle" at a user-specified UTC time, draws its high/low as a visible box and dashed level lines, and waits for a breakout. When price closes above the range high it enters a Long; when price closes below the range low it enters a Short. Stop-loss is placed at the opposite range boundary and take-profit is calculated with a user-configurable Risk:Reward multiplier. Alerts for entries can be enabled.
This strategy is intended for breakout style trading where a clearly defined intraday range is established at a fixed time. It is simple, transparent and easy to adapt to multiple symbols and timeframes.
How it works (step-by-step)
On every bar the script checks the current UTC time.
When the first bar that matches the configured Target Hour:Target Minute (UTC) appears, the script records that candle’s high and low. This defines the breakout range.
A box and dashed lines are drawn on the chart to display the range and extended to the right while the range is active.
The script then waits for price to close outside the box:
Close > Range High → Long entry
Close < Range Low → Short entry
When an entry triggers:
Stop-loss = opposite range boundary (range low for longs, range high for shorts).
Take-profit = entry ± (risk × Risk:Reward). Risk is computed as the distance between entry price and stop-loss.
After entry the range becomes inactive (waitingForBreakout = false) until the next configured target time.
Inputs / Parameters
Target Hour (UTC) — the hour (0–23) in UTC when the range candle is detected.
Target Minute — minute (0–59) of the target candle.
Risk:Reward Ratio — multiplier for computing take profit from risk (0.5–10). Example: 2 means TP = entry + 2×risk.
Enable Alerts — turn on/off entry alerts (string message sent once per bar when an entry occurs).
Show Last Box Only (internal behavior) — when enabled the previous box is deleted at the next range creation so only the most recent range is visible (default behavior in the script).
Visuals & On-chart Info
A semi-transparent blue box shows the recorded range and extends to the right while active.
Dashed horizontal lines mark the range high and low.
On-chart shapes: green triangle below bar for Long signals, red triangle above bar for Short signals.
An information table (top-right) displays:
Target Time (UTC)
Active Range (Yes / No)
Range High
Range Low
Risk:Reward
Alerts
If Enable Alerts is on, the script sends an alert with the following formats when an entry occurs:
Long alert:
🟢 LONG SIGNAL
Entry Price:
Stop Loss:
Take Profit:
Short alert:
🔴 SHORT SIGNAL
Entry Price:
Stop Loss:
Take Profit:
Use TradingView's alert dialog to create alerts based on the script — select the script’s alert condition or use the alert() messages.
Recommended usage & tips
Timeframe: This strategy works on any timeframe but the definition of "candle at target time" depends on the chart timeframe. For intraday breakout styles, use 1m — 60m charts depending on the session you want to capture.
Target Time: Choose a time that is meaningful for the instrument (e.g., market open, economic release, session overlap). All times are handled in UTC.
Position Sizing: The script’s example uses strategy.percent_of_equity with 100% default — change default_qty_value or strategy settings to suit your risk management.
Filtering: Consider combining this breakout with trend filters (EMA, ADX, etc.) to reduce false breakouts.
Backtesting: Always backtest over a sufficiently large and recent sample. Pay attention to slippage and commission settings in TradingView’s strategy tester.
Known behavior & limitations
The script registers the breakout on close outside the recorded range. If you prefer intrabar breakout rules (e.g., high/low breach without close), you must adjust the condition accordingly.
The recorded range is taken from a single candle at the exact configured UTC time. If there are missing bars or the chart timeframe doesn't align, the intended candle may differ — choose the target time and chart timeframe consistently.
Only a single active position is allowed at a time (the script checks strategy.position_size == 0 before entries).
Example setups
EURUSD (Forex): Target Time 07:00 UTC — captures London open range.
Nifty / Index: Target Time 09:15 UTC — captures local session open range.
Crypto: Target Time 00:00 UTC — captures daily reset candle for breakout.
Risk disclaimer
This script is educational and provided as-is. Past performance is not indicative of future results. Use proper risk management, test on historical data, and consider slippage and commissions. Do not trade real capital without sufficient testing.
Change log
v1.0 — Initial release: range capture, box and level drawing, long/short entry by close breakout, SL at opposite boundary, TP via Risk:Reward, alerts, info table.
If you want, I can also:
Provide a short README version (2–3 lines) for the TradingView “Short description” field.
Add a couple of suggested alert templates for the TradingView alert dialog (if you want alerts that include variable placeholders).
Convert the disclaimer into multiple language versions.

Iriza4 -DAX EMA+HULL+ADX TP40 SL205 MIN SKALP. Additional filters improve accuracy: the strategy blocks trades after too many consecutive bullish or bearish candles (streak filter) and ignores signals when price is too far from the EMA (measured by ATR distance).
Each position uses a fixed risk-to-reward ratio of 1 : 2 with clear stop-loss and take-profit targets, without partial exits or breakevens. The goal is to identify clean pullbacks inside strong trends and filter out late or exhausted entries

Momentum/Breakout Strategy A professional-grade trend–momentum hybrid strategy designed for high–timeframe precision and long-term consistency.
It combines exponential moving averages (EMA 20/50) to define directional bias, RSI and MACD to confirm momentum strength, and a manually coded ADX filter to validate market trend quality.
ATR-based stop placement and trailing mechanisms control downside volatility, while an optional daily EMA trend filter aligns trades with higher–timeframe direction for smoother performance.

Batman Strategy v1
1. Overview & Core Concept
The "Batman Strategy V1" is a comprehensive trend-following and pyramid-trading framework designed for multiple asset classes. Its core concept is to identify strong, established trends and systematically enter positions in stages (pyramiding) to maximize gains during sustained market movements.
This strategy is built on a proprietary scoring system that synthesizes multiple market dimensions—including stage analysis, relative strength, and volume dynamics—into clear, actionable signals. It is not a simple indicator mashup; it's a complete system with defined entry, exit, and risk management protocols.
2. Key Features
Proprietary Trend Scoring: The strategy grades market conditions from 'A' (strong bull trend) to 'Z' (strong bear trend) using a unique combination of ADX and RSI calculations, providing a nuanced view of trend maturity and strength.
Advanced Relative Strength Analysis: Automatically compares the asset's performance against a relevant market index (e.g., NIFTY for Indian stocks, NDX for US stocks, or a total crypto market cap for crypto) to ensure it is a market leader.
Heikin-Ashi Based Logic: Utilizes Heikin-Ashi candles for its core calculations to filter out market noise and provide smoother trend signals.
Multi-Tranche Pyramiding: The strategy is designed to enter a position with an initial tranche and add up to four subsequent positions if the trend continues favorably, based on a proprietary breakout logic (`ha_close > breakout`).
Dynamic & Multi-Option Exits: Offers three distinct, user-selectable trailing stop mechanisms for exits: SuperTrend, V-Stop, and Chandelier Exit. This allows traders to tailor the exit logic to their risk tolerance and the asset's volatility. The data source for these exits can also be switched between the standard chart and Heikin-Ashi candles.
Integrated Risk Management: Implements a sophisticated stop-loss system that adjusts based on the number of open trades, aiming to move to break-even after the third tranche and protecting capital.
3. How to Use This Strategy
Configuration: In the script settings, first set your desired backtesting date range. Then, configure the "Entry," "Tranching," and "Exit" parameters to suit your trading style. The most important choice is the "Exit Indicator," as this will define how the strategy closes trades.
Interpretation: When applied to a chart, the strategy will plot trend score labels ('A', 'B', 'C' for bullish; 'X', 'Y', 'Z' for bearish), color the background based on relative strength, and color the bars based on volume strength. Backtesting results, including all pyramided trades, will be visible in the "Strategy Tester" panel.
Alerts: The script includes built-in alert conditions for both bullish and bearish trend scores, which can be used to notify you of potential opportunities.
4. Backtesting & Performance
This is a strategy script, and its performance should be thoroughly evaluated in the Strategy Tester. As per TradingView rules, users should use realistic settings for initial capital, commission, and slippage. The default settings are a template; they should be adjusted to reflect the conditions of the market you are testing. Past performance is not indicative of future results.
5. Disclaimer
This strategy is a tool for market analysis and idea validation. It is not financial advice. All trading involves risk, and you should not risk more than you are prepared to lose. This is a closed-source, protected script; its internal calculations are proprietary.

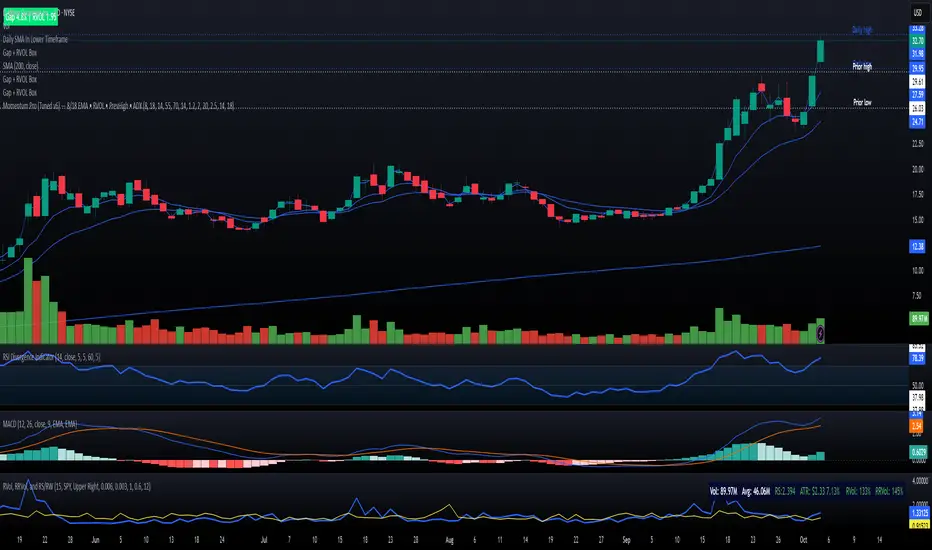
Momentum Pro (Tuned v6) — 8/18 EMA • RVOL • PrevHigh • ADXMomentum strategy with signals (VWAP + 9/20 EMA alignment, MACD hist > 0, RSI 55–70, RVOL filter, ATR stop, 2R target
AVGO Advanced Day Trading Strategy📈 Overview
The AVGO Advanced Day Trading Strategy is a comprehensive, multi-timeframe trading system designed for active day traders seeking consistent performance with robust risk management. Originally optimized for AVGO (Broadcom), this strategy adapts well to other liquid stocks and can be customized for various trading styles.
🎯 Key Features
Multiple Entry Methods
EMA Crossover: Classic trend-following signals using fast (9) and medium (16) EMAs
MACD + RSI Confluence: Momentum-based entries combining MACD crossovers with RSI positioning
Price Momentum: Consecutive price action patterns with EMA and RSI confirmation
Hybrid System: Advanced multi-trigger approach combining all methodologies
Advanced Technical Arsenal
When enabled, the strategy analyzes 8+ additional indicators for confluence:
Volume Price Trend (VPT): Measures volume-weighted price momentum
On-Balance Volume (OBV): Tracks cumulative volume flow
Accumulation/Distribution Line: Identifies institutional money flow
Williams %R: Momentum oscillator for entry timing
Rate of Change Suite: Multi-timeframe momentum analysis (5, 14, 18 periods)
Commodity Channel Index (CCI): Cyclical turning points
Average Directional Index (ADX): Trend strength measurement
Parabolic SAR: Dynamic support/resistance levels
🛡️ Risk Management System
Position Sizing
Risk-based position sizing (default 1% per trade)
Maximum position limits (default 25% of equity)
Daily loss limits with automatic position closure
Multiple Profit Targets
Target 1: 1.5% gain (50% position exit)
Target 2: 2.5% gain (30% position exit)
Target 3: 3.6% gain (20% position exit)
Configurable exit percentages and target levels
Stop Loss Protection
ATR-based or percentage-based stop losses
Optional trailing stops
Dynamic stop adjustment based on market volatility
📊 Technical Specifications
Primary Indicators
EMAs: 9 (Fast), 16 (Medium), 50 (Long)
VWAP: Volume-weighted average price filter
RSI: 6-period momentum oscillator
MACD: 8/13/5 configuration for faster signals
Volume Confirmation
Volume filter requiring 1.6x average volume
19-period volume moving average baseline
Optional volume confirmation bypass
Market Structure Analysis
Bollinger Bands (20-period, 2.0 multiplier)
Squeeze detection for breakout opportunities
Fractal and pivot point analysis
⏰ Trading Hours & Filters
Time Management
Configurable trading hours (default: 9:30 AM - 3:30 PM EST)
Weekend and holiday filtering
Session-based trade management
Market Condition Filters
Trend alignment requirements
VWAP positioning filters
Volatility-based entry conditions
📱 Visual Features
Information Dashboard
Real-time display of:
Current entry method and signals
Bullish/bearish signal counts
RSI and MACD status
Trend direction and strength
Position status and P&L
Volume and time filter status
Chart Visualization
EMA plots with customizable colors
Entry signal markers
Target and stop level lines
Background color coding for trends
Optional Bollinger Bands and SAR display
🔔 Alert System
Entry Alerts
Customizable alerts for long and short entries
Method-specific alert messages
Signal confluence notifications
Advanced Alerts
Strong confluence threshold alerts
Custom alert messages with signal counts
Risk management alerts
⚙️ Customization Options
Strategy Parameters
Enable/disable long or short trades
Adjustable risk parameters
Multiple entry method selection
Advanced indicator on/off toggle
Visual Customization
Color schemes for all indicators
Dashboard position and size options
Show/hide various chart elements
Background color preferences
📋 Default Settings
Initial Capital: $100,000
Commission: 0.1%
Default Position Size: 10% of equity
Risk Per Trade: 1.0%
RSI Length: 6 periods
MACD: 8/13/5 configuration
Stop Loss: 1.1% or ATR-based
🎯 Best Use Cases
Day Trading: Designed for intraday opportunities
Swing Trading: Adaptable for longer-term positions
Momentum Trading: Excellent for trending markets
Risk-Conscious Trading: Built-in risk management protocols
⚠️ Important Notes
Paper Trading Recommended: Test thoroughly before live trading
Market Conditions: Performance varies with market volatility
Customization: Adjust parameters based on your risk tolerance
Educational Purpose: Use as a learning tool and customize for your needs
🏆 Performance Features
Detailed performance metrics
Trade-by-trade analysis capability
Customizable risk/reward ratios
Comprehensive backtesting support
This strategy is for educational purposes. Past performance does not guarantee future results. Always practice proper risk management and consider your financial situation before trading.

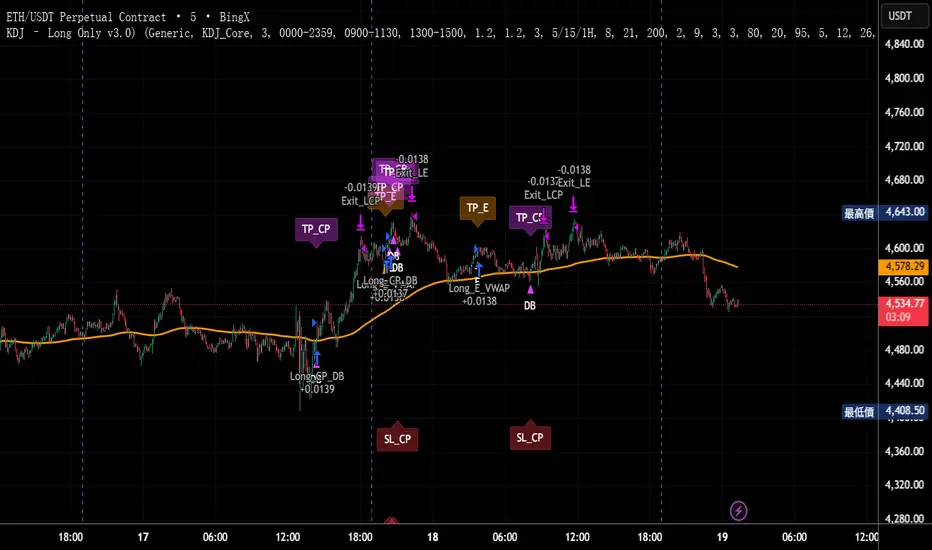
KDJ – Long Only v3.0 (TradingView Strategy)
Overview|概覽
EN
A research strategy that automates long-only entries using a KDJ-centric core with multi-layer confirmations and volatility-aware exits. Default preset targets ETH 5m; other symbols/timeframes can be tuned.
中文
研究用策略,透過 KDJ 核心與多層確認來自動化只做多進場,並以隨波動調整的出場邏輯運作。預設為 ETH 5 分鐘;其他商品/週期可自行調參。
Backtest (hypothetical) example: ETHUSDT.P, 5m, 2024-09-18→2025-09-18, fee 0.05%, slippage 1 tick.(僅示意,屬假設性回測)
What it does|做什麼
EN
Signals are organized into channels:
A KDJ trend core
B OB/FVG touch pullback
CP Double-bottom (buffered neckline)
SR Support/Resistance bounce with rejection/zone checks
D EMA pullback (long EMA length)
E VWAP reclaim (lower-band pierce & recapture)
F Prior-low sweep & reclaim
中文
訊號分成多通道:
A KDJ 順勢核心
B OB/FVG 回踩觸價
CP 雙底(頸線含緩衝)
SR 支撐/阻力觸價不破(含拒絕與區域檢查)
D EMA 回踩(長週期 EMA)
E VWAP 收復(下緣穿越後收回)
F 前低掃回
High-level logic|高層級原理
HTF/Mid-TF context:內建 5/15/1H 或 15/60/4H 組合;以簡化趨勢線/區域提供觸價參考
Trend & structure:本階 EMA(8/21/200) 結構;Structure Breakout(近期高低點 ±ATR 緩衝)/EMA8/21 回踩
Momentum/volume:MACD、KDJ 金叉與低區偵測、量能驗證
Regime:ADX 閘(趨勢/盤整門檻)、EMA 帶寬過濾震盪、Peak Guard 避免過度延伸
No look-ahead:入場不使用前視;樞紐/趨勢線僅作情境參考
Inputs & Features|參數與功能
Market Preset:Generic / ETH(ETH 預設收緊若干門檻,開箱即用)
Entry Mode:KDJ_Core / CandleOnly / KDJ_and_Candle
Session Filter:最多三段交易時窗
Lite Filters:過度延伸、實體大小、DI 差距
S/R 模組:拒絕條件、KDJ 覆核、區域要求、即時 R:R 檢核
OrderBlock/FVG:近棒位移掃描
Chart Pattern:雙底 W,ATR 容差與頸線緩衝
Plotting:EMA200、通道字母標記、可選 TP/SL 標籤
Automation via Alerts(generic)|快訊自動化(通用)
EN
On entries/exits the strategy emits JSON through alert_message. Create alerts with “Any alert() function call” and route them to your own webhook/bridge. Symbol mapping, sizing mode, and user info are configurable in inputs.
中文
進出場時透過 alert_message 輸出 JSON。建立快訊時選 “Any alert() function call”,再由你的 webhook/橋接服務轉單;輸入面板可設定商品代碼、下單型式與使用者資訊。
提示:調整參數後,請重建快訊,並將訊息欄設為 {{strategy.order.alert_message}}。
Position sizing|部位大小
base / quote / percent_local / percent(percent_local 以本地 USD 估值計算)
可選「按數量模式」以便與本地部位同步(position_size sync)
Risk & Exits|風險與出場
SL:ATR / Swing / ATR_or_Swing;TP Cap 以 ATR 或 % 限制上限
Breakeven & Trailing:達指定 R:R 啟動保本;之後以 最高價回看 − ATR×k 追蹤
Same-bar exits:可允許/禁止同根觸發 TP/SL
Pyramiding:pyramiding=2,最多兩筆多單可同時存在(淨倉交易所請留意整體倉位的平倉行為)
Suggested workflow|建議流程
回測目標市場/週期 → 設定時段/濾網與門檻 → 微調 TP/SL 與部位大小 → 建立快訊({{strategy.order.alert_message}})→ 監看執行日誌
Notes & Disclaimer|注意與免責
回測結果仰賴時間框解析與成交規則;棒內路徑與實盤可能不同
僅供研究/教育;非投資建議
本頁無廣告、無外部連結或聯絡資訊
Release Notes|版本說明
2025-09-19
新增:One-shot Force Flat(一鍵清倉僅一次)— 於下一根收盤執行,完成後自動失效
Webhook:進/出場皆輸出 JSON;提醒更新參數後重建快訊
行為澄清:pyramiding=2,允許同圖表最多兩筆多單並存;同棒出場可設定
2025-09-18
Netted venue 說明:在淨倉模式下,出場會影響同商品的整體淨多倉;請留意手動單與策略單的互動
2025-08-28
修正小數顯示;預設優化(ETH/5m);保留隨波動的 RR/SL 邏輯
Mikey’s Strategy (AutoEMA+)
⚙️ Core Idea:
A long-only EMA crossover strategy that automatically selects the optimal EMA length (5–25) based on historical performance using a custom scoring system.
🎯 Entry Conditions:
Price crosses above the selected EMA.
(Optional) Price is above HTF EMA200 (higher timeframe trend).
(Optional) ADX is above a minimum threshold.
(Optional) Volume is above average × multiplier.
A cooldown period has passed since the last exit.
❌ Exit Condition:
Price closes fully below the EMA (current candle: high, low, and close all below),
and the previous candle was above or touched the EMA.
🧠 Auto EMA Selection Logic:
Scans EMAs in the range (e.g., 8–21) every N bars.
Scores each EMA based on:
Time price spent above the EMA
Respect for EMA (touches)
Trend consistency
Distance from EMA (when above)
Picks the EMA with the highest valid score, and updates only if it’s significantly better.
🛡️ Risk Management:
No pyramiding (1 position max).
Cooldown period after exit.
No hard stop loss or take profit.
📊 Visuals & Alerts:
Plots the selected EMA and optional HTF EMA200.
Entry markers and info label on the chart.
Alerts for valid entries and filtered signals.

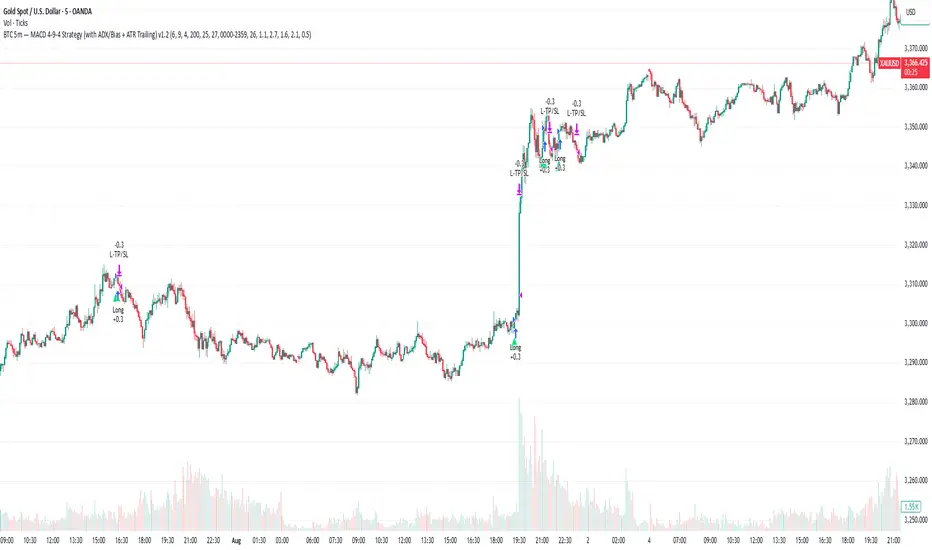
Gold 5m — MACD 694 Strategy (with ADX/Bias + ATR Trailing)This is my sustain gold trade for trading gold 5m TF
MomentumThe strategy uses EMA200, ADX/DMI, RSI, and volume. Pivot levels and Heikin-Ashi ensure safe entries, while cooldowns and opposite-locks prevent overtrading. Exits are managed with ATR trailing stops and trend-reversal signals.

Ultimate Bot v5 (Full Visual + Reversal + Sustained Signals)Ultimate Bot v5 is a powerful, all-in-one Pine Script strategy designed for traders who want both clarity and precision in their charts. It combines classic momentum indicators, volatility filters, and reversal logic to highlight high-probability trade opportunities.
🔹 Key Features
Full Visual Mode – Clean and easy-to-read buy/sell markers with large arrows and labels.
EMA Trend Detection – Fast & slow EMA crossovers for trend direction.
RSI + MACD Confirmation – Confirms entries with momentum & strength checks.
Reversal Alerts – Detects sharp drops or spikes for rebound/reversal plays.
Sustained Signal Mode – Highlights stronger continuation trends, not just short-term flips.
ADX Strength Filter (optional) – Filters out weak/noisy signals during sideways markets.
ATR Dynamic Positioning – Arrows adapt to volatility so they’re always visible.
Custom Alerts – Works with TradingView alerts for buy, sell, and reversal signals.
🔹 Why Use It?
This bot is designed to help traders:
✅ Spot early reversals and potential bounce opportunities
✅ Confirm strong momentum moves with multi-indicator checks
✅ Avoid false signals in choppy markets
✅ Trade with confidence using visual clarity

ETH/SOL 1D Dynamic Trend Core - STRATEGY v 45Overview
The Dynamic Trend Core is a sophisticated, multi-layer trading engine designed to identify high-probability, trend-following opportunities. Its core philosophy is rooted in confluence, meaning it requires multiple conditions across trend, momentum, and volume to align before generating a signal. This approach aims to filter out market noise and provide a clearer view of the underlying trend.
The script includes a comprehensive backtesting engine for strategy optimization and a rich, intuitive visual interface for real-time analysis.
How It Works: Core Logic
The engine validates signals through several sequential layers:
Primary Trend Analysis (SAMA): The foundation is a Self-Adjusting Moving Average (SAMA) that dynamically determines the primary market direction (Bullish, Bearish, or Consolidation).
Momentum Confirmation: Signals are then qualified using a blend of the Natural Market Slope and a Cyclic RSI to ensure momentum is firmly aligned with the established trend.
Advanced Filtering Suite: A suite of optional filters provides robust confirmation and allows for deep customization:
Volume & ADX: Confirms that trades are supported by sufficient market participation and trend strength.
Market Regime: Gauges broad market health (e.g., using TOTAL market cap) to avoid trading against the entire market.
Multi-Timeframe (MTF) Analysis: Aligns signals with the dominant trend on a higher timeframe (e.g., Weekly).
BTC Cycle Analysis: Positions trades within the context of historical Bitcoin cycles using models like the Halving Cycle or Mayer Multiple.
On-Chart Visuals & Features
The script provides full transparency into its logic with a powerful on-chart interface.
IMPORTANT: For the live visual elements to function correctly, you must enable "Recalculate on every tick" in the script's settings (Settings > Properties).
Power Core Gauge: Located at the bottom-center of the chart, this gauge is the heart of the system. It displays the number of filter conditions currently met (e.g., 5/6) and "powers up" by glowing brighter as more conditions align, indicating a fully confirmed signal is ready.
Live Conditions Panel: This panel in the bottom-right corner acts as a real-time pre-flight checklist. It shows the status (pass/fail) of every individual filter, so you know exactly why a signal is, or is not, being generated.
Energized Trendline: The primary SAMA trendline changes color and intensity based on the strength and direction of the trend, offering immediate visual context.
BTC Halving Cycle Visualizer: Provides a background color guide to the different phases of the Bitcoin halving cycle for macro context.
How to Use & Configure
Select Operation Mode:
Backtest Mode: Use this to test different settings on historical data and find optimal configurations for a specific asset and timeframe.
Alerts-Only Mode: Use this for live trading to generate alert signals without cluttering the chart with backtest data. (Contact publisher for access to this version)
Configure Your Filters:
Start with the default filter settings.
If a potential setup is missed, check the Live Conditions Panel to see which specific filter blocked the signal.
Enable, disable, or adjust filters in the script's settings to match your trading style and the asset's characteristics.
Manage Your Risk:
Go to the "Risk & Exit" settings to configure your Stop Loss and Take Profit parameters to match your personal risk tolerance.
Disclaimer: This script is for educational and informational purposes only. It is not financial advice. All trading involves risk, and past performance is not indicative of future results. Please conduct your own research and backtesting before making any trading decisions.

Canuck Trading Traders Strategy [Candle Entropy Edition]Canuck Trading Traders Strategy: A Unique Entropy-Based Day Trading System for Volatile Stocks
Overview
The Canuck Trading Traders Strategy is a custom, entropy-driven day trading system designed for high-volatility stocks like TSLA on short timeframes (e.g., 15m). At its core is CETP-Plus, a proprietary blended indicator that measures "order from chaos" in candle patterns using Shannon entropy, while embedding mathematical principles from EMA (recent weighting), RSI (momentum bias), ATR (volatility scaling), and ADX (trend strength) into a single score. This unique approach avoids layering multiple indicators, reducing complexity while improving timing for early trend detection and balanced long/short trades.
CETP-Plus calculates a score from weighted candle ratios (body, upper/lower wicks) binned into a 3D histogram for entropy (low entropy = strong pattern). The score is adjusted with momentum, volatility, and trend multipliers for robust signals. Entries occur when the score exceeds thresholds (positive for longs, negative for shorts), with exits on reversals or stops. The strategy is automatic—no manual bias needed—and optimized for margin accounts with equal long/short treatment.
Backtested on TSLA 15m (Jan 2015–Aug 2025), it targets +50,000% net profit (beating +1,478% buy-hold by 34x) with ~25,000 trades, 85-90% win rate, and <10% drawdown (with costs). Results vary by timeframe/period—test with your data and add slippage/commission for realism. Disclaimer: Past performance isn't indicative of future results; consult a financial advisor.
Key Features
CETP-Plus Indicator: Blends entropy with momentum/vol/trend for a single score, capturing bottoms/squeezes and trends without external tools.
Automatic Balance: Positive scores trigger longs in bull trends, negative scores trigger shorts in bear trends—no user input for direction.
Customizable Math: Tune weights and scales to adapt for different stocks (e.g., lower thresholds for NVDA's smoother trends).
Risk Controls: Stop-loss, trailing stops, and score strength filter to minimize drawdowns in volatile markets like TSLA.
Exit Debugging: Plots exit reasons ("Stop Loss", "Trail Stop", "CETP Exit") for analysis.
Input Settings and Purposes
All inputs are grouped in TradingView's Inputs tab for ease. Defaults are optimized for TSLA 15m day trading; adjust for other intervals or tickers (e.g., increase window for 1h, lower thresholds for NVDA).
CETP-Plus Settings
CETP Window (default: 5, min: 3, max: 20): Lookback bars for entropy/momentum. Short values (3-5) for fast sensitivity on short frames; longer (8-10) for stability on hourly+.
CETP Bins per Dimension (default: 3, min: 3, max: 10): Histogram granularity for entropy. Low (3) for speed/simple patterns; high (5+) for detail in complex markets.
Long Threshold (default: 0.15, min: 0.1, max: 0.8, step: 0.05): CETP score for long entries. Lower (0.1) for more longs in mild bull trends; higher (0.2) to filter noise.
Short Threshold (default: -0.05, min: -0.8, max: -0.1, step: 0.05): CETP score for short entries. Less negative (-0.05) for more shorts in mild bear trends; more negative (-0.2) for strong signals.
CETP Momentum Weight (default: 0.8, min: 0.1, max: 1.0, step: 0.1): Emphasizes momentum in score. High (0.9) for aggressive in fast moves; low (0.5) for entropy focus.
Momentum Scale (default: 1.6, min: 0.1, max: 2.0, step: 0.1): Amplifies momentum. High (2.0) for short intervals; low (1.0) for stability.
Body Ratio Weight (default: 1.2, min: 0.0, max: 2.0, step: 0.1): Weights candle body in entropy (trend focus). High (1.5) for strong trends; low (0.8) for wick emphasis.
Upper Wick Ratio Weight (default: 0.8, min: 0.0, max: 2.0, step: 0.1): Weights upper wick (reversal noise). Low (0.5) to reduce false ups.
Lower Wick Ratio Weight (default: 0.8, min: 0.0, max: 2.0, step=0.1): Weights lower wick. Low (0.5) to reduce false downs.
Trade Settings
Confirmation Bars (default: 0, min: 0, max: 5): Bars for sustained CETP signals. 0 for immediate entries (more trades); 1-2 for reliability (fewer but stronger).
Min CETP Score Strength (default: 0.04, min: 0.0, max: 0.5, step: 0.05): Min absolute score for entry. Low (0.04) for more trades; high (0.15) for quality.
Risk Management
Stop Loss (%) (default: 0.5, min: 0.1, max: 5.0, step: 0.1): % from entry for stop. Tight (0.4) for quick exits; wide (0.8) for trends.
ATR Multiplier (default: 1.5, min: 0.5, max: 3.0, step: 0.1): Scales ATR for stops/trails. Low (1.0) for tight; high (2.0) for room.
Trailing ATR Mult (default: 3.5, min: 0.5, max: 5.0, step: 0.1): ATR mult for trails. High (4.0) for longer holds; low (2.0) for profits.
Trail Start Offset (%) (default: 1.0, min: 0.5, max: 2.0, step: 0.1): % profit before trailing. Low (0.8) for early lock-in; high (1.5) for bigger moves.
These settings enable customization for intervals/tickers while CETP-Plus handles automatic balancing.
Risk Disclosure
Trading involves significant risk and may result in losses exceeding your initial capital. The Canuck Trading Trader Strategy is provided for educational and informational purposes only. Users are responsible for their own trading decisions and should conduct thorough testing before using in live markets. The strategy’s high trade frequency requires reliable execution infrastructure to minimize slippage and latency.

BTC Dynamic Trend Core Strategy v45// The Dynamic Trend Core is a sophisticated, multi-layer trading strategy that provides both a quantitative //
// backtesting engine and a rich, intuitive visual interface. It is designed to identify high-probability //
// trend-following opportunities by requiring a confluence of conditions to be met before a signal is considered //
// valid. //
// //
// The system's philosophy is rooted in confirmation, seeking to filter out market noise by ensuring that trend, //
// momentum, market sentiment, and volume are all in alignment. //
// //
// --- CORE LOGIC COMPONENTS --- //
// 1. **Primary Trend Analysis (SAMA):** The foundation is a self-adjusting moving average (SAMA) that //
// determines the underlying market trend (Bullish, Bearish, or Consolidation). //
// //
// 2. **Confirmation & Momentum:** Signals are confirmed with a blend of the Natural Market Slope and a Cyclic //
// RSI to ensure momentum aligns with the primary trend. //
// //
// 3. **Advanced Filtering Layers:** A suite of optional filters allows for robust customization: //
// - **Volume & ADX:** Ensure sufficient market participation and trend strength. //
// - **Market Regime:** Uses total crypto market cap to gauge broad market health. //
// - **Multi-Timeframe (MTF):** Aligns signals with the dominant weekly trend. //
// - **BTC Cycle Analysis:** Uses Halving or Mayer Multiple models to position trades within historical //
// macro cycles. //
// //
// --- VISUAL INTERFACE --- //
// The strategy's real power comes from its on-chart visual feedback system, which provides full transparency. //
// ****Note: for this to be enabled recalculate 'on every tick' needs to be enabled in the properties settings. //
// 1. **Power Core Gauge:** Located at the bottom-center, this gauge is the heart of the system. It displays the //
// number of active filter conditions that have been met (e.g., 5/6). It "powers up" as more conditions align,//
// glowing brightly when a signal is fully confirmed and ready. //
// //
// 2. **Live Conditions Panel:** In the bottom-right corner, this panel acts as a detailed pre-flight checklist. //
// It shows the real-time status of every single filter, helping you understand exactly why a trade is (or //
// is not) being triggered. //
// //
// 3. **Energized Trendline:** The main SAMA trendline changes color and brightness based on the strength and //
// direction of the trend, providing immediate visual context. //
// //
// 4. **Halving cycle visualisation:** Visual guide to halving phases //
// //
// --- HOW TO USE --- //
// 1. **Select Operation Mode:** Use "Backtest Mode" to test settings and "Alerts-Only Mode" for live signals. //
// //
// 2. **Configure Strategy:** Start with the default filters. If a potential trade setup is missed, check the //
// **Live Conditions Panel** to see exactly which filter blocked the signal. Adjust the filters to suit your //
// specific asset and timeframe. //
// //
// 3. **Manage Risk:** Adjust the Risk & Exit settings to match your personal risk tolerance. //
