Pulu's 3 Moving Averages
Pulu's 3 Moving Averages
Release version 1, date 2021-09-28
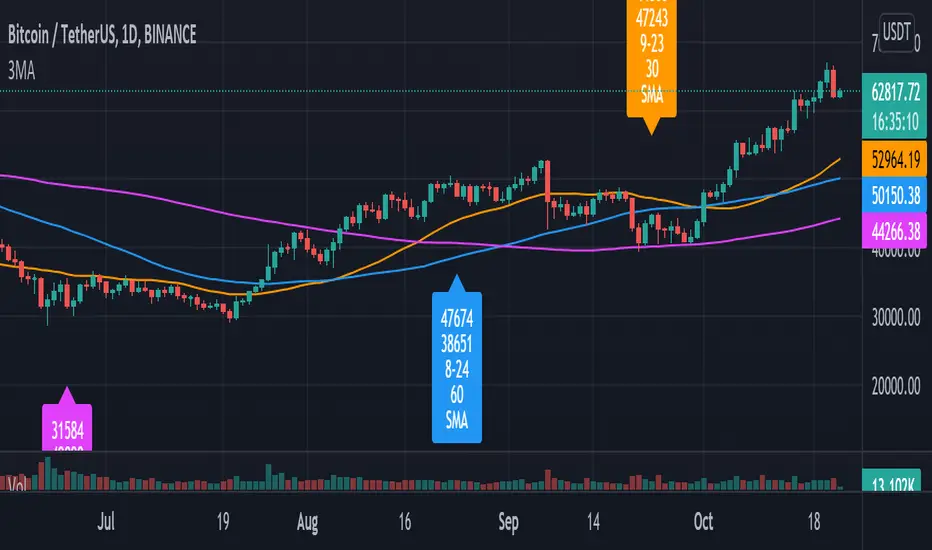
This script allows you to customize three sets of moving averages, turn on/off, set color and parameters. It also tags the start date of the last set of moving average if there is. This, release version 1, supports eight moving average algorithms:
ALMA, Arnaud Legoux Moving Average
EMA, Exponential Moving Average
RMA, Adjusted exponential moving average (aka Wilder’s EMA)
SMA, Simple Moving Average
SWMA, Symmetrically-Weighted Moving Average
VWAP, Volume-Weighted Average Price
VWMA, Volume-Weighted Moving Average
WMA, Weighted Moving Average
The availability and function parameters
Func. Availability Parameters
ALMA
MA1, MA2, MA3
source
length
offset
sigma
EMA
RMA
SMA
VWMA
WMA
MA1, MA2, MA3
source
length
SWMA
VWAP
MA1
source
Parameters
Parameter Description
source the series of values to process. The default is to use the closing price to calculate the moving average.
length an integer value that defines the number of bars to calculate the moving average on. The SWMA and VWAP do not use this parameter.
ALMA offset a floating-point value that controls the tradeoff between smoothness (with a value closer to 1) and responsiveness (with a value closer to 0). This parameter is only used by ALMA.
ALMA sigma a floating-point value that specifies the ALMA’s smoothness. The larger this value, the smoother the moving average is. This parameter is only used by ALMA.
I'm not sure if it is needed, so I do not let the three Moving Averages of the script to have indivial algorithm setting. Because that will involve much complicated condition testing and use up more TradingView script lines limit. If you need to combine different algorithms in the three sets of moving averages, or have other ideas, leave a message to let me know; maybe I will try it in the next update.
我不確定是否需要,所以我沒有讓腳本的三組移動平均線有各別的算法設置。因為這將涉及更多複雜的條件測試,並使用更多 TradingView 腳本列數限制。如果您需要在三組均線中組合不同的算法,或者有其他想法,請留言告訴我;也許我會在下一次更新中嘗試。
Tìm kiếm tập lệnh với "algo"
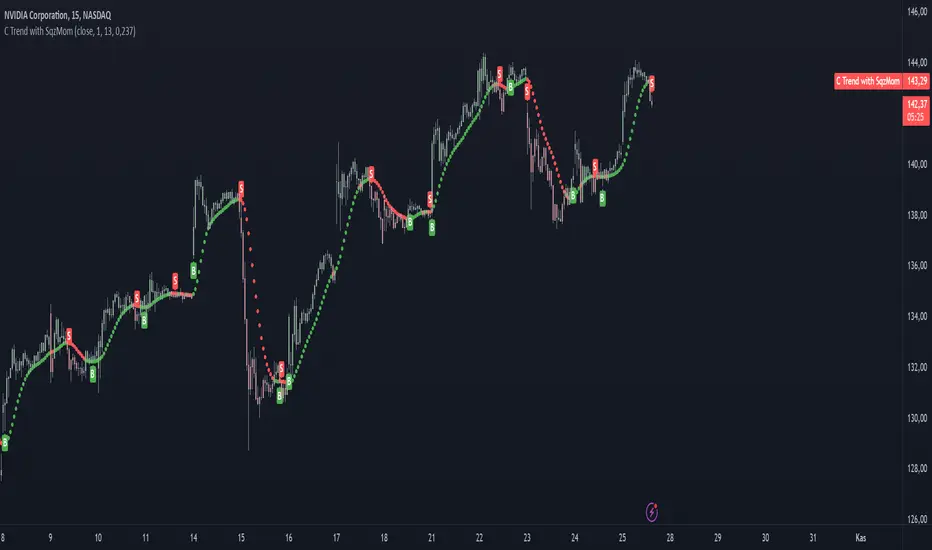
TopTenAlgo 3. Cursor Trend with SQZ MOM(Without Volume Ind.)EN: Indicator Trend is a momentum algorithm that measures the direction of the trend. It recalculates the Volume Weighted Moving Average and Tilson functions included with a certain frequency value according to the closing price and this trend helps us determine trend times. The size of the frequency correction motion. It Looks at the Logarithmic to functions. Is the zigzag of argument correction? otherwise it is a shortcut for a flat / flat correction . You can use the minus frequency value minus in zigzags, while it is handled with lower frequencies in flat or flat corrections . For symbols for which the Volume Indicator cannot be read.
This algorithm is prepared with @Top10Algo ... Improvements have been made regarding short periods.
TR: Gösterge Trend, trendin yönünü ölçen bir momentum algoritmasıdır. İçeriğinde bulunan Volume Weighted Moving Average ve Tilson fonksiyonlarını belli bir frekans değeri ile kapanış fiyatına göre yeniden hesaplar ve bu sayede trend değişim zamanlarını belirlememize yardımcı olur. Frekans değeri düzeltme hareketinin boyutuna göre değişiklik gösterir. Fonsiyonlara Logaritmik bakar.Frekans değerini belirlememizde yardımcı olan argüman düzeltmenin zigzag mı? yoksa yassı/flat bir düzeltmemi olacağını kestirmektir. Zigzaglarda frekans değeri eksi yönde daha fazla büyürken yassı yada flat düzeltmelerde daha düşük frekanslarla ele alınır. Hacim Göstergesinin okunamadığı semboller içindir.
Bu algoritma @Top10Algo ile beraber hazırlanmıştır... Kodlamadaki katkılarından ve yol göstericiliğinden dolayı teşekkürü bir borç bilirim. Kısa Periyotlar için iyileştirmeler yapıldı...

TopTenAlgo 3. Cursor Trend with SQZ MOM (Include Volume Ind.)EN: Indicator Trend is a momentum algorithm that measures the direction of the trend. It recalculates the Volume Weighted Moving Average and Tilson functions included with a certain frequency value according to the closing price and this trend helps us determine trend times. The size of the frequency correction motion. It Looks at the Logarithmic to functions. Is the zigzag of argument correction? otherwise it is a shortcut for a flat / flat correction . You can use the minus frequency value minus in zigzags, while it is handled with lower frequencies in flat or flat corrections .
This algorithm is prepared with @Top10Algo ... Improvements have been made regarding short periods.
TR: Gösterge Trend, trendin yönünü ölçen bir momentum algoritmasıdır. İçeriğinde bulunan Volume Weighted Moving Average ve Tilson fonksiyonlarını belli bir frekans değeri ile kapanış fiyatına göre yeniden hesaplar ve bu sayede trend değişim zamanlarını belirlememize yardımcı olur. Frekans değeri düzeltme hareketinin boyutuna göre değişiklik gösterir. Fonsiyonlara Logaritmik bakar.Frekans değerini belirlememizde yardımcı olan argüman düzeltmenin zigzag mı? yoksa yassı/flat bir düzeltmemi olacağını kestirmektir. Zigzaglarda frekans değeri eksi yönde daha fazla büyürken yassı yada flat düzeltmelerde daha düşük frekanslarla ele alınır.
Bu algoritma @Top10Algo ile beraber hazırlanmıştır... Kodlamadaki katkılarından ve yol göstericiliğinden dolayı teşekkürü bir borç bilirim. Kısa Periyotlar için iyileştirmeler yapıldı...
GA - Value at RiskGA Value at Risk is a multifunctional tool. Its main purpose is to plot on the chart the Value at Risk . But it shows also integrated features related to the Volatility.
Value at Risk is a measure of the risk of loss for investments, given normal market conditions, in a period.
It measures and quantifies the level of financial risk. In this case, the risk is within position over a specific time frame.
Defining p as VaR, the probability of a loss greater than VaR is p, at most. Instead, the probability of loss that is less than VaR is 1-p, at least.
The VaR Breach occurs when a loss exceeds the VaR threshold .
For this case, VaR calculation uses the volatility estimation in a time interval. It defines the Probability Confidence according to the Normal Distribution. VaR is a percentile of the Normal Distribution. This is a multiplier of the Standard Deviation that define a Volatility Range.
The Normal Distribution Area around +- the Standard Deviation gives 68% of Confidence. 2 times the Standard Deviation returns a 95% of probability area. 3 time the Standard Deviation the Area returns 99.7% of Confidence.
Knowing VaR modeling, it is possible to determine the amount of a potential loss . Then, it is possible to know if there is enough capital to cover losses. In the same way, higher-than-acceptable risks forces reducing exposure in a financial instrument.
One of its practical use is to estimate the risk of an investment that is already at portfolio. Indeed, this is the purpose of the Value at Risk calculated in this script.
At the VaR Breach that investment has reached its worst scenario. Then, it can be the case to manage that investment into the balanced portfolio.
The Value at Risk does not tell when to enter the market.
Moving Averages
GA Value at Risk bases its calculations on a set of Moving Averages. Every feature of the script uses one of these Moving Averages for its algorithm.
Moving Averages from MA0 to MA8, are the core of each feature of the script.
By default, from MA0 to MA8, Moving Averages use the Fibonacci Series to define their lengths. This happens because of the power of the Golden Ratio in the market behavior.
Instead, the first moving average is an extra resource. Its purpose is to plot a Signal Line on the chart.
The script does not consider plotting every Moving Average on the chart. But it lets you enable the plotting of 7 Moving Averages (from MA0 to MA5 + Signal Line).
It is possible to select the Moving Average Formula to use in the script. This is a setting that affects every Moving Average. Then, it changes also the result of every feature of the script.
The selection is between:
Exponential Moving Average.
Simple Moving Average.
Weighted moving Average.
Simple Moving Averages and Pointers - Full Visibility
Moving Averages and Partial Visibility
The plotting of each Moving Average can be total or partial.
By default, the plotting of Moving Averages and Signal Line is partial.
When the price approaches a Moving Average a little part of the curve becomes visible. This highlights supports or resistances.
Besides, this tracking remains on the chart. Then it shows supports and resistances that the price reached during its progression.
The Partial Visibility Algorithm is a great advantage, ruling how to plot curves. It uses a parameter to set how much of the curves is to plot.
Exponential Moving Averages and Pointers - Partial Visibility
Exponential Moving Averages and Pointers - Full Visibility
Moving Averages and Pointers
As it is clear, it is not necessary to plot entire curves of Moving Averages on the chart. But it becomes relevant to plot Pointers to Moving Averages.
Indeed, the script plots horizontal segments that point to the latest Average Prices.
Every segment has a Label that shows Average Price, Length, and its related Moving Average (from MA0 to MA8). Besides, it is possible to extend the segment to right.
These pointers are a very useful automatization. They point to the Moving Averages. In this way, they show Dynamic Supports and Resistances as horizontal segments.
They are adaptive. Used together with the Volume Profile their progression approaches Edges of High Nodes.
This adaptive behavior makes easy to see when the price reaches Volume High Nodes and slows down.
Moving Average Pointers use the Partial Visibility Algorithm. In this case, the algorithm shows pointers with higher frequency than curves.
Moving Averages Pointers have:
Horizontal Segment as a Pointer with Arrow.
Label with details.
Circle to the current Average Price.
Weighted Moving Averages and Pointers - Full Visibility
Volatility Channels
Having Moving Averages, from MA0 to MA8, it is possible to plot 9 Volatility Channels.
Each Volatility Channel uses one of the Moving Averages, from MA0 to MA8.
Indeed, each Volatility Channel has the same designation of the Moving Average used.
The Standard Deviation defines the Volatility Range. It uses the length of the Moving Average related to the Volatility Channel.
The Volatility Range is unique for each Volatility Channel. In the same way, each Volatility Channel is unique because of its relation to only one Moving Average.
By default, each volatility channel has the 2 value as Standard Deviation Multiplier. This gives 95% of Confidence that the price will stay into the Volatility Range.
Using the Simple Moving Average, each Volatility Channel becomes a Bollinger Bands envelop.
Volatility Channels work very well even using Exponential or Weighted Moving Averages.
MA0 - Volatility Channel
Volatility Channels - From MA0 to MA8
Value at Risk (VaR)
GA Value at Risk plots VaR according to the volatility. The VaR plotting follows the Trend Momentum or Buying-Selling Waves.
By default, VaR follows the Trend Momentum by 2 times the Standard Deviation of MA0. Where MA0 is the first Moving Average and Volatility Channel of the set.
Besides, by default, the calculation of the Value at Risk is adaptive. It does not follow the Volatility Channel Bands. But it changes according to the fast reaction of the price into the Volatility Range.
By default, VaR follows the main momentum even if the price is moving in opposition to it. This occurs as long as the Trend Momentum persists.
In the settings box, It is possible to select the following of the latest Buying Wave or Selling Wave.
In this case, VaR changes according to the change of Buying Wave or Selling Wave. This means that, on these conditions, VaR follows main swings. Then it follows the weakening and the strengthening of the trend momentum as long as it persists.
The plotting of the Value at Risk can show these features:
Red cycle to show the Value at Risk at the current price.
Look Back Red Line that shows the progression of the Value at Risk.
Label with details.
MA0 - Value at Risk - Not Adaptive
MA0 - Value at Risk - Adaptive
It is possible to use a different Moving Average and Volatility Channel from the set. This affects the calculation and the plotting of the Value at Risk. In this way, the algorithm return the Value at Risk for the short, middle, or long-term.
Then, you can get the Value at Risk for that Financial Instrument, calculated for ~1 year or more so as for 1 month.
The Value at Risk does not tell you when to enter the market. Besides, it does not show you that the trend is changing.
MA3 - Value at Risk - Adaptive
Value at Profit (VaP)
The Value at Profit has a descriptive purpose. It points the Volatility Band that is opposite to the Value at Risk.
I chose Value at Profit as a designation for this feature. It does not tell you where to exit the market.
But is shows what the price progression is pointing on. This happens following the switching between Volatility Ranges.
The VaP follows the Volatility Band where the price tends to converge.
An outperforming or underperforming price is running faster than the average trend. Then when the price runs enough to converge to the Volatility Band, it is over extended or under extended.
At these conditions, the increased buying or selling pressure affects the price behavior. This slows down the price progression.
The Algorithm behind the Value at Profit is adaptive. Then the pointer jumps up and down the Volatility Bands of the 9 Volatility Channels. This occurs according to the price progression, following the switching between Volatility Ranges.
So, the VaP points a Volatility Band as long as the price can have chances to converges on it. Instead, when the price has chances to exceed the Volatility Band, the VaP points to the next one.
The plotting of the Value at Profit occurs enabling its Label with details.
Value at Profit - MA0 Volatility Channel Upper Band
Value at Profit - MA6 Volatility Channel Upper Band
Price Extension
When the price runs far away from the average trend price, GA Value at Risk can plot the price extension.
It shows the distance in percentage of the price from a Moving Average of the set. This tends to highlight conditions where the price is over or under extended.
An overbought or oversold condition precedes the shortening of the Trust. It is a cause of the hesitation of the price to continue its progression. This includes also Climactic Points and Signs of Dominance.
The Price Extension plotting uses a variation of the Partial Visibility Algorithm. It plots the Price Extension Arrow only when there are specific volatility conditions.
When the Partial Visibility is set to 0, the Price Extension Arrow is always visible on the chart.
The plotting of the Price Extension includes a Label with details.
Over Extension - The Price is Outperforming MA0
Under Extension - The Price is Underperforming MA0
Price Extension Coloring for Bars and Line Chart
GA Value at Risk lets you enable the coloring of vertical charts. Green and Red colors mark the over and under extended price on bars, candle sticks, and also on the Line Chart.
The Price Extension Algorithm colors Bars and Line Chart by a momentum function.
Indeed, the coloring happens following Relative Strength Index or Bollinger Bands %B.
These 2 Momentum functions are different. Indeed, they color the chart according to the purpose of their curves.
Coloring the Line Chart, it is necessary to put on front the script visibility.
Overbought and Oversold Conditions on Line Chart by Bollinger Bands %B
Overbought and Oversold Conditions on Candlesticks Chart by Relative Strength Index
Note: I restrict access to the tool. Use the links in my signature field to gain access to the script. Feel free to send me a PM for any question.
Thank you
Girolamo Aloe
Founder of Profiting Me Finance Analytics
-
Disclaimer
Nobody in Girolamo Aloe websites and trading view profile is a Financial Advisor. Nothing therein is intended to be constructed as Financial Advice. The content on his websites is for information and educational purposes only.
Trading carries high risk. You should not invest money that you cannot afford to lose. Past performance is not an indication of future results.

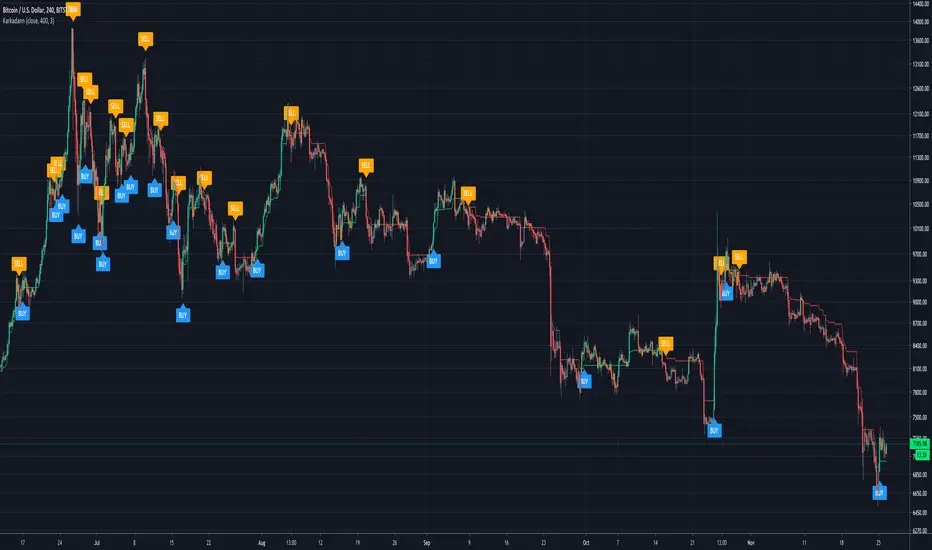
KarkadannKarkadann is an indicator derived from a Naberius trading algorithm. It represents a medium ground between our two other algorithms Mammon and Malphas.
It detects the current trend ranges in the market and prints a suggested entry accordingly at assumed trend channel tops & bottoms upon encountering stalled out price action usually indicative of a retracement. As such, Karakadann can be traded on nearly any timeframe.
This algorithm was developed to trade primarily leveraged XBT; however, after exploring larger alt coins and the more traditional markets outside of cryptocurrency we found that Karkadann does better than the average trader regardless of the pair or ticker being traded at the time. Any core changes to the live trading algorithm will be added to this indicator as they are deployed.
Suggested Methods of Operation:
1. Buy and Sell signals represent a possible trading opportunity. Based on our testing, manual traders should use the 15m - 60m for scalping and 240m - 1D for larger swings.
2. Upon signal print, place your limit orders spread throughout the current candles total body range. DO NOT MARKET IN. DO NOT CHASE. If the limit orders don't fill within the following candle regardless of timeframe being traded remove them and re-evaluate.
3. Use standard candles. Heikin Ashi candles are ok but can be deceiving in times of localized price volatility
4. Trade the trend or wait for extreme price action, counter to the trend, to take up positions.
Call-Put Cross Strike Match [Pro]📊 Call-Put Cross Strike Match - Professional Options Trading Indicator
Advanced NSE Options Analysis with AI-Powered Trading Signals & Dynamic Display
🎯 Overview
The Call-Put Cross Strike Match is an institutional-grade options analysis tool designed exclusively for NSE NIFTY and BANKNIFTY traders. Built on Pine Script v6, this indicator combines sophisticated cross-strike matching algorithms with intelligent trading signal generation to identify optimal options trading opportunities in real-time.
What makes it unique:
Analyzes 25 call-put combinations simultaneously
Generates actionable BUY/SELL signals using professional strategies
Fully customizable display with 9 table positions and 6 size options
Simplified setup with semi-automatic ATM detection
Clean, clutter-free interface with only essential information
Perfect for intraday scalpers, premium sellers, and positional options traders.
✨ Key Features
1. 🔍 Advanced Cross-Strike Matching Algorithm
The indicator calculates price differences for all 25 combinations (5 call strikes × 5 put strikes) and identifies the best matches based on put-call parity.
How it works:
Compares each call option price with every put option price
Calculates absolute difference: |Call - Put |
Ranks all 25 combinations from lowest to highest difference
Highlights top 3 or top 5 matches with visual checkmarks
Visual indicators:
✓✓ (Double check) = Best match (lowest price difference)
✓ (Single check) = Good matches (top 3 or top 5)
Empty cells = No match (significant price difference)
Why this matters:
When Call ≈ Put at same strike, it indicates fair pricing and synthetic position opportunities. The indicator automatically finds these opportunities across different strike combinations.
2. 🎯 Intelligent Trading Signals (Last Column)
The indicator generates professional trading recommendations based on Call-Put price difference analysis:
Signal Types:
BUY CE - Long call opportunity (bullish)
SELL CE - Short call opportunity (premium selling)
BUY PE - Long put opportunity (bearish/hedge)
SELL PE - Short put opportunity (premium selling)
BULL - Moderate bullish bias
BEAR - Moderate bearish bias
ATM - Neutral market (near parity)
NEUTRAL - No clear bias
Color-Coded for Quick Decisions:
🟩 Green = Long opportunities (BUY CE, BULL)
🟥 Red = Short call opportunities (SELL CE)
🟧 Orange = Long put opportunities (BUY PE)
🟫 Maroon = Short put opportunities (SELL PE)
⬛ Gray = Neutral zones (ATM, NEUTRAL)
3. 🤖 Three Professional Signal Modes
SMART Mode (Recommended) 🎯
Context-aware institutional strategy that considers strike position relative to spot price.
Signal Logic:
text
OTM Call Expensive (C-P > threshold, Strike > Spot):
→ SELL CE (Premium selling opportunity)
ITM Call Underpriced (C-P > threshold, Strike < Spot):
→ BUY CE (Synthetic long opportunity)
OTM Put Expensive (C-P < -threshold, Strike < Spot):
→ SELL PE (Premium selling opportunity)
ITM Put Underpriced (C-P < -threshold, Strike > Spot):
→ BUY PE (Protection or synthetic short)
Near Parity (|C-P| < threshold/4):
→ ATM (Neutral market, straddle/strangle zone)
Moderate Imbalance:
→ BULL or BEAR (Directional bias without extreme pricing)
Best for: Professional traders, option writers, synthetic position builders
MOMENTUM Mode 📈
Trend-following strategy that rides market momentum.
Signal Logic:
text
Calls Expensive (C-P > threshold):
→ BUY CE (Follow bullish momentum)
Puts Expensive (C-P < -threshold):
→ BUY PE (Follow bearish momentum)
Near Parity:
→ NEUTRAL (No clear trend)
Best for: Intraday scalpers, directional traders, swing traders
MEAN REVERSION Mode 🔄
Counter-trend strategy focused on premium selling.
Signal Logic:
text
Calls Overpriced (C-P > threshold):
→ SELL CE (Collect inflated premium)
Puts Overpriced (C-P < -threshold):
→ SELL PE (Collect inflated premium)
Near Parity:
→ ATM (Fair value, no edge)
Best for: Option writers, theta decay strategies, credit spread traders
4. 🎨 Fully Customizable Display
Dynamic Table Positioning (9 Options):
Top: left, center, right
Middle: left, center, right
Bottom: left, center, right
Choose position based on your chart layout and other indicators.
Dynamic Table Sizing (6 Options):
Auto - Adapts to content
Tiny - Minimal space (for cluttered charts)
Small - Default, best balance
Normal - Medium size (1080p monitors)
Large - Big text (4K monitors)
Huge - Maximum size (presentations)
Text scales intelligently:
Headers, data, and checkmarks adjust proportionally
Checkmarks remain visible even in tiny mode
Info row stays readable at all sizes
5. ⚙️ Simplified Input System
Auto Mode (Recommended):
Enter just 5 strikes once at market open - used for both calls and puts.
Example for NIFTY at 25,900:
text
Strike 1: 25850 (ATM - 100)
Strike 2: 25900 (ATM - 50)
Strike 3: 25950 (ATM)
Strike 4: 26000 (ATM + 50)
Strike 5: 26050 (ATM + 100)
Manual Mode (Advanced):
Enter separate call and put strikes for cross-strike arbitrage analysis.
Why this matters:
50% fewer inputs compared to traditional indicators
One-time setup at market open
Rarely needs updating (only if market moves 100+ points)
6. 🎛️ Semi-Automatic ATM Detection
The indicator automatically:
Detects current NIFTY/BANKNIFTY spot price
Calculates ATM strike (rounded to nearest 50 or 100)
Marks ATM strikes with *ATM in the table
Displays ATM and spot price in info box
No manual recalculation needed!
7. 📊 Clean Information Display
Main Table (Top/Middle/Bottom):
CE \ PE matrix showing all strike combinations
Checkmarks (✓✓ and ✓) highlighting best matches
SIGNAL column with color-coded trading recommendations
Best Match footer showing optimal combination
Info row displaying symbol, signal mode, and spot price
Info Box (Bottom Left):
Symbol (NIFTY/BANKNIFTY)
Signal Mode (Smart/Momentum/Mean Reversion)
Current Spot Price
Detected ATM Strike
Best Matched Call Strike
Best Matched Put Strike
Match Difference
C-P value for best match
📋 Quick Setup Guide (3 Steps)
Step 1: Add Indicator
Open NIFTY or BANKNIFTY chart on TradingView
Add "Call-Put Cross Strike Match " from indicators
Step 2: Configure Basic Settings
text
Symbol Detection: Auto (reads from chart)
Expiry Date: 251219 (format: YYMMDD for 19-Dec-2025)
Strike Mode: Auto
Strike Interval: 50 (for NIFTY) or 100 (for BANKNIFTY)
Step 3: Enter Strikes
At market open (9:15 AM), check current price and enter 5 strikes:
text
Example: NIFTY at 25,937
Strike 1: 25850 (ATM - 100)
Strike 2: 25900 (ATM - 50)
Strike 3: 25950 (ATM) ← Rounded to nearest 50
Strike 4: 26000 (ATM + 50)
Strike 5: 26050 (ATM + 100)
That's it! The indicator handles everything else automatically.
💡 Real-World Use Cases
1. 📉 Premium Selling (Mean Reversion Mode)
Scenario: Looking for overpriced options to write
How to use:
Set Signal Mode to "Mean Reversion"
Set Threshold: 30 (NIFTY) or 75 (BANKNIFTY)
Look for SELL CE or SELL PE signals with ✓ or ✓✓
Sell naked options or credit spreads at those strikes
Target 30-50% profit or 3-5 days theta decay
Perfect for: Credit spreads, iron condors, covered calls, naked puts
2. 📈 Directional Trading (Momentum Mode)
Scenario: Scalping intraday moves
How to use:
Set Signal Mode to "Momentum"
Set Threshold: 15 (aggressive) or 25 (conservative)
BUY CE signal + ✓✓ = Long call entry
Enter with tight stop (20% of premium)
Target 30-50% gain within 1-2 hours
Perfect for: Intraday scalping, swing trading, trend following
3. 🔄 Synthetic Positions (Smart Mode)
Scenario: Building synthetic long/short with defined risk
How to use:
Set Signal Mode to "Smart"
Look for BUY CE at ITM strike + SELL PE at OTM strike
Both should have ✓ indicator (good parity)
Creates synthetic long position
Lower capital than buying futures
Perfect for: Professional traders, arbitrage, capital efficiency
4. ⚖️ ATM Strategy Optimization (Smart Mode)
Scenario: Finding optimal strikes for straddle/strangle
How to use:
Identify strike marked *ATM
Check if signal shows ATM (balanced market)
If BULL/BEAR → Market has directional bias, adjust accordingly
✓✓ indicates best matched strike for neutral strategies
Perfect for: Volatility trading, earnings plays, event trading
5. 🛡️ Hedging Optimization (Smart Mode)
Scenario: Protecting long equity positions
How to use:
Look for BUY PE signals (protection signals)
Avoid strikes with SELL PE (expensive hedges)
✓✓ shows best value for hedge entry
Optimize hedge timing and strike selection
Perfect for: Portfolio hedging, risk management, protective puts
⚙️ Settings Guide
Symbol Settings
Symbol Detection: Auto (recommended) or Manual
Manual Symbol: NIFTY or BANKNIFTY
Expiry Date: Format YYMMDD (e.g., 251219 = 19-Dec-2025)
Update every Thursday after 3:30 PM for next week's expiry
Strike Settings
Strike Mode: Auto (recommended) or Manual
Strike Interval:
50 for NIFTY
100 for BANKNIFTY
Trading Signals
Signal Mode: Smart / Momentum / Mean Reversion
Smart: Professional institutional strategy (default)
Momentum: Trend-following for scalpers
Mean Reversion: Premium selling for writers
Signal Threshold: Sensitivity in points
NIFTY Recommendations:
Conservative: 30-40 points (fewer, higher quality signals)
Balanced: 20-25 points (default)
Aggressive: 10-15 points (more signals, more noise)
BANKNIFTY Recommendations:
Conservative: 75-100 points
Balanced: 50-60 points (default)
Aggressive: 30-40 points
Algorithm Settings
Matching Mode:
Top 3: Shows 3 best matches (cleaner display)
Top 5: Shows 5 best matches (more opportunities)
Display Settings
Show Matching Table: Enable/disable main table
Table Position: Choose from 9 positions
top_right (default) - Doesn't block price action
middle_right - Centered vertical view
bottom_right - If top is crowded
Table Size: Choose from 6 sizes
small (default) - Best for most users
normal - For 1080p/4K monitors
tiny - If you have many indicators
📊 Understanding The Table
Table Layout Example:
text
CE \ PE | 25950 | 25900 | 25850 | 26000 | 26050 | SIGNAL
---------|-------|-------|-------|-------|-------|--------
25850 | | | | | | SELL PE
25900*ATM| | ✓ | | | | ATM
25950 | ✓✓ | | | | | BULL
26000 | | | | ✓ | | BUY CE
26050 | | | | | | SELL CE
---------|-------|-------|-------|-------|-------|--------
Best Match: 25950 / 25950 (0.25)
Info: NIFTY | Smart | Spot:25881.9
Reading the Table:
Rows (Left): Call option strike prices
Columns (Top): Put option strike prices
Cells: Checkmarks where Call ≈ Put
✓✓: Best match (minimum price difference)
✓: Good matches (top 3 or 5)
Empty: Prices too different (no match)
*ATM: Automatically detected at-the-money strike
SIGNAL Column: Actionable trading recommendation for each call strike
Info Box Metrics:
Symbol: Currently analyzed index
Signal Mode: Active strategy
Spot: Current underlying price
ATM: Calculated at-the-money strike
Best Call: Matched call strike
Best Put: Matched put strike
Match Diff: Price difference (lower = better)
C-P (Best): Call minus Put for best match
📈 Best Practices
Strike Selection & Maintenance
At Market Open (9:15 AM):
Check current price (e.g., NIFTY at 25,937)
Round to nearest interval (25,950 for 50 interval)
Enter 5 strikes: -100, -50, 0, +50, +100 from ATM
Update Frequency:
Usually no update needed entire day
Update only if market moves 100+ points from initial ATM
Typically 0-2 updates per trading session
Signal Interpretation by Confidence Level
High Confidence (✓✓ + Signal):
Best match indicator present
Strongest signal quality
Highest probability setup
Medium Confidence (✓ + Signal):
Good match present
Reliable signal
Acceptable risk/reward
Low Confidence (Signal without ✓):
No match indicator
Strike far from parity
Requires additional confirmation
Risk Management Rules
Never trade signals blindly. Always:
✅ Confirm with price action and support/resistance
✅ Check overall market trend (NIFTY/BANKNIFTY direction)
✅ Consider time decay (theta) for your position
✅ Monitor IV changes (implied volatility)
✅ Use proper position sizing (1-2% risk per trade)
✅ Set stop losses (20-30% of premium for longs)
✅ Have profit targets (30-50% for scalps)
Timeframe Selection
Intraday Trading:
Use 5-minute or 15-minute chart
Momentum or Smart mode
Lower threshold (aggressive)
Quick entries and exits
Positional Trading:
Use hourly or daily chart
Smart or Mean Reversion mode
Higher threshold (conservative)
Swing trade positions
Combining with Other Tools
Recommended complements:
Support/resistance levels (horizontal lines)
Trend indicators (EMA 20/50, SuperTrend)
Volume analysis (confirm breakouts)
India VIX (volatility context)
Option chain data (open interest)
🎓 Strategy Examples
Strategy 1: Professional Premium Selling
text
Mode: Mean Reversion
Threshold: 30 (NIFTY) / 75 (BANKNIFTY)
Timeframe: Daily
Rules:
1. Wait for SELL CE or SELL PE signal
2. Verify strike has ✓ or ✓✓ (good parity)
3. Check if OTM (Strike away from spot)
4. Sell option or create credit spread
5. Target: 30-50% profit or 3-5 days theta
6. Stop: If signal changes to BUY
Position: Naked short or credit spreads
Risk: Define with spreads or capital allocation
Strategy 2: Intraday Momentum Scalping
text
Mode: Momentum
Threshold: 15 (aggressive)
Timeframe: 5-minute
Rules:
1. Wait for BUY CE signal + ✓✓
2. Enter long call immediately
3. Stop loss: 20% of premium paid
4. Target 1: 30% gain (partial exit)
5. Target 2: 50% gain (full exit)
6. Exit if signal changes or 2 hours pass
Position: Long calls or long puts only
Risk: 1-2% of capital per trade
Strategy 3: Synthetic Long Position
text
Mode: Smart
Threshold: 25 (NIFTY) / 60 (BANKNIFTY)
Timeframe: Hourly
Rules:
1. Identify BUY CE signal at ITM strike
2. Identify SELL PE signal at OTM strike
3. Both should have ✓ indicator
4. Buy ITM call + Sell OTM put = Synthetic Long
5. Lower capital than futures
6. Defined risk (width of strikes)
Position: Call debit + Put credit
Risk: Net debit paid (defined risk)
Strategy 4: ATM Straddle Entry
text
Mode: Smart
Threshold: 20 (default)
Timeframe: Daily
Rules:
1. Find strike marked *ATM
2. Check signal shows "ATM" (neutral)
3. Verify ✓✓ at that strike
4. Sell ATM call + Sell ATM put
5. Collect maximum premium
6. Exit at 30% profit or before expiry
Position: Short straddle or iron condor
Risk: Use defined risk (iron condor recommended)
🔔 Important Notes
Data Accuracy
Indicator uses TradingView's NSE options data feed
Always verify prices independently before trading
Ensure market is open (9:15 AM - 3:30 PM IST)
Check for "-" in cells indicating missing data
Expiry Management
Update expiry date every week on Thursday post-closing
Format: YYMMDD (6 digits)
Weekly expiry: Every Thursday
Monthly expiry: Last Thursday of month
Strike Format
NIFTY: Multiples of 50 (25850, 25900, 25950...)
BANKNIFTY: Multiples of 100 (51800, 51900, 52000...)
Wrong strikes = No data in table
Performance Optimization
Indicator updates every bar close
No lag or performance issues
Works on all timeframes (1m to 1D)
Maximum 5 calls + 5 puts = 10 security calls (within limits)
⚠️ Disclaimer
Trading options involves substantial risk of loss and is not suitable for all investors. This indicator is provided for educational and informational purposes only. It does not constitute financial advice, investment advice, or trading advice.
Important disclaimers:
Options can expire worthless, resulting in 100% loss
Past performance of signals is not indicative of future results
Accuracy depends on TradingView's NSE data feed
Signals are mathematical analysis, not predictions
You are solely responsible for your trading decisions
The developer is not liable for any trading losses incurred while using this indicator.
Before trading, ensure you understand:
Options Greeks (Delta, Gamma, Theta, Vega, Rho)
Implied volatility and its impact
Time decay and expiration risks
Assignment risk for short positions
Liquidity and slippage considerations
Margin requirements and capital needs
Always:
Use proper risk management (1-2% per trade)
Trade with capital you can afford to lose
Paper trade before live trading
Consult with a licensed financial advisor
Start with small position sizes
Never risk more than you can afford to lose
📊 Technical Specifications
Platform: TradingView Pine Script v6
Exchanges: NSE (National Stock Exchange of India)
Instruments: NIFTY, BANKNIFTY options
Timeframes: All (1m, 5m, 15m, 1h, 1D)
Strikes Analyzed: 5 calls × 5 puts = 25 combinations
Security Calls: 10 (5 calls + 5 puts)
Table Positions: 9 (all corners and centers)
Table Sizes: 6 (auto to huge)
Signal Modes: 3 (Smart, Momentum, Mean Reversion)
Performance: Optimized, minimal lag
🎯 Who Should Use This?
✅ Perfect For:
Options Traders: Intraday and positional
Premium Sellers: Option writers and theta strategists
Arbitrage Traders: Synthetic position builders
Straddle/Strangle Traders: ATM strategy traders
Professional Traders: Institutional-grade analysis
Volatility Traders: IV imbalance exploiters
Scalpers: Quick intraday moves
❌ Not Suitable For:
Stock options traders (NSE index-specific)
Equity-only traders (requires options knowledge)
International markets (NSE format only)
Complete beginners (requires basic options understanding)
💬 FAQ
Q: Why manual strike entry? Why not fully automatic?
A: Pine Script's type system limits fully automatic strike generation from live data. However, setup takes just 30 seconds once at market open, and the indicator handles all analysis automatically throughout the day.
Q: How often should I update strikes?
A: Rarely! Only when market moves 100+ points from initial ATM. Usually 0-2 times per day, even in volatile markets.
Q: Which Signal Mode is best?
A: Smart mode (default) for professional trading. Use Momentum for intraday scalping, Mean Reversion for premium selling.
Q: Can I use this for stock options?
A: No. The indicator is designed specifically for NSE index options (NIFTY and BANKNIFTY) with NSE format.
Q: Does it work on mobile?
A: Yes, but table display is optimized for desktop/tablet screens. Use "tiny" or "small" size on mobile.
Q: What if I see "-" in cells?
A: Check expiry format (YYMMDD), verify strikes match NSE strikes, and ensure market is open.
Q: What's the difference between ✓✓ and ✓?
A: ✓✓ = Best match (lowest price difference), highest quality. ✓ = Good matches (top 3-5), reliable quality.
Q: Can I backtest this indicator?
A: The indicator shows live analysis. For backtesting options strategies, you'll need historical options data and separate backtesting tools.
Q: What does the info box show?
A: Bottom-left box shows key metrics: symbol, signal mode, spot price, ATM strike, best matched strikes, match difference, and C-P value.
Q: Why no chart plotting?
A: v1.0 focuses on clean table display with maximum information density. Chart plotting may be added in future versions based on user feedback.
🙏 Credits
Developed by a professional options trader for the Indian trading community. Inspired by institutional trading desks and market makers who use call-put parity for daily trading decisions.
Found This Helpful?
⭐ Rate 5 stars if it improved your trading
💬 Comment with your strategy results
🔔 Follow for updates and new indicators
📢 Share with fellow options traders
Feature Requests
Continuous improvement based on trader feedback. Suggest features in comments!
Planned Features (v2.0):
Multi-expiry comparison
Greeks display (Delta, Theta, Vega)
Historical signal performance stats
Custom signal formulas
Export to CSV functionality
🏷️ Tags for Search
#Options #OptionsTrading #NIFTY #BANKNIFTY #NSE #India #OptionChain #CallPut #PutCallParity #Straddle #Strangle #ATM #TradingSignals #OptionsStrategy #PremiumSelling #OptionsScanner #Derivatives #IntradayTrading #VolatilityTrading #Arbitrage #SyntheticPosition #OptionsGreeks #OptionsSelling #OptionsWriting #IndianStockMarket #NSEOptions #OptionsAnalysis #TechnicalAnalysis #AlgoTrading #QuantTrading #ProfessionalTrading #TradingIndicator #PineScript #TradingView
📝 Version History
v1.0 (Current - Dec 2025)
Pine Script v6 implementation
Cross-strike matching (5×5 matrix, 25 combinations)
Three signal modes (Smart, Momentum, Mean Reversion)
Trading signal generation with color coding
Dynamic table positioning (9 positions)
Dynamic table sizing (6 sizes)
Intelligent text scaling
Semi-automatic ATM detection
Auto symbol detection
Simplified input system (50% fewer inputs in Auto mode)
Clean information display
Info box with key metrics
NSE NIFTY & BANKNIFTY support
Start trading smarter with institutional-grade options analysis! 📈💰🚀
Disclaimer: Options trading is subject to market risk. Please read all scheme-related documents carefully before investing.

Volume Profile VisionVolume Profile Vision - Complete Description
Overview
Volume Profile Vision (VPV) is an advanced volume profile indicator that visualizes where trading activity has occurred at different price levels over a specified time period. Unlike traditional volume indicators that show volume over time, this indicator displays volume distribution across price levels, helping traders identify key support/resistance zones, fair value areas, and potential reversal points.
What Makes This Indicator Original
Volume Profile Vision introduces several unique features not found in standard volume profile tools:
Dual-Direction Histogram Display:
Unlike conventional volume profiles that only show bars extending in one direction, VPV displays volume bars extending both left (into historical candles) and right (as a traditional histogram). This bi-directional approach allows traders to see exactly where historical price action intersected with high-volume nodes.
Real-Time Candle Highlighting: The indicator dynamically highlights volume bars that intersect with the current candle's price range, making it immediately obvious which volume levels are currently in play.
Four Professional Color Schemes: Each color scheme uses distinct gradient algorithms and visual encoding systems:
Traffic Light: Uses red (POC), green (VA boundaries), yellow (HVN), with grayscale gradients outside the value area
Aurora Glass: Modern cyan-to-magenta gradient with hot magenta POC highlighting
Obsidian Precision: Professional dark theme with white POC and electric cyan accents
Black Ice: Monochromatic cyan family with graduated intensity
Adaptive Transparency System: Automatically adjusts bar transparency based on position relative to value area, with special handling for each color scheme to maintain visual clarity.
Core Concepts & Calculations
Volume Distribution Analysis
The indicator divides the visible price range into user-defined price levels (default: 80 levels) and calculates the total volume traded at each level by:
Scanning back through the specified lookback period (customizable or visible range)
For each historical bar, determining which price levels the bar's high/low range intersects
Accumulating volume for each intersected price level
Optionally filtering by bullish/bearish volume only
Point of Control (POC)
The POC is the price level with the highest traded volume during the analyzed period. This represents the "fairest" price where most traders agreed on value. The indicator marks this with distinct coloring (red in Traffic Light, magenta in Aurora Glass, white in Obsidian Precision, cyan in Black Ice).
Trading Significance: POC acts as a strong magnet for price - markets tend to return to fair value. When price is away from POC, traders watch for:
Mean reversion opportunities when price is far from POC
Rejection signals when price tests POC from above/below
Breakout confirmation when price breaks through and holds beyond POC
Value Area (VA)
The Value Area encompasses the price range where a specified percentage (default: 68%) of all volume traded. This represents the range of "accepted value" by market participants.
Calculation Method:
Start at the POC (highest volume level)
Expand upward and downward, adding adjacent price levels
Always add the level with higher volume next
Continue until accumulated volume reaches the VA percentage threshold
Value Area High (VAH): Upper boundary of accepted value - acts as resistance
Value Area Low (VAL): Lower boundary of accepted value - acts as support
Trading Significance:
Price spending time inside VA indicates market equilibrium
Breakouts above VAH suggest bullish momentum shift
Breakdowns below VAL suggest bearish momentum shift
Returns to VA boundaries often provide high-probability entry zones
High Volume Nodes (HVN)
Price levels with volume exceeding a threshold percentage (default: 80%) of POC volume. These represent areas of strong agreement and consolidation.
Trading Significance:
HVNs act as strong support/resistance zones
Price tends to consolidate at HVNs before making directional moves
Breaking through an HVN often signals strong momentum
Low Volume Nodes (LVN)
Price levels within the Value Area with volume ≤30% of POC volume. These are zones price moved through quickly with minimal consolidation.
Trading Significance:
LVNs represent areas of rejection - price finds little acceptance
Price tends to move rapidly through LVN zones
Useful for setting stop-losses (below LVN for longs, above for shorts)
Can identify potential gaps or "air pockets" in the market structure
Grayscale POC Detection
A secondary POC detection system identifies the highest volume level outside the Value Area (with a 2-level buffer to avoid confusion). This helps identify significant volume accumulation zones that exist beyond the main value area.
How to Use This Indicator
Setup
Choose Lookback Period:
Enable "Use Visible Range" to analyze only what's on your chart
Or set "Fixed Range Lookback Depth" (default: 200 bars) for consistent analysis
Adjust Profile Resolution:
"Number of Price Levels" (default: 80) - higher = more granular analysis, lower = broader zones
Select Color Scheme:
Traffic Light: Best for clear POC/VA/HVN identification
Aurora Glass: Modern aesthetic for dark charts
Obsidian Precision: Professional trader preference
Black Ice: Minimalist single-color family
Visual Customization
Left Extension: How far back the left-side histogram extends into historical candles (default: 490 bars)
Right Extension: Width of the traditional histogram bars on the right (default: 50 bars)
Right Margin: Space between current price bar and histogram (default: 0 for flush alignment)
Left Profile Gap: Space between left-side histogram and candles (default: 0)
Trading Strategies
Strategy 1: Value Area Mean Reversion
Wait for price to move outside the Value Area (above VAH or below VAL)
Look for rejection signals (wicks, bearish/bullish candles)
Enter trades toward the POC
Take profits as price returns to POC or opposite VA boundary
Strategy 2: Breakout Confirmation
Identify when price is consolidating within the Value Area
Wait for a strong close above VAH (bullish) or below VAL (bearish)
Enter on the breakout or on first pullback to the VA boundary
Target previous HVNs or swing highs/lows outside the VA
Strategy 3: POC Support/Resistance
Watch for price approaching the POC level
If approaching from below, look for bullish reversal patterns at POC (support)
If approaching from above, look for bearish reversal patterns at POC (resistance)
Trade in the direction of the bounce with stops beyond the POC
Strategy 4: LVN Fast Movement Zones
Identify LVN zones within the Value Area (marked with "LVN" label)
When price enters an LVN, expect rapid movement through the zone
Avoid entering trades within LVNs
Use LVNs as confirmation of directional momentum
Alert System
The indicator includes 7 customizable alert conditions:
POC Touch: Alerts when price comes within 0.5 ATR of POC
VAH/VAL Touch: Alerts at Value Area boundaries
VA Breakout: Alerts on breakouts above VAH or below VAL
HVN Touch: Alerts when price contacts High Volume Nodes
LVN Entry: Alerts when entering Low Volume zones
POC Shift: Alerts when POC moves to a new price level
Reading the Profile
Price Labels (shown on the right side):
POC: Point of Control - highest volume price level
VAH: Value Area High - upper boundary of accepted value
VAL: Value Area Low - lower boundary of accepted value
LVN: Low Volume Node - expect fast movement through this zone
Color Intensity Interpretation:
Brighter colors = higher volume concentration
Dimmer colors = lower volume
Abrupt color changes = transition between volume zones
Gaps in the histogram = price levels with no trading activity
Technical Details
Volume Accumulation Logic:
For each bar in lookback period:
For each price level:
If bar's high/low range intersects price level:
Add bar's volume to that price level's total
Gradient Algorithm:
Traffic Light: Dual-range piecewise gradient (0-50% and 50-100% volume intensity)
Aurora Glass: Linear cyan-to-magenta interpolation
Obsidian Precision: Dark blue gradient with cyan highlights
Black Ice: Three-stage cyan intensity progression
Real-Time Updates:
The profile recalculates on every bar, including real-time tick data, ensuring the volume distribution always reflects current market structure.
Best Practices
Timeframe Selection: Use higher timeframes (4H, Daily) for swing trading, lower timeframes (5min, 15min) for day trading
Combine with Price Action: Volume profile shows WHERE, price action shows WHEN
Multiple Timeframe Analysis: Check daily VP for major levels, then drill down to intraday for entries
Volume Type Selection: Use "Bullish" volume in uptrends, "Bearish" in downtrends, or "Both" for complete picture
Adjust VA Percentage: 68% (default) captures one standard deviation; try 70% for tighter or 60% for broader value areas
Performance Notes
Maximum bars back: 5000 (handles deep historical analysis)
Maximum boxes: 500 (handles complex profiles)
Optimized calculation: Only recalculates on last bar for efficiency
Real-time capable: Updates as new ticks arrive

Volume Intelligence Pro [Abusuhil]═══════════════════════════════════════════════════════════════════════════════
📊 VOLUME INTELLIGENCE TABLE - PROFESSIONAL VOLUME ANALYSIS INDICATOR
═══════════════════════════════════════════════════════════════════════════════
🌐 BILINGUAL SUPPORT: Full support for English and Arabic languages - switch instantly from settings!
🎯 COMPREHENSIVE VOLUME ANALYSIS DASHBOARD
This advanced indicator provides institutional-grade volume analysis through an elegant, customizable table that displays critical volume metrics in real-time. Designed for professional traders who need deep insights into market volume dynamics, order flow, and smart money movements.
═══════════════════════════════════════════════════════════════════════════════
✨ KEY FEATURES
═══════════════════════════════════════════════════════════════════════════════
🔷 BILINGUAL INTERFACE
• Seamless switching between English and Arabic
• All metrics, labels, and signals fully translated
• Perfect for international traders
🔷 VOLUME FUNDAMENTALS
• Current Volume: Real-time volume tracking
• Volume SMA: Moving average for volume comparison
• Volume Ratio: Current volume vs average (identifies abnormal activity)
• Volume % Change: Percentage change from previous bar
• Volume Delta: Difference between buying and selling pressure
🔷 VOLUME SPIKE DETECTION (4 LEVELS)
• Weak Spike: 1.5x average volume
• Medium Spike: 2.0x average volume
• Strong Spike: 2.5x average volume
• Extreme Spike: 3.0x+ average volume
• Visual alerts with color-coded indicators
🔷 ADVANCED BUY/SELL PRESSURE ANALYSIS
• Buy Volume: Bullish candle volume accumulation
• Sell Volume: Bearish candle volume accumulation
• Buy Pressure %: Percentage of buying pressure
• Sell Pressure %: Percentage of selling pressure
• Pressure Dominance: Who controls the market (Buyers/Sellers/Neutral)
• Candle Body Strength: Measures conviction in price movement
• Imbalance Volume: Detects wick imbalances
• Volume Delta (HLC3): Advanced delta calculation
• Weighted Delta: Volume-weighted price movement
• Pressure Lookback: Multi-candle pressure analysis (optimized for performance)
🔷 TECHNICAL INDICATORS INTEGRATION
• VWMA (Volume Weighted Moving Average): Price vs VWMA positioning
• OBV (On Balance Volume): Trend detection with EMA smoothing
• OBV Divergence: Bullish/Bearish divergence detection
• MFI (Money Flow Index): Overbought/oversold conditions
• A/D Line (Accumulation/Distribution): Smart money tracking
🔷 AI-POWERED VOLUME INTELLIGENCE SCORING
• Entry Power: Measures volume strength combined with price movement
• Effort vs Result: Identifies climax situations (buying/selling exhaustion)
• Reversal Volume Analysis: Tracks volume at reversal candles
• Trend Integration: Combines trend direction with volume confirmation
• Bullish/Bearish Points: 11-point scoring system
• Volume Score: -100 to +100 scale (positive = bullish, negative = bearish)
• Confidence Level: Reliability percentage of the signal
• Final Signal: Clear BULLISH/BEARISH/NEUTRAL verdict
🔷 TRIPLE SIGNAL SYSTEM (Optional)
• Signal 1: Volume Score Based (customizable thresholds)
• Signal 2: Volume Spike + Candle Color (spike level selection)
• Signal 3: OBV Divergence Detection
• Independent on/off toggles for each signal
• Visual signals plotted on chart with triangles
• Combined signal alerts
🔷 COMPREHENSIVE ALERT SYSTEM
• Volume spike alerts (configurable levels)
• Signal 1, 2, 3 individual alerts
• Combined buy/sell signal alerts
• OBV trend change alerts
• Strong buying/selling pressure alerts
• Customizable alert frequency
═══════════════════════════════════════════════════════════════════════════════
📊 TABLE STRUCTURE & DISPLAY
═══════════════════════════════════════════════════════════════════════════════
The indicator features a professional 3-column table with the following sections:
📌 COLUMN HEADERS:
• INDICATOR: Metric name
• VALUE: Current reading
• STATUS: Visual status indicator (color-coded dots/icons)
📌 SECTION 1: VOLUME BASICS
Displays fundamental volume metrics with ratio indicators and percentage changes. Essential for understanding current market activity levels.
📌 SECTION 2: VOLUME SPIKE DETECTION
Real-time spike detection with 4 severity levels. Color-coded for instant recognition of abnormal volume.
📌 SECTION 3: BUY/SELL PRESSURE (ADVANCED)
Comprehensive order flow analysis with 10+ metrics. Includes advanced calculations like weighted delta, imbalance volume, and multi-candle pressure lookback.
📌 SECTION 4: VWMA ANALYSIS
Shows price position relative to volume-weighted moving average. Critical for identifying volume-supported moves.
📌 SECTION 5: OBV ANALYSIS
On Balance Volume trend and divergence detection. Helps identify smart money accumulation/distribution.
📌 SECTION 6: MFI ANALYSIS
Money Flow Index readings with overbought/oversold signals. Combines price and volume for comprehensive analysis.
📌 SECTION 7: A/D LINE
Accumulation/Distribution line trend analysis. Tracks institutional buying and selling.
📌 SECTION 8: VOLUME INTELLIGENCE
AI-powered scoring system with 11 evaluation points:
1. Volume strength assessment
2. Current buy/sell pressure
3. Multi-candle pressure lookback
4. Entry power calculation
5. Reversal volume tracking
6. VWMA position
7. OBV trend
8. OBV divergence
9. MFI signal
10. A/D trend
11. Trend-volume integration
Final output: Volume Score, Confidence Level, and highlighted FINAL SIGNAL.
═══════════════════════════════════════════════════════════════════════════════
⚙️ CUSTOMIZATION OPTIONS
═══════════════════════════════════════════════════════════════════════════════
🎨 TABLE DISPLAY
• Position: 9 locations (top-left, top-center, top-right, middle-left, etc.)
• Size: 5 sizes (tiny, small, normal, large, huge)
• Colors: Fully customizable background and text colors
• Sections: Show/hide any section independently
🎯 VOLUME SETTINGS
• Volume Average Length (default: 20)
• Spike Thresholds: Adjustable multipliers for each level
• Advanced Metrics: Lookback periods (optimized: 10 candles)
• Reversal Analysis: Candle count (optimized: 5 candles)
📊 INDICATOR LENGTHS
• OBV Smoothing: Default 14
• MFI Period: Default 14
• VWMA Length: Default 20
• A/D Length: Default 14
🎯 SIGNAL SYSTEM
• Enable/disable each signal independently
• Customizable thresholds for Signal 1 (score & confidence)
• Spike level selection for Signal 2
• Show/hide signals on chart
• Alert configuration for each signal type
═══════════════════════════════════════════════════════════════════════════════
🚀 PERFORMANCE & OPTIMIZATION
═══════════════════════════════════════════════════════════════════════════════
✅ REPLAY MODE OPTIMIZED
• Works flawlessly in TradingView Replay mode
• Optimized calculations for fast historical analysis
• No lag or freezing issues
✅ REAL-TIME EFFICIENCY
• Lightweight code structure (50 labels/lines limit)
• Smart caching of repeated calculations
• Limited loop iterations for optimal performance
• Updates only on last bar (table rendering)
✅ NON-REPAINTING
• All signals are confirmed on bar close
• No retrospective changes to historical signals
• Reliable for backtesting and strategy development
═══════════════════════════════════════════════════════════════════════════════
💡 USAGE RECOMMENDATIONS
═══════════════════════════════════════════════════════════════════════════════
📈 FOR DAY TRADING:
• Use 15m-1H timeframes
• Enable all sections for comprehensive analysis
• Focus on Volume Spike and Buy/Sell Pressure sections
• Set alerts for Strong and Extreme spikes
📈 FOR SWING TRADING:
• Use 4H-1D timeframes
• Focus on Volume Intelligence and OBV sections
• Enable Signal 1 and Signal 3 for swing entries
• Monitor divergences for trend reversals
📈 FOR SCALPING:
• Use 1m-5m timeframes
• Focus on Buy/Sell Pressure and Volume Basics
• Enable Signal 2 for quick spike-based entries
• Hide less relevant sections to reduce visual clutter
═══════════════════════════════════════════════════════════════════════════════
🎓 INDICATOR METHODOLOGY
═══════════════════════════════════════════════════════════════════════════════
This indicator combines classical volume analysis with modern algorithmic intelligence:
1. Volume Profiling: Identifies abnormal volume relative to historical averages
2. Order Flow Analysis: Separates buying and selling pressure using candle structure
3. Divergence Detection: Compares price action with volume indicators
4. Multi-Timeframe Approach: Uses smoothing and lookback for context
5. Scoring Algorithm: 11-point evaluation system for objective signal generation
6. Confluence Integration: Combines multiple indicators for higher probability setups
═══════════════════════════════════════════════════════════════════════════════
⚠️ DISCLAIMER
═══════════════════════════════════════════════════════════════════════════════
This indicator is a tool for analysis and should not be used as the sole basis for trading decisions. Always combine with your own analysis, risk management, and trading plan. Past performance does not guarantee future results.
═══════════════════════════════════════════════════════════════════════════════
📞 SUPPORT & UPDATES
═══════════════════════════════════════════════════════════════════════════════
• Regular updates and improvements
• Bug fixes and optimization
• Feature requests considered
• Community feedback welcomed
═══════════════════════════════════════════════════════════════════════════════
🌟 Happy Trading! May your volume analysis lead to profitable decisions! 🚀
═══════════════════════════════════════════════════════════════════════════════
═══════════════════════════════════════════════════════════════════════════════
═══════════════════════════════════════════════════════════════════════════════
📊 جدول معلومات الفوليوم - مؤشر احترافي لتحليل حجم التداول
═══════════════════════════════════════════════════════════════════════════════
🌐 دعم ثنائي اللغة: دعم كامل للغتين الإنجليزية والعربية - التبديل الفوري من الإعدادات!
🎯 لوحة معلومات شاملة لتحليل الفوليوم
مؤشر متقدم يوفر تحليلاً احترافياً للفوليوم من خلال جدول أنيق وقابل للتخصيص يعرض مقاييس الفوليوم الحيوية في الوقت الفعلي. مصمم للمتداولين المحترفين الذين يحتاجون إلى رؤى عميقة حول ديناميكيات حجم السوق، تدفق الأوامر، وحركة الأموال الذكية.
═══════════════════════════════════════════════════════════════════════════════
✨ الميزات الرئيسية
═══════════════════════════════════════════════════════════════════════════════
🔷 واجهة ثنائية اللغة
• التبديل السلس بين الإنجليزية والعربية
• جميع المقاييس والتسميات والإشارات مترجمة بالكامل
• مثالي للمتداولين العرب والدوليين
🔷 أساسيات الفوليوم
• الفوليوم الحالي: تتبع حجم التداول في الوقت الفعلي
• متوسط الفوليوم: المتوسط المتحرك للمقارنة
• نسبة الفوليوم: الحجم الحالي مقابل المتوسط (يحدد النشاط غير الطبيعي)
• تغير الفوليوم %: نسبة التغيير من الشمعة السابقة
• دلتا الفوليوم: الفرق بين ضغط الشراء والبيع
🔷 اكتشاف انفجارات الفوليوم (4 مستويات)
• انفجار ضعيف: 1.5 ضعف المتوسط
• انفجار متوسط: 2.0 ضعف المتوسط
• انفجار قوي: 2.5 ضعف المتوسط
• انفجار شديد: 3.0+ ضعف المتوسط
• تنبيهات بصرية مع مؤشرات ملونة
🔷 تحليل متقدم لضغط الشراء/البيع
• حجم الشراء: تراكم حجم الشموع الصاعدة
• حجم البيع: تراكم حجم الشموع الهابطة
• ضغط الشراء %: نسبة ضغط الشراء
• ضغط البيع %: نسبة ضغط البيع
• سيطرة الضغط: من يتحكم في السوق (المشترين/البائعين/محايد)
• قوة جسم الشمعة: يقيس قوة حركة السعر
• عدم التوازن: يكتشف اختلال توازن الفتائل
• دلتا الفوليوم (HLC3): حساب متقدم للدلتا
• الدلتا المرجح: حركة السعر المرجحة بالحجم
• تحليل الضغط متعدد الشموع: تحليل عدة شموع (محسّن للأداء)
🔷 تكامل المؤشرات الفنية
• VWMA (المتوسط المرجح بالحجم): موقع السعر مقابل VWMA
• OBV (الحجم التراكمي): اكتشاف الاتجاه مع تمهيد EMA
• تباعد OBV: كشف التباعدات الصعودية/الهبوطية
• MFI (مؤشر تدفق الأموال): حالات التشبع الشرائي/البيعي
• خط A/D (التراكم/التوزيع): تتبع الأموال الذكية
🔷 نظام تقييم ذكي مدعوم بالذكاء الاصطناعي
• قوة الدخول: يقيس قوة الفوليوم مع حركة السعر
• الجهد مقابل النتيجة: يحدد حالات الذروة (استنزاف الشراء/البيع)
• تحليل حجم الانعكاس: يتتبع الحجم عند شموع الانعكاس
• تكامل الاتجاه: يجمع اتجاه الترند مع تأكيد الفوليوم
• النقاط الصعودية/الهبوطية: نظام تقييم من 11 نقطة
• تقييم الفوليوم: مقياس من -100 إلى +100 (موجب = صعودي، سالب = هبوطي)
• مستوى الثقة: نسبة موثوقية الإشارة
• الإشارة النهائية: حكم واضح (صعودي/هبوطي/محايد)
🔷 نظام الإشارات الثلاثي (اختياري)
• الإشارة 1: بناءً على تقييم الفوليوم (عتبات قابلة للتخصيص)
• الإشارة 2: انفجار الفوليوم + لون الشمعة (اختيار مستوى الانفجار)
• الإشارة 3: كشف تباعد OBV
• تفعيل/إلغاء مستقل لكل إشارة
• إشارات بصرية على الشارت بمثلثات
• تنبيهات إشارات مجمعة
🔷 نظام تنبيهات شامل
• تنبيهات انفجار الفوليوم (مستويات قابلة للتهيئة)
• تنبيهات فردية للإشارات 1، 2، 3
• تنبيهات إشارات الشراء/البيع المجمعة
• تنبيهات تغيير اتجاه OBV
• تنبيهات ضغط الشراء/البيع القوي
• تردد التنبيهات قابل للتخصيص
═══════════════════════════════════════════════════════════════════════════════
📊 بنية الجدول والعرض
═══════════════════════════════════════════════════════════════════════════════
يتميز المؤشر بجدول احترافي من 3 أعمدة مع الأقسام التالية:
📌 عناوين الأعمدة:
• المؤشر: اسم المقياس
• القيمة: القراءة الحالية
• الحالة: مؤشر الحالة البصري (نقاط/رموز ملونة)
📌 القسم 1: أساسيات الفوليوم
يعرض مقاييس الفوليوم الأساسية مع مؤشرات النسب والتغيرات المئوية. ضروري لفهم مستويات نشاط السوق الحالي.
📌 القسم 2: كشف انفجارات الفوليوم
كشف فوري للانفجارات مع 4 مستويات من الشدة. ملون للتعرف الفوري على الحجم غير الطبيعي.
📌 القسم 3: ضغط الشراء/البيع (متقدم)
تحليل شامل لتدفق الأوامر مع أكثر من 10 مقاييس. يتضمن حسابات متقدمة مثل الدلتا المرجح، حجم عدم التوازن، وتحليل الضغط متعدد الشموع.
📌 القسم 4: تحليل VWMA
يعرض موقع السعر بالنسبة للمتوسط المرجح بالحجم. حاسم لتحديد الحركات المدعومة بالحجم.
📌 القسم 5: تحليل OBV
اتجاه الحجم التراكمي وكشف التباعدات. يساعد في تحديد تراكم/توزيع الأموال الذكية.
📌 القسم 6: تحليل MFI
قراءات مؤشر تدفق الأموال مع إشارات التشبع. يجمع بين السعر والحجم للتحليل الشامل.
📌 القسم 7: خط A/D
تحليل اتجاه خط التراكم/التوزيع. يتتبع الشراء والبيع المؤسسي.
📌 القسم 8: الذكاء الاصطناعي للفوليوم
نظام تقييم ذكي مع 11 نقطة تقييم:
1. تقييم قوة الفوليوم
2. ضغط الشراء/البيع الحالي
3. تحليل الضغط متعدد الشموع
4. حساب قوة الدخول
5. تتبع حجم الانعكاس
6. موقع VWMA
7. اتجاه OBV
8. تباعد OBV
9. إشارة MFI
10. اتجاه A/D
11. تكامل الاتجاه مع الفوليوم
الناتج النهائي: تقييم الفوليوم، مستوى الثقة، والإشارة النهائية المميزة.
═══════════════════════════════════════════════════════════════════════════════
⚙️ خيارات التخصيص
═══════════════════════════════════════════════════════════════════════════════
🎨 عرض الجدول
• الموقع: 9 مواقع (أعلى-يسار، أعلى-وسط، أعلى-يمين، وسط-يسار، إلخ)
• الحجم: 5 أحجام (صغير جداً، صغير، عادي، كبير، ضخم)
• الألوان: خلفية ونص قابل للتخصيص بالكامل
• الأقسام: إظهار/إخفاء أي قسم بشكل مستقل
🎯 إعدادات الفوليوم
• طول متوسط الفوليوم (افتراضي: 20)
• عتبات الانفجار: مضاعفات قابلة للتعديل لكل مستوى
• مقاييس متقدمة: فترات التحليل (محسّن: 10 شموع)
• تحليل الانعكاس: عدد الشموع (محسّن: 5 شموع)
📊 أطوال المؤشرات
• تمهيد OBV: افتراضي 14
• فترة MFI: افتراضي 14
• طول VWMA: افتراضي 20
• طول A/D: افتراضي 14
🎯 نظام الإشارات
• تفعيل/إلغاء كل إشارة بشكل مستقل
• عتبات قابلة للتخصيص للإشارة 1 (التقييم والثقة)
• اختيار مستوى الانفجار للإشارة 2
• إظهار/إخفاء الإشارات على الشارت
• تهيئة التنبيهات لكل نوع إشارة
═══════════════════════════════════════════════════════════════════════════════
🚀 الأداء والتحسين
═══════════════════════════════════════════════════════════════════════════════
✅ محسّن لوضع الريبلاي
• يعمل بسلاسة في وضع Replay في TradingView
• حسابات محسّنة للتحليل التاريخي السريع
• لا توجد مشاكل تأخير أو تجميد
✅ كفاءة الوقت الفعلي
• بنية كود خفيفة (حد 50 علامة/خط)
• تخزين ذكي للحسابات المتكررة
• تكرارات محدودة للحلقات للأداء الأمثل
• تحديثات فقط على آخر شمعة (عرض الجدول)
✅ غير قابل لإعادة الرسم
• جميع الإشارات مؤكدة عند إغلاق الشمعة
• لا توجد تغييرات بأثر رجعي على الإشارات التاريخية
• موثوق للاختبار الخلفي وتطوير الاستراتيجيات
═══════════════════════════════════════════════════════════════════════════════
💡 توصيات الاستخدام
═══════════════════════════════════════════════════════════════════════════════
📈 للتداول اليومي:
• استخدم فريمات 15د-1س
• فعّل جميع الأقسام للتحليل الشامل
• ركز على أقسام انفجار الفوليوم وضغط الشراء/البيع
• ضع تنبيهات للانفجارات القوية والشديدة
📈 للتداول المتأرجح:
• استخدم فريمات 4س-1ي
• ركز على أقسام الذكاء الاصطناعي و OBV
• فعّل الإشارة 1 والإشارة 3 لدخولات التأرجح
• راقب التباعدات لانعكاسات الاتجاه
📈 للمضاربة:
• استخدم فريمات 1د-5د
• ركز على ضغط الشراء/البيع وأساسيات الفوليوم
• فعّل الإشارة 2 لدخولات سريعة بناءً على الانفجارات
• أخفِ الأقسام الأقل صلة لتقليل الفوضى البصرية
═══════════════════════════════════════════════════════════════════════════════
🎓 منهجية المؤشر
═══════════════════════════════════════════════════════════════════════════════
يجمع هذا المؤشر بين تحليل الفوليوم الكلاسيكي والذكاء الخوارزمي الحديث:
1. تحديد الفوليوم: يحدد الحجم غير الطبيعي نسبة للمتوسطات التاريخية
2. تحليل تدفق الأوامر: يفصل ضغط الشراء والبيع باستخدام بنية الشمعة
3. كشف التباعد: يقارن حركة السعر مع مؤشرات الفوليوم
4. نهج متعدد الفريمات: يستخدم التمهيد والتحليل الرجعي للسياق
5. خوارزمية التقييم: نظام تقييم من 11 نقطة لتوليد إشارات موضوعية
6. تكامل التقاء: يجمع عدة مؤشرات لإعدادات ذات احتمالية أعلى
═══════════════════════════════════════════════════════════════════════════════
⚠️ إخلاء المسؤولية
═══════════════════════════════════════════════════════════════════════════════
هذا المؤشر هو أداة للتحليل ولا ينبغي استخدامه كأساس وحيد لقرارات التداول. اجمع دائماً مع تحليلك الخاص وإدارة المخاطر وخطة التداول. الأداء السابق لا يضمن النتائج المستقبلية.
═══════════════════════════════════════════════════════════════════════════════
📞 الدعم والتحديثات
═══════════════════════════════════════════════════════════════════════════════
• تحديثات وتحسينات منتظمة
• إصلاحات الأخطاء والتحسين
• طلبات الميزات قيد الاعتبار
• ملاحظات المجتمع مرحب بها
═══════════════════════════════════════════════════════════════════════════════
🌟 تداول سعيد! نتمنى أن يقودك تحليل الفوليوم إلى قرارات مربحة! 🚀
═══════════════════════════════════════════════════════════════════════════════
═══════════════════════════════════════════════════════════════════════════════

Trend Architect OverlaysOverview
Trend Architect Overlays is a comprehensive technical analysis suite that combines multiple advanced overlay indicators into a single tool. Designed for traders who want a clean, professional chart with powerful trend identification, dynamic channels, and intelligent candle coloring, this indicator adapts to your trading style with configurable components.
The indicator features four main components that work together to provide a complete market analysis framework:
Trend Cloud - Volatility-adaptive cloud for trend identification
Moving Average Ribbon - Dual moving average lines for dynamic support/resistance
B3AR's Super Channel - Multi-function channel with adaptive width
Intelligent Candle Coloring - Five different algorithms for visual trend analysis
Each component can be enabled or disabled independently, allowing you to create the perfect setup for your trading strategy.
---
Color Profile System
Before diving into individual tools, it's important to understand the color profile system that unifies all visual elements of the indicator. Choose from 7 distinct color profiles. The selected color profile automatically applies to all indicator components, ensuring visual consistency across your chart.
Trend Cloud
What It Is
The Trend Cloud is an adaptive overlay that uses multiple moving averages to create a dynamic zone representing the market's trend strength and direction. Unlike traditional moving average clouds, this cloud automatically adjusts its width based on market momentum and volatility.
Not only does the Trend Cloud effectively identify trend direction, but it also acts as a strong support and resistance area.
How to Use It
1. Trend Identification: Use the cloud color and price position to identify the primary trend
2. Support/Resistance: The cloud edges act as dynamic support (in uptrends) and resistance (in downtrends)
3. Trend Strength: Monitor cloud width - expanding clouds suggest momentum building, contracting clouds suggest momentum fading
4. Entry Signals: Look for pullbacks to the cloud edge during strong trends
5. Exit Signals: Consider exits when price crosses through the cloud against the trend
Pro Tips
- Combine with Moving Average Ribbon for confluence at key levels
- Use the cloud as a "trend filter" - only take trades in the direction of the cloud color
- Watch for "cloud flips" (color changes) as potential trend reversal signals
- A relatively flat Trend Cloud can be interpreted as a ranging market
Moving Average Ribbon
What It Is
The Moving Average Ribbon consists of two Arnaud Legoux Moving Average (ALMA) lines that create a dynamic ribbon for identifying trend direction and strength. ALMA is known for its reduced lag and smoother response compared to traditional moving averages.
How It Works
Both lines use the same base length but different offset and sigma parameters to create a subtle separation that forms a ribbon. The space between them fills with color to create a visual ribbon effect.
How to Use It
1. Trend Direction: The ribbon color indicates the current trend direction
2. Dynamic Support/Resistance: The ribbon edges act as support in uptrends and resistance in downtrends
3. Momentum Gauge: Width between the lines indicates trend strength
4. Crossover Signals: When the lines cross, it suggests a potential trend change
5. Pullback Entries: Look for price to touch the ribbon during trends as entry opportunities
Pro Tips
- Lower ribbon length (10-15) for faster, more responsive signals on lower timeframes
- Higher ribbon length (30-50) for smoother signals on higher timeframes
- Use ribbon color as a "permission slip" - only take longs when ribbon is bullish
- Watch for price to "respect" the ribbon - bounces off the ribbon confirm trend strength
B3AR's Super Channel
What It Is
B3AR's Super Channel is an advanced dynamic channel that combines multiple momentum and volatility calculations into a single adaptive channel. The channel includes special highlights when price is especially overbought or oversold.
How to Use It
1. Dynamic Support/Resistance: Use channel lines as key levels for entries and exits
2. Overbought/Oversold: Price at channel extremes suggests potential mean reversion
3. Trend Confirmation: During strong trends, price will "ride" one edge of the channel
4. Breakout Detection**: Price breaking outside the channel suggests unusual strength/weakness
Pro Tips
- Use highlighted lines as extreme caution zones - reversals are likely
- Combine with Trend Cloud - when both agree, signals are stronger
- In ranging markets, fade extremes (buy at bottom, sell at top)
- In trending markets, use channel as trailing stop
- Increase ATR Distance in volatile markets, decrease in calm markets
Intelligent Candle Coloring
What It Is
Intelligent Candle Coloring replaces standard candle colors with algorithm-driven colors that reveal the underlying market structure. Five different methods are available, each analyzing different market characteristics.
Method 1 : None
Standard candle coloring - use this if you prefer traditional candle colors.
Method 2 : CVD Trend Algo (Rule-Based)
This method uses Cumulative Volume Delta (CVD) combined with Heikin Ashi smoothing and Kalman filtering to create a sophisticated trend-following color system.
Method 3 : CVD Trend Simple (Size-Based)
Similar to CVD Trend Algo but uses Z-score analysis instead of rules for color assignment.
Method 4 : CVD Raw
A simplified version that uses raw CVD percentile ranking for immediate visual feedback.
Method 5 : Volatility Adaptive
Uses Kaufman's Adaptive Moving Average to color candles based on adaptive trend strength.
How It Works:
- Calculates three KAMA lines (fast, medium, slow)
- Colors determined by the relationship between these KAMAs
Method 6: Trend Strength (TRAMA)
Uses Triangular Moving Average with ATR-based adaptation for trend strength analysis.
How It Works:
- Calculates three TRAMA lines (fast, medium, slow) that adapt to volatility
- Similar logic to KAMA method but more responsive to volatility changes
Pro Tips
- CVD methods work best on liquid assets with high volume
- Adaptive methods (KAMA/TRAMA) work better on trending markets
- Match the method to your timeframe: CVD Raw for scalping, CVD Trend Algo for swing trading
- Use weak colors as warnings - trend may be losing steam
---
Credits and Disclaimers
This indicator combines numerous advanced technical analysis techniques into a cohesive overlay system. The B3AR's Super Channel component incorporates proprietary oscillator consensus methodology.
Disclaimer: This indicator is for educational and informational purposes only. It does not constitute financial advice. Past performance does not guarantee future results. Always conduct your own analysis and risk management before making trading decisions.

Advanced Market Profile & S/R Zones (Pro)Advanced Market Profile & S/R Zones
This indicator brings professional Auction Market Theory to your chart using a custom rolling Volume Profile algorithm. Unlike standard profiles that remain fixed, this tool dynamically calculates the "Fair Value" of the asset based on your specific lookback period (e.g., the last 100 bars).
It automatically highlights the Point of Control (POC), Value Area (VA), and suggests statistical Discount (Buy) and Premium (Sell) zones.
Key Features
Volume Splitting Algorithm:
Most basic scripts dump the entire volume of a candle into a single price point (the average). This script splits the volume across the candle's entire High-Low range. This results in a much smoother, higher-resolution bell curve that accurately reflects price action, especially on higher timeframes like Monthly charts.
Auto-generated Zones:
Green Zone (Discount): Prices below the Value Area Low (VAL). Statistically "cheap."
Red Zone (Premium): Prices above the Value Area High (VAH). Statistically "expensive."
Real-Time Dashboard:
A built-in panel displays the exact price levels for the POC, VAH, and VAL for precise limit order placement, along with the current Market Trend.
How to Use
For Intraday (Day Trading):
Settings: Set Lookback to 100 - 300.
Strategy: Watch for price to open outside the Value Area. If price breaks back inside the Value Area, target the POC (Red Line).
For Macro (Monthly/Weekly Charts):
Settings: Set Lookback to 12 (1 Year) or 60 (5 Years).
Strategy: Identify multi-year structural support. When a monthly candle enters the Green Discount Zone of a 5-year profile, it is often a high-probability institutional entry point.
Trend Logic
The Dashboard indicates trend based on price location relative to value:
Strong Bullish: Price is accepted ABOVE the Value Area.
Strong Bearish: Price is accepted BELOW the Value Area.
Neutral / In VA: Price is chopping inside the Value Area.
Disclaimer
This is a "Rolling Profile." It calculates the profile based on the current lookback window relative to the latest bar. As new bars form, the lookback window shifts, and the profile updates to reflect the new dataset.

Momentum Pro [FluxQuant]Momentum Pro — Adaptive Momentum & Regime Filter
Overview
Momentum Pro is a next-generation oscillator that combines rate-of-change (ROC), relative-strength (RSI), and stochastic-momentum frameworks into a unified adaptive model. It dynamically filters momentum through volatility, directional-movement, and trend-strength conditions to highlight only qualified signals in changing market regimes.
🔹 Key Features
Selectable Core Algorithm: Choose between ROC, RSI, or Stochastic momentum engines
Adaptive Signal System: Cross-based entries gated by volatility and trend filters
Quality Filters: Volatility, momentum intensity, and directional bias validation
Overbought / Oversold Zones: Automatic detection with background visualization
Multi-Timeframe Sync: Confirm intraday signals with higher-timeframe momentum
Divergence Scanner: Pivot-based detection of regular bullish / bearish divergences
Smart Dashboard: Real-time summary of market state, momentum strength, and filter status
Dynamic Visual Themes: Gradient, Premium, and Glassmorphism histogram modes
🧠 How It Works
Momentum Pro calculates normalized momentum using your selected algorithm and applies layered filters to ensure that only statistically significant moves are emphasized.
The volatility filter measures current vs. average ATR to confirm expansion.
The trend filter assesses DI +/ DI – differentials for directional bias.
The momentum gate suppresses signals during consolidation or low-range conditions.
Optional higher-timeframe data aligns local momentum with broader bias for cleaner entries.
When these filters agree, momentum crossovers or divergences are visually highlighted as potential study points — not trade instructions.
📈 Interpreting the Dashboard
Field Meaning
Market State Identifies current regime (Bullish, Bearish, Overbought, Oversold, Ranging)
Momentum Current oscillator value (0–100 normalized scale)
Change Recent acceleration / deceleration in momentum
Filter Whether volatility and trend criteria are satisfied
Signal Active cross or directional alignment
Trend / Vol / Intensity Strength metrics (Elite mode)
HTF Sync Confirms alignment with higher-timeframe momentum bias
Use the dashboard as a contextual overlay — not as a mechanical signal generator.
🧩 Configuration Guide
Algorithm: Select ROC for reactive speed, RSI for balanced smoothness, or Stochastic for cyclical range focus.
Signal Line: Enable to visualize crossovers. “Glow” style enhances contrast for clarity.
Filters: Keep “Enable Filter” active to limit noise. Adjust Volatility & Trend thresholds for sensitivity.
Zones: Use background fills to mark overbought / oversold regions and regime shifts.
Divergence: Turn on for automatic pivot-based divergence marking.
Multi-Timeframe: Enable HTF confirmation to study alignment with larger trend context.
Dashboard: Choose Minimal → Elite modes depending on information density preference.
🧭 Best Practices
Works on all markets — equities, futures, crypto, FX
Ideal for 15 m – 4 h – Daily timeframes
Pairs well with structure or liquidity analysis for confirmation
Use filters to isolate expansion phases; avoid trading during neutral states
⚠️ Disclaimer
Momentum Pro is an educational and analytical tool intended for research and visualization only.
It does not provide financial advice, trade signals, or guaranteed outcomes.
Always conduct independent analysis and risk assessment before making trading decisions.
🛠 Release Notes
v 1.0 — Initial Public Release
Multi-algorithm momentum core (ROC / RSI / Stochastic)
Volatility + trend quality filter system
Multi-timeframe synchronization and ribbon overlay
Divergence scanner and contextual dashboard
Dynamic visualization modes

Liquidity ToolkitKey Points:
Liquidity Toolkit is your liquidity companion for monitoring and anticipating price action.
Liquidity Toolkit combined the power of the Liquidity Status indicator with the potency of Price Triggers.
Liquidity Status indicates if the current current liquidity environment is bullish or bearish.
Price triggers highlight price levels where supports, resistances, and trend-changes are likely to occur.
Together, they create a comprehensive and actionable view of the market.
Summary
The Liquidity Toolkit (TK) is designed as a one-stop-shop indicator by combining novel liquidity metrics with traditional and impactful price measurements. In combination, TK grants unparalleled views of the market through effective yet simple displays.
The TK indicator contains two separate by synergistic algorithms: the Liquidity Status algorithm, which measures liquidity to determine if outlooks are bearish or bullish; and the Price Triggers algorithm which analyzes price-action to determine points of support and resistances.
Example 1 :
Example 2 :
Example 3 :
Details
Liquidity Status
Liquidity Status (LS) measures liquidity and produces either `Bullish` or `Bearish` indications depending on the current liquidity status.
Bullish indications indicate that the overall flow of liquidity is supportive of bullish price and bearish indications indicate that the overall flow of liquidity is supportive of bearish price action.
LS is displayed in two ways:
Candle-Coloring: if candles are green, liquidity status is bullish and if candles are red, liquidity status is bearish.
Text Display: Bearish and/or Bullish is displayed via text as well.
Price Triggers
Price Triggers (PT) measure price action and report their findings on several timeframes:
1-Minute
5-Minute
60-Minute
1-Day
1-Week
TK graphs the PTs based on the chart interval – only the higher PTs are display (i.e.: On the 1-Hour chart, the 5-, and 1-Min PTs will not be displayed).
Example 4
In additional to showing price-levels of support and resistance, Price Triggers also display the relative strength of these supports and resistances by displaying the Trigger Strengths. These represent areas of influence.
Opportunities often arise when PTs squeeze each other, often forcing spot to make a large move – as can be seen below:
Example 5
Frequently Asked Questions
How can I get access to the Liquidity Toolkit?
Please see the Author’s Instructions section at the top of the page for more details and information.
How can I get additional information on the indicators used?
Please see the Author’s Instructions section at the top of the page for more details and information.
I added the Liquidity Toolkit but I do not see all of the PT lines – where are they?
Depending on the chart interval, not all PT lines will be displayed. Those lower than the chart’s timeframe are hidden for clarity.
I added Liquidity Toolkit but the chart’s candles are not being filled by LS.
The chart will try to color over LS’ candles if you do not disable them. To disable, go to the Chart Settings then to Symbol and de-select Body, Borders and Wick.

Market Profile based Support/ResistanceBrought to you by Stock Kaka - Your trading sidekick 🦜📈 - pay your visit at stockkaka.my.canva.site or find us on X #StockKaka
📊 What This Indicator Does
Ever wish the market would just tell you where the important levels are? Well, buckle up, because this indicator is like having a market whisperer on your chart!
Based on cutting-edge hierarchical market structure analysis (fancy words for "smart support and resistance"), this bad boy uses ATR-based Directional Change to identify turning points that actually matter. No more guessing where price might bounce or break—let the algorithm do the heavy lifting while you sip your coffee ☕
🎯 The Five Levels Explained (From Noisy to Mighty)
Think of these levels like a pyramid of importance. Level 0 is your chatty friend who notices everything, while Level 4 is the wise oracle who only speaks when it really matters.
Level 0: The Hyperactive Scout 🐿️
What it does: Catches every little zigzag in price using ATR confirmation
Significance: Very short-term, intraday noise
Best for: Scalpers who love action every few minutes
Trader Type: "I refresh my chart 100 times an hour"
Reliability: ⭐⭐ (It's enthusiastic but easily excitable)
Level 1: The Day Trader's Buddy 🎯
What it does: Filters Level 0 to show minor swing highs/lows
Significance: Intraday support/resistance, hourly structure
Best for: Day traders, scalpers looking for better entries
Trader Type: "I close all positions before dinner"
Reliability: ⭐⭐⭐ (Solid for quick moves)
Level 2: The Swing Trader's Sweet Spot 🎪
What it does: Identifies multi-day to weekly structure points
Significance: Intermediate support/resistance where battles happen
Best for: Swing traders, position traders
Trader Type: "I hold for days, not minutes"
Reliability: ⭐⭐⭐⭐ (Now we're talking real structure!)
Level 3: The Big Money Magnet 💰
What it does: Shows major market structure—where the whales play
Significance: Weekly to monthly levels, institutional zones
Best for: Position traders, trend followers
Trader Type: "I think in weeks and months, not hours"
Reliability: ⭐⭐⭐⭐⭐ (These levels have gravitational pull!)
Level 4: The Market Prophet 🔮
What it does: Reveals ultra-major turning points (think: quarterly/yearly pivots)
Significance: Long-term macro structure, investment-grade levels
Best for: Investors, long-term position traders
Trader Type: "Warren Buffett is my spirit animal"
Reliability: ⭐⭐⭐⭐⭐⭐ (When these break, market's rewrite the story)
⚙️ Parameter Setup Guide (The Secret Sauce)
The magic ingredient is the ATR Lookback Period—think of it as teaching the indicator your timeframe's "dialect." Here's your cheat sheet:
2-Minute Chart ⚡
ATR Lookback: 720 (24 hours of 2-min bars)
Who uses this: Crypto degens, futures scalpers, adrenaline junkies
Show Levels: L0, L1, L2 (L3+ won't budge much)
Pro Tip: Enable only L1 and L2 or your chart will look like spaghetti
5-Minute Chart 🏃
ATR Lookback: 288 (24 hours of 5-min bars)
Who uses this: Active day traders, news traders
Show Levels: L1, L2, L3
Pro Tip: L2 is your best friend here—perfect for intraday swings
15-Minute Chart 📈
ATR Lookback: 96 (24 hours of 15-min bars)
Who uses this: Swing traders, patient day traders
Show Levels: L1, L2, L3
Pro Tip: This is the "Goldilocks zone"—not too fast, not too slow
1-Hour Chart ⏰
ATR Lookback: 168 (1 week of hourly bars)
Who uses this: Swing traders, position traders
Show Levels: L2, L3, L4
Pro Tip: L3 levels here are like magnets for price action
Daily Chart 📅
ATR Lookback: 30 to 50 (1-2 months)
Who uses this: Investors, long-term traders, people with patience
Show Levels: L2, L3, L4
Pro Tip: L4 on dailies = "Don't fight this level, respect it"
🎨 How to Use This Thing
Add to Chart - Duh! 😄
Set Your ATR Lookback - Use the guide above (don't wing it!)
Enable Relevant Levels - Less is more! Turn off levels that just clutter
Watch the Magic - See horizontal lines appear at key S/R zones
Check the Table - Top-right corner shows current levels (fancy!)
Set Alerts - Get notified when price approaches or breaks levels
Trading Strategies 🎲
The Bounce Play:
Price approaches Level 2 or 3 support → Look for bullish reversal signals
Take profit at the next level resistance
Stop loss just below the support level
The Breakout Play:
Price breaks through Level 2/3 resistance with volume → Go long
Next level becomes your target
Failed breakout? Level becomes resistance again (classic fake-out)
The Confluence Play:
When Level 3 aligns with your favorite indicator (RSI oversold, moving average, Fibonacci) → Chef's kiss! 👨🍳💋
These multi-confirmation setups are where the money lives
🚨 Important Notes (Read This or Blame Yourself Later)
⚠️ This indicator REPAINTS on the current bar until an extreme is confirmed. That's not a bug, it's how directional change works. The past levels are solid as a rock, but the pending one is still... pending.
⚠️ More levels ≠ Better results. Showing all 5 levels is like having 5 GPS apps shouting directions at once. Pick 2-3 levels max.
⚠️ ATR Lookback matters! Wrong setting = garbage results. Use the guide above or experiment carefully.
⚠️ Volatile markets (crypto, meme stocks) work GREAT with this. Choppy, range-bound markets? Meh.
⚠️ Combine with other tools! This shows you WHERE, not WHEN. Use momentum indicators, volume, or your favorite chicken entrails for timing 🐔
🦜 Final Word from Stock Kaka
Remember: Indicators don't make money, traders do. This tool shows you where the market has historically respected structure. What you do with that info? That's on you, champ!
Use proper risk management, don't YOLO your rent money, and may your stops never get hunted 🎯
Trade smart, trade safe, and let Stock Kaka be your guide!
📝 Credits
Algorithm: neurotrader888 (Python implementation)
Pine Script Conversion: Your friendly neighborhood Stock Kaka team!!
Inspiration: Ginger chai, market inefficiencies, and a dash of chaos
📌 Tags
support-and-resistance market-structure atr directional-change multi-timeframe swing-trading day-trading levels hierarchical-analysis algo-trading

Custom Bollinger Band Squeeze Screener [Pineify]Custom Bollinger Band Squeeze Screener
Key Features
Multi-symbol scanning: Analyze up to 6 tickers simultaneously.
Multi-timeframe flexibility: Screen across four selectable timeframes for each symbol.
Bollinger Band Squeeze algorithm: Detect volatility contraction and imminent breakouts.
Advanced ATR integration: Measure expansion and squeeze states with custom multipliers.
Customizable indicator parameters: Fine-tune Bollinger and ATR settings for tailored detection.
Visual table interface: Rapidly compare squeeze and expansion signals across all instruments.
How It Works
At the core, this screener leverages a unique blend of Bollinger Bands and Average True Range (ATR) to quantify volatility states for multiple assets and timeframes at once. For each symbol and every selected timeframe, the indicator calculates Bollinger Band width and compares it against ATR levels, offering real-time squeeze (consolidation) and expansion (breakout) signals.
Bollinger Band width is computed using standard deviations around a SMA basis.
ATR is calculated to gauge market volatility independent of price direction.
Squeeze: Triggered when BB width contracts below a multiple of ATR, forecasting lower volatility and set-up for a move.
Expansion: Triggered when BB width expands above a higher ATR multiple, signaling a high-volatility breakout.
Display: Results shown in an intuitive table, marking each status per ticker and TF.
Trading Ideas and Insights
Spot assets poised for volatility-driven breakouts.
Compare squeeze presence across timeframes for optimal entry timing.
Integrate screener results with price action or volume for high-confidence setups.
Use squeeze signals to avoid choppy or non-trending conditions.
Expand and diversify watchlists with multi-symbol coverage.
How Multiple Indicators Work Together
This script seamlessly merges Bollinger Bands and ATR with customized multipliers:
Bollinger Bands identify price consolidation and volatility squeeze zones.
ATR tailors the definition of squeeze and expansion, making signals adaptive to volatility regime changes.
By layering these with multi-symbol/multi-timeframe data, traders access a high-precision view of market readiness for trend acceleration or reversal.
The real synergy is in the screener's ability to visualize volatility states for a diverse asset selection, transforming traditional single-chart analysis into a broad market view.
Unique Aspects
Original implementation: Not a simple trend or scalping indicator; utilizes advanced volatility logic.
Fully multi-symbol and multi-timeframe support uncommon in most screeners.
Custom ATR multipliers for both squeeze and expansion allow traders to match their risk profile and market dynamics.
Visual clarity: Table structure promotes actionable insights and reduces decision fatigue.
How to Use
Add the indicator to your TradingView chart (supports any asset class including crypto, forex, stocks).
Select up to six symbols (tickers) and set your preferred timeframes.
Adjust Bollinger Band Length/Deviation and ATR multipliers to refine squeeze/expansion criteria.
Review the screener table: Look for "SQZ" (squeeze) or "EXP" (expansion) cells for entry/exit ideas.
Combine screener information with other technical or fundamental signals for trade confirmation.
Customization
Symbols: Choose any tickers for scanning.
Timeframes: Select short- to long-term intervals to match your trading style.
Bollinger Band parameters: Modify length and deviation for sensitivity.
ATR multipliers: Set low or high values to adjust squeeze/expansion triggers.
Table size and layout: Adapt display for optimal workflow.
Conclusion
The Bollinger Band Squeeze Screener Pineify delivers an innovative, SEO-friendly multi-asset solution for volatility and trend detection. Harness its original algorithmic design to uncover powerful breakout opportunities and optimize your portfolio. Whether you trade crypto with dynamic volatility or scan stocks for momentum, this tool supercharges your TradingView workflow.

ZZ TRADERS📌 ZZ Traders ALGO – Smart Trading Companion for Every Timeframe
Introducing "ZZ Traders ALGO" – a precision-built, multi-timeframe algorithm designed for GOLD traders who value accuracy, efficiency, and real-time insights.
🔹 Universal Timeframe Compatibility:
Works seamlessly across all timeframes – from scalping the 1-minute chart to analyzing long-term trends on the daily and weekly levels.
🔹 Optimized for XAU/USD (Gold):
Specially tuned to capture the unique volatility and price behavior of gold. Get smarter entries and exits with confidence.
🔹 Algorithmic Insights:
Built on advanced price action and custom logic to detect potential reversals, trend strength, and key market zones.
🔹 Simple Yet Powerful:
Clean visuals, minimal noise – just the signals that matter. Designed for both beginner and experienced traders.
🔹 Ideal for Scalping, Intraday & Swing Trading:
Whether you're in and out quickly or holding positions, ZZ Traders ALGO adapts to your style.
📈 Developed by Professional Traders, for Traders – because precision matters.
📩 For inquiries or access, contact me on WhatsApp: +92 300 8339822

Quantile-Based Adaptive Detection🙏🏻 Dedicated to John Tukey. He invented the boxplot, and I finalized it.
QBAD (Quantile-Based Adaptive Detection) is ‘the’ adaptive (also optionally weighted = ready for timeseries) boxplot with more senseful fences. Instead of hardcoded multipliers for outer fences, I base em on a set of quantile-based asymmetry metrics (you can view it as an ‘algorithmic’ counter part of central & standardized moments). So outer bands are Not hardcoded, not optimized, not cross-validated etc, simply calculated at O(nlogn).
You can use it literally everywhere in any context with any continuous data, in any task that requires statistical control, novelty || outlier detection, without worrying and doubting the sense in arbitrary chosen thresholds. Obviously, given the robust nature of quantiles, it would fit best the cases where data has problems.
The thresholds are:
Basis: the model of the data (median in our case);
Deviations: represent typical spread around basis, together form “value” in general sense;
Extensions: estimate data’s extremums via combination of quantile-based asymmetry metrics without relying on actual blunt min and max, together form “range” / ”frame”. Datapoints outside the frame/range are novelties or outliers;
Limits: based also on quantile asymmetry metrics, estimate the bounds within which values can ‘ever’ emerge given the current data generating process stays the same, together form “field”. Datapoints outside the field are very rare, happen when a significant change/structural break happens in current data-generating process, or when a corrupt datapoint emerges.
…
The first part of the post is for locals xd, the second is for the wanderers/wizards/creators/:
First part:
In terms of markets, mostly u gotta worry about dem instruments that represent crypto & FX assets: it’s either activity hence data sources there are decentralized, or data is fishy.
For a higher algocomplexity cost O(nlong), unlike MBAD that is 0(n), this thing (a control system in fact) works better with ishy data (contaminated with wrong values, incomplete, missing values etc). Read about the “ breakdown point of an estimator ” if you wanna understand it.
Even with good data, in cases when you have multiple instruments that represent the same asset, e.g. CL and BRN futures, and for some reason you wanna skip constructing a proper index of em (while you should), QBAD should be better put on each instrument individually.
Another reason to use this algo-based rather than math-based tool, might be in cases when data quality is all good, but the actual causal processes that generate the data are a bit inconsistent and/or possess ‘increased’ activity in a way. SO in high volatility periods, this tool should provide better.
In terms of built-ins you got 2 weightings: by sequence and by inferred volume delta. The former should be ‘On’ all the time when you work with timeseries, unless for a reason you want to consciously turn it off for a reason. The latter, you gotta keep it ‘On’ unless you apply the tool on another dataset that ain’t got that particular additional dimension.
Ain’t matter the way you gonna use it, moving windows, cumulative windows with or without anchors, that’s your freedom of will, but some stuff stays the same:
Basis and deviations are “value” levels. From process control perspective, if you pls, it makes sense to Not only fade or push based on these levels, but to also do nothing when things are ambiguous and/or don’t require your intervention
Extensions and limits are extreme levels. Here you either push or fade, doing nothing is not an option, these are decisive points in all the meanings
Another important thing, lately I started to see one kind of trend here on tradingview as well and in general in near quant sources, of applying averages, percentiles etc ‘on’ other stationary metrics, so called “indicators”. And I mean not for diagnostic or development reasons, for decision making xd
This is not the evil crime ofc, but hillbilly af, cuz the metrics are stationary it means that you can model em, fit a distribution, like do smth sharper. Worst case you have Bayesian statistics armed with high density intervals and equal tail intervals, and even some others. All this stuff is not hard to do, if u aint’t doing it, it’s on you.
So what I’m saying is it makes sense to apply QBAD on returns ‘of your strategy’, on volume delta, but Not on other metrics that already do calculations over their own moving windows.
...
Second part:
Looks like some finna start to have lil suspicions, that ‘maybe’ after all math entities in reality are more like blueprints, while actual representations are physical/mechanical/algorithmic. Std & centralized moments is a math entity that represents location, scale & asymmetry info, and we can use it no problem, when things are legit and consistent especially. Real world stuff tho sometimes deviates from that ideal, so we need smth more handy and real. Add to the mix the algo counter part of means: quantiles.
Unlike the legacy quantile-based asymmetry metrics from the previous century (check quantile skewness & kurtosis), I don’t use arbitrary sets of quantiles, instead we get a binary pattern that is totally geometric & natural (check the code if interested, I made it very damn explicit). In spirit with math based central & standardized moments, each consequent pair is wider empathizing tail info more and more for each higher order metric.
Unlike the classic box plot, where inner thresholds are quartiles and the rest are based on em, here the basis is median (minimises L1), I base inner thresholds on it, and we continue the pattern by basing the further set of levels on the previous set. So unlike the classic box plot, here we have coherency in construction, symmetry.
Another thing to pay attention to, tho for some reason ain’t many talk about it, it’s not conceptually right to think that “you got data and you apply std moments on it”. No, you apply it to ‘centered around smth’ data. That ‘smth’ should minimize L2 error in case of math, L1 error in case of algo, and L0 error in case of learning/MLish/optimizational/whatever-you-cal-it stuff. So in the case of L0, that’s actually the ‘mode’ of KDE, but that’s for another time. Anyways, in case of L2 it’s mean, so we center data around mean, and apply std moments on residuals. That’s the precise way of framing it. If you understand this, suddenly very interesting details like 0th and 1st central moments start to make sense. In case of quantiles, we center data around the median, and do further processing on residuals, same.
Oth moment (I call it init) is always 1, tho it’s interesting to extrapolate backwards the sequence for higher order moments construction, to understand how we actually end up with this zero.
1st moment (I call it bias) of residuals would be zero if you match centering and residuals analysis methods. But for some reason you didn’t do that (e.g centered data around midhinge or mean and applied QBAD on the centered data), you have to account for that bias.
Realizing stuff > understanding stuff
Learning 2981234 human invented fields < realizing the same unified principles how the Universe works
∞
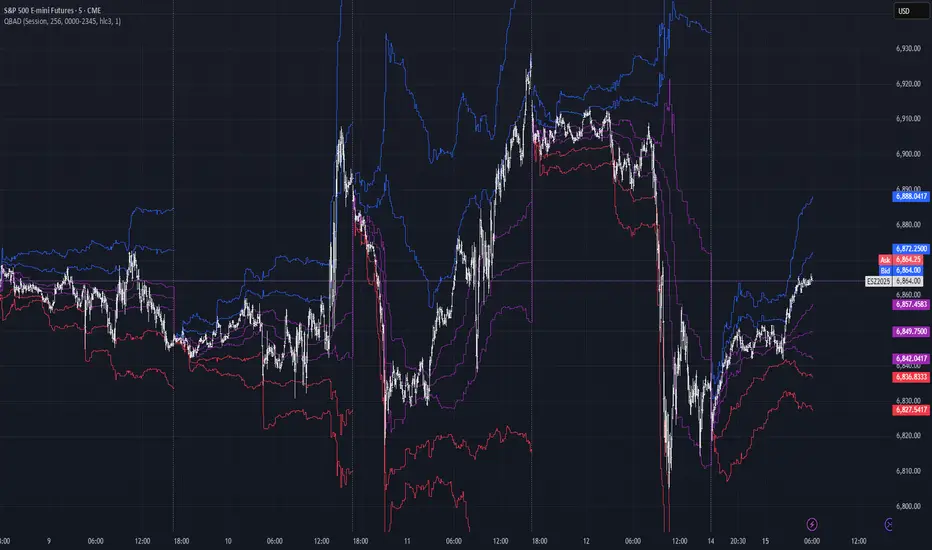
RVol+ Enhanced Relative Volume Indicator📊 RVol+ Enhanced Relative Volume Indicator
Overview
RVol+ (Relative Volume Plus) is an advanced time-based relative volume indicator designed specifically for swing traders and breakout detection. Unlike simple volume comparisons, RVol+ analyzes volume at the same time of day across multiple sessions, providing statistically significant insights into institutional activity and breakout potential.
🎯 Key Features
Core Volume Analysis
Time-Based RVol Calculation - Compares current cumulative volume to the average volume at this exact time over the past N days
Statistical Z-Score - Measures volume in standard deviations from the mean for true anomaly detection
Volume Percentile - Shows where current volume ranks historically (0-100%)
Sustained Volume Filter - 3-bar moving average prevents false signals from single-bar spikes
Breakout Detection
🚀 Confirmed Breakouts - Identifies price breakouts validated by high volume (RVol > 1.5x)
⚠️ False Breakout Warnings - Alerts when price breaks key levels on low volume (high failure risk)
Multi-Timeframe Context - Weekly volume overlay prevents chasing daily noise
Advanced Metrics
OBV Divergence Detection - Spots bullish/bearish accumulation/distribution patterns
Volume Profile Integration - Identifies institutional positioning
Money Flow Analysis - Tracks smart money vs retail activity
Extreme Volume Alerts - 🔥 Labels mark unusual spikes beyond the display cap
Visual Intelligence
Smart Color Coding:
🟢 Bright Teal = High activity (RVol ≥ 1.5x)
🟡 Medium Teal = Caution zone (RVol ≥ 1.2x)
⚪ Light Teal = Normal activity
🟠 Orange = Breakout confirmed
🔴 Red = False breakout risk
Comprehensive Stats Table:
Current Volume (formatted as M/K/B)
RVol ratio
Z-Score with significance
Volume percentile
Historical average and standard deviation
Sustained volume confirmation
📈 How to Use
For Swing Trading (1D - 3W Holds)
Perfect Setup:
✓ RVol > 1.5x (bright teal)
✓ Z-Score > 2.0 (⚡ alert)
✓ Percentile > 90%
✓ Sustained = ✓
✓ 🚀 Breakout label appears
Avoid:
✗ Red "Low Vol" warning during breakouts
✗ RVol < 1.0 at key levels
✗ Sustained volume not confirmed
Signal Interpretation
⚡ Z>2 Labels - Statistically significant volume (95th+ percentile) - highest probability moves
↗️ OBV+ Labels - Bullish accumulation (OBV rising while price consolidates)
↘️ OBV- Labels - Bearish distribution (OBV falling while price rises)
🔵 Blue Background - Weekly volume elevated (confirms daily strength)
⚙️ Customization
Basic Settings
N Day Average - Number of historical days for comparison (default: 5)
RVol Thresholds - Customize highlight levels (default: 1.2x, 1.5x)
Visual Display Cap - Prevent extreme spikes from compressing view (default: 4.0x)
Advanced Metrics (Toggle On/Off)
Z-Score analysis
Weekly RVol context
OBV divergence detection
Volume percentile ranking
Breakout signal generation
Table Customization
Position - 9 placement options to avoid chart overlap
Size - Tiny to Huge
Colors - Full customization of positive/negative/neutral values
Transparency - Adjustable background
Debug Mode
Enable Pine Logs for calculation transparency
Adjustable log frequency
Real-time calculation breakdown
🔬 Technical Details
Algorithm:
Binary search for historical lookups (O(log n) performance)
Time-zone aware session detection
DST-safe timestamp calculations
Exponentially weighted standard deviation
Anti-repainting architecture
Performance:
Optimized for max_bars_back = 5000
Efficient array management
Built-in function optimization
Memory-conscious data structures
📊 What Makes RVol+ Different?
vs. Standard Volume:
Context-aware (time-of-day matters)
Statistical significance testing
False breakout filtering
vs. Basic RVol:
Z-Score normalization (2-3 sigma detection)
Multi-timeframe confirmation
OBV divergence integration
Sustained volume filtering
Smart visual scaling
vs. Professional Tools:
Free and open-source
Fully customizable
No black-box algorithms
Educational debug logs
💡 Best Practices
Wait for Confirmation - Don't enter on first bar; wait for sustained volume ✓
Combine with Price Action - RVol validates, price structure determines entry
Weekly Context Matters - Blue background = institutional interest
Z-Score is King - Focus on ⚡ alerts for highest probability
Avoid Low Volume Breakouts - Red ⚠️ labels = high failure risk
🎓 Trading Psychology
Volume precedes price. When RVol+ shows:
High RVol + Rising OBV = Accumulation before breakout
High RVol at Resistance = Test of conviction
Low RVol on Breakout = Retail-driven (fade candidate)
Z-Score > 3 = Potential "whale" positioning
📝 Credits
Based on the time-based RVol concept from /u/HurlTeaInTheSea, enhanced with:
Statistical analysis (z-scores, percentiles)
Multi-timeframe integration
OBV divergence detection
Professional-grade visualization
Swing trading optimization
🔧 Version History
v2.0 - Enhanced Edition
Added Z-Score analysis
Multi-timeframe volume context
OBV divergence detection
Breakout confirmation system
Smart color coding
Customizable stats table
Debug logging mode
Performance optimizations
📚 Learn More
For optimal use with swing trading:
Combine with support/resistance levels
Watch for volume clusters in consolidation
Use weekly timeframe for trend confirmation
Monitor OBV divergence for early warnings
⚠️ Disclaimer
This indicator is for educational purposes. Volume analysis is one component of trading decisions. Always use proper risk management, consider multiple timeframes, and validate signals with price structure. Past performance does not guarantee future results.
🚀 Getting Started
Add indicator to chart
Adjust "N Day Average" to your preference (5-10 days typical)
Position stats table to avoid overlap
Enable features you want to monitor
Watch for 🚀 breakout confirmations!
Happy Trading! 📈

Elite Zone Master Pro - Advanced Multi-Session Trading System🚀 Elite Zone Master Pro - Advanced Multi-Session Trading System
🎯 ORIGINALITY & UNIQUE VALUE PROPOSITION
Elite Zone Master Pro is NOT a simple mashup of existing indicators. It's a proprietary trading system that combines three distinct methodologies into a unified, synergistic approach:
Multi-Session Zone Analysis - Original algorithm for tracking global market sessions
Dynamic Opening Range Breakout (ORB) - Enhanced ORB with bias-aware signal filtering
Advanced Fair Value Gap Detection - Proprietary FVG identification with smart mitigation tracking
🔧 Why This Combination Works
The power lies in how these components work together, not separately:
Session zones provide market context and volatility windows
ORB system identifies key breakout levels during optimal timeframes
FVG detection pinpoints precise entry locations within the ORB framework
Integrated bias system filters signals based on range direction momentum
🧠 DETAILED METHODOLOGY & CALCULATIONS
🌍 1. Multi-Session Zone Framework
What it does: Tracks and visualizes three major global trading sessions simultaneously.
How it works:
Dynamic zone tracking algorithm that calculates session highs/lows in real-time
Adaptive box rendering that expands/contracts based on actual price movement
Session overlap detection for identifying high-volatility periods
Time-weighted zone positioning using custom timezone calculations
Original concepts:
Simultaneous multi-session visualization (not found in standard session indicators)
Dynamic zone expansion based on volatility, not fixed time periods
Cross-session momentum analysis for bias determination
🎯 2. Enhanced Opening Range Breakout System
What it does: Identifies breakout opportunities from predefined session ranges with intelligent bias filtering.
How it works:
Multi-session ORB calculation: Supports US (16:30-16:45), EU (10:00-10:15), Asian (03:00-03:15), and custom sessions
Dynamic range establishment: Range is built in real-time during active session periods
Bias-aware signal filtering: Two-tier breakout system based on range midpoint momentum
Range direction analysis: Compares current range midpoint to previous session's midpoint
Original methodology:
Range Bias Calculation:
- If Current_Midpoint > Previous_Midpoint = Bullish Bias (+1)
- If Current_Midpoint < Previous_Midpoint = Bearish Bias (-1)
- If Current_Midpoint = Previous_Midpoint = Neutral Bias (0)
Signal Logic:
- Bullish Bias: Standard breakout above range high
- Bearish Bias: Enhanced breakout (range_high + 0.5 * range_width) for bullish signals
- Neutral Bias: Standard breakouts both directions
⚡ 3. Advanced Fair Value Gap (FVG) Detection
What it does: Identifies and tracks fair value gaps with automatic mitigation detection.
How it works:
Three-bar gap analysis: Compares current bar relationships to identify true gaps
Dynamic threshold calculation: Auto-adjusting sensitivity based on market volatility
Smart mitigation tracking: Automatically removes filled gaps from display
Directional bias integration: Color-codes gaps based on their directional implication
Proprietary algorithms:
Bullish FVG Criteria:
- Current_Low > High (gap condition)
- Close > High (confirmation)
- (Current_Low - High ) / High > Threshold (significance filter)
Bearish FVG Criteria:
- Current_High < Low (gap condition)
- Close < Low (confirmation)
- (Low - Current_High) / Current_High > Threshold (significance filter)
Mitigation Logic:
- Bullish FVG: Mitigated when Close < FVG_Low
- Bearish FVG: Mitigated when Close > FVG_High
📈 4. Session-Based Moving Average System
What it does: Calculates moving averages that reset and adapt to session boundaries.
How it works:
Session-aware length calculation: Effective length = min(bars_since_session_start, user_length)
Multiple MA types: EMA, SMA, RMA, WMA, VWMA with session-specific calculations
Dynamic smoothing: Adapts to session length for consistent signals across different session durations
🔄 INTEGRATED SYSTEM SYNERGY
🎯 How Components Work Together
Context Layer: Session zones provide market timing context
Setup Layer: ORB system identifies breakout opportunities within optimal timeframes
Entry Layer: FVG detection pinpoints precise entry levels
Filter Layer: Bias system ensures alignment with momentum direction
Confirmation Layer: Session MA provides trend confirmation
🧭 Signal Generation Process
Step 1: Session Analysis
- Identify active trading session
- Calculate session volatility metrics
- Establish range boundaries
Step 2: Range Bias Calculation
- Compare current vs previous range midpoints
- Assign directional bias (-1, 0, +1)
- Adjust breakout thresholds accordingly
Step 3: Breakout Detection
- Monitor price interaction with range boundaries
- Apply bias-specific breakout criteria
- Generate preliminary signals
Step 4: FVG Confirmation
- Scan for fair value gaps within range
- Validate gap significance using dynamic thresholds
- Provide entry refinement opportunities
Step 5: Signal Validation
- Cross-reference with session MA direction
- Ensure alignment with overall bias
- Output final trading signals
📊 PRACTICAL IMPLEMENTATION
🎯 Trading Strategy Framework
Setup Phase:
Configure session times for your timezone
Enable preferred sessions (US/EU/Asian)
Adjust FVG sensitivity based on instrument volatility
Execution Phase:
Wait for range establishment during active session
Monitor for bias-aligned breakouts
Look for FVG retest opportunities
Enter trades with ORB-based stop losses
Risk Management:
Stop loss placement: Outside ORB range boundaries
Position sizing: Based on range width volatility
Trade direction: Must align with calculated range bias
🎨 UNIQUE VISUAL IMPLEMENTATION
📊 Advanced Visualization Features
Multi-layered zone rendering with transparency controls
Dynamic range boxes that adapt to price movement
Smart label positioning to avoid chart clutter
Color-coded bias indication through range fills
Progressive FVG display with automatic cleanup
🔧 TECHNICAL SPECIFICATIONS
⚙️ Performance Optimizations
Efficient array management for FVG tracking
Memory optimization through historical data cleanup
Smart rendering to prevent chart overload
Error handling for edge cases and invalid timeframes
📈 Compatibility
All timeframes under 1 day
All instruments (Forex, Stocks, Crypto, Futures)
All chart types with overlay capability
Mobile and desktop platform support
🏆 WHAT MAKES THIS DIFFERENT FROM OTHER INDICATORS
❌ Standard ORB indicators: Only show basic range breakouts without bias consideration
❌ Basic FVG indicators: Don't integrate with session analysis or range systems
❌ Session indicators: Simply highlight time periods without actionable trading signals
❌ Moving average indicators: Don't adapt to session dynamics
✅ Elite Zone Master Pro: Combines all elements with proprietary logic for a complete trading system
📋 USE CASES & MARKET APPLICATION
🎯 Primary Applications
Forex day trading during major session overlaps
Index futures scalping using session-specific ranges
Cryptocurrency swing trading with 24/7 session analysis
Stock market opening range breakout strategies
📊 Performance Characteristics
Best performance: During high-volatility session transitions
Optimal timeframes: 1m to 4H for intraday trading
Risk-reward ratios: Typically 1:2 to 1:4 based on range width
Win rate: Higher probability when all components align
This indicator represents months of development combining institutional trading concepts with retail accessibility. It's not just another indicator - it's a complete trading methodology in one comprehensive tool.
[blackcat] L3 Improved Dual Ehlers BPF for Volatility DetectionOVERVIEW
This script implements an advanced L3 Improved Dual Ehlers Bandpass Filter (BPF) for volatility detection, combining both L1 and L2 calculation methods to create a comprehensive trading signal. The script leverages John Ehlers' sophisticated digital signal processing techniques to identify market cycles and extract meaningful trading signals from price action. By combining multiple cycle detection methods and filtering approaches, it provides traders with a powerful tool for identifying trend changes, momentum shifts, and potential reversal points across various market conditions and timeframes. The L3 approach uniquely combines the outputs of both L1 (01 range) and L2 (-11 range) methods, creating a signal that ranges from -1~2 and provides enhanced sensitivity to market dynamics.
FEATURES
🔄 Dual Calculation Methods: Choose between L1 (01 range), L2 (-11 range), or combine both for L3 signal (-1~2 range) to match your trading style
📊 Multiple Cycle Detection: Seven different dominant cycle calculation methods including HoDyDC (Hilbert Transform Dominant Cycle), PhAcDC (Phase Accumulation Dominant Cycle), DuDiDC (Duane Dominant Cycle), CycPer (Cycle Period), BPZC (Bandpass Zero Crossing), AutoPer (Autocorrelation Period), and DFTDC (Discrete Fourier Transform Dominant Cycle)
🎛️ Flexible Mixing Options: Six sophisticated mixing methods including weighted averaging, simple sum, difference extraction, dominant-only, subdominant-only, and adaptive mixing that adjusts based on signal strength
🌊 Bandpass Filtering: Precise bandwidth control for both dominant and subdominant filters, allowing fine-tuning of frequency response characteristics
📈 Advanced Divergence Detection: Robust algorithm for identifying bullish and bearish divergences with customizable lookback periods and range constraints
🎨 Comprehensive Visualization: Extensive customization options for all signals, colors, plot styles, and display elements
🔔 Comprehensive Alert System: Built-in alerts for divergence signals, zero line crosses, and various market conditions
📊 Real-time Cycle Information: Optional display of dominant and subdominant cycle periods for educational purposes
🔄 Adaptive Signal Processing: Dynamic adjustment of parameters based on market conditions and volatility
🎯 Multiple Signal Outputs: Simultaneous generation of L1, L2, and L3 signals for different trading strategies
HOW TO USE
Select Calculation Method: Choose between "l1" (01 range), "l2" (-11 range), or "both" (L3, -1~2 range) in the Calculation Method settings based on your preferred signal characteristics
Configure Cycle Detection: Select your preferred Dominant Cycle Method from the seven available options and adjust the Cycle Part parameter (0.1-0.9) to fine-tune cycle sensitivity
Set Subdominant Parameters: Configure the subdominant cycle either as a ratio of the dominant cycle or as a fixed period, depending on your analysis approach
Adjust Filter Bandwidth: Fine-tune the bandwidth settings for both dominant and subdominant filters (0.1-1.0) to control the frequency response and signal smoothing
Choose Mixing Method: Select how to combine the filters - weighted averaging for balance, sum for maximum sensitivity, difference for trend isolation, or adaptive mixing for dynamic response
Configure Smoothing: Select from SMA, EMA, or HMA smoothing methods with adjustable length (1-20 bars) to reduce noise in the final signal
Customize Visualization: Enable/disable individual plots, divergence detection, zero line, fill areas, and customize all colors to match your chart preferences
Set Divergence Parameters: Configure lookback ranges (5-60 bars) for divergence detection to match your trading timeframe and style
Monitor Signals: Watch for crosses above/below zero line and divergence patterns, paying attention to signal strength and consistency
Set Up Alerts: Configure alerts for divergence signals, zero line crosses, and other market conditions to stay informed of trading opportunities
LIMITATIONS
The script requires the dc_ta library from blackcat1402 for several advanced cycle calculation methods (HoDyDC, PhAcDC, DuDiDC, CycPer, BPZC, AutoPer, DFTDC)
L1 method operates in 01 range while L2 method uses -11 range, requiring different interpretation approaches
Combined L3 signal ranges from -1~2 when both methods are selected, creating unique signal characteristics that traders must adapt to
Divergence detection accuracy depends on proper lookback period settings and market volatility conditions
Performance may be impacted with very long lookback ranges (>60 bars) or when multiple plots are simultaneously enabled
The script is designed for non-overlay use and may not display correctly on certain chart types or with conflicting indicators
Adaptive mixing method requires careful threshold tuning to avoid excessive signal fluctuation
Cycle detection algorithms may produce unreliable results during low volatility or highly choppy market conditions
The script assumes regular price data and may not perform optimally with irregular or gapped price sequences
NOTES
The script implements advanced mathematical calculations including bandpass filters, Hilbert transforms, and various cycle detection algorithms developed by John Ehlers
For optimal results, experiment with different cycle detection methods and bandwidth settings across various market conditions and timeframes
The adaptive mixing method automatically adjusts weights based on signal strength, providing dynamic response to changing market conditions
Divergence detection works best when the "Plot Divergence" option is enabled and when combined with other technical analysis tools
Zero line crosses can indicate potential trend changes or momentum shifts, especially when confirmed by volume or other indicators
The script includes commented code for cycle information display that can be enabled if you want to monitor cycle periods in real-time
Different calculation methods may perform better in different market environments - L1 tends to be smoother while L2 is more sensitive
The subdominant cycle helps filter out noise and provides additional confirmation for signals generated by the dominant cycle
Bandwidth settings control the filter's frequency response - lower values provide more smoothing while higher values increase sensitivity
Mixing methods offer different approaches to combining signals - weighted averaging is generally most reliable for most trading applications
THANKS
Special thanks to John Ehlers for his pioneering work in cycle analysis and digital signal processing for financial markets. This script implements and significantly improves upon his bandpass filter methodology, incorporating multiple advanced techniques from his extensive body of work. Also heartfelt thanks to blackcat1402 for the dc_ta library that provides essential cycle calculation methods and for maintaining such a valuable resource for the Pine Script community. Additional appreciation to the TradingView platform for providing the tools and environment that make sophisticated technical analysis accessible to traders worldwide. This script represents a collaborative effort in advancing the field of algorithmic trading and technical analysis.
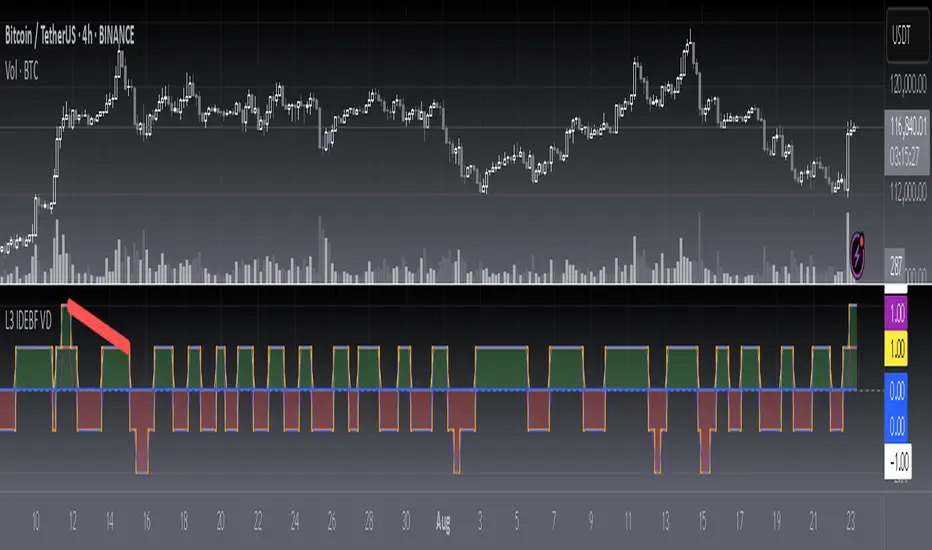
Trend Seeker [Capt.LAB] Trend Seeker By Captain Trading LAB
Trend Seeker is an advanced trend-following indicator designed to identify high-probability trading opportunities through proprietary market analysis algorithms. Built for traders who demand precision and reliability, this indicator seamlessly combines multiple layers of market intelligence to deliver clear, actionable signals.
Key Features
1. Intelligent Trend Detection
- Proprietary algorithm identifies market structure shifts with high accuracy
- Dynamic adaptation to changing market conditions in real-time
- Clear visual representation with customizable color schemes for instant trend recognition
2. Advanced Signal Generation
- Sophisticated Buy/Sell signals based on multi-factor momentum analysis
- Built-in noise reduction system eliminates false signals
- Adaptive signal generation that responds to market volatility
3. Market Environment Filtering
- Smart sideways market detection prevents trading in choppy conditions
- Optional trend-following filter ensures signals align with dominant market direction
- Intelligent filtering system adapts to various market conditions
4. Risk Management Integration
- Automatic Stop Loss calculation based on market volatility
- Predefined Risk:Reward ratios for systematic position sizing
- Visual TP/SL boxes that dynamically extend until targets are reached
5. Professional Trend Visualization
- Dynamic trend ribbon adjusts to market conditions
- Clear distinction between bullish and bearish market phases
- Trend boundaries serve as dynamic support and resistance levels
Application Guidelines
Setup Instructions
1. Add indicator through TradingView's Indicators menu
2. Search for "Trend Seeker" and add to your chart
3. Customize visual appearance through the settings panel
4. Enable alerts for automated signal notifications
Best Practices
- Multi-Timeframe Analysis : Confirm higher timeframe trends before taking signals
- Trend Alignment : Prioritize buy signals in uptrends, sell signals in downtrends
- Risk Management : Always respect the suggested Stop Loss levels
- Market Conditions : Avoid trading when sideways filter indicates ranging markets
Trading Methodology
1. Entry Signals
- Wait for clear Buy/Sell labels to appear on chart
- Ensure market conditions favor the signal direction
- Enter positions at market price or set limit orders
2. Position Management
- Place Stop Loss at the indicated SL level
- Set Take Profit at the calculated TP level
- Monitor trend ribbon for potential trend changes
3. Exit Strategy
- Exit at predetermined TP level for systematic profits
- Close position if Stop Loss is triggered
- Consider early exit if opposite signal appears
Alert Configuration
The indicator supports comprehensive alerts for:
- Buy Signal detection
- Sell Signal detection
- Trend direction changes
- Price reaching TP/SL levels
Configure alerts through TradingView's alert menu after adding the indicator.
Visual Components
- Buy/Sell Signals : Clear labels with customizable colors
- TP/SL Boxes : Visual representation of risk and reward zones
- Trend Ribbon : Dynamic trend visualization with color-coded direction
- Entry Lines : Precise entry level markers for trade execution
Risk Disclaimer
Trend Seeker is provided for educational and informational purposes only. Trading financial markets carries substantial risk and may not be suitable for all investors. Past performance does not guarantee future results. Always conduct thorough testing in demo environments before live trading. The developer assumes no responsibility for any trading losses incurred while using this indicator.
Summary
Trend Seeker represents a comprehensive trading solution that combines advanced market analysis with practical risk management. Its proprietary algorithms and multi-layered approach provide traders with a systematic method for capturing trending market movements while managing risk effectively.

Real Cumulative Delta VolumeReal Cumulative Delta Volume (CDV) - Enhanced Volume Flow Analysis
What This Indicator Does
This indicator calculates cumulative delta volume using an enhanced approximation methodology that analyzes buying and selling pressure within each candlestick. It provides traders with insights into volume flow dynamics by tracking the cumulative difference between estimated buy and sell volumes over time.
Technical Methodology & Calculation Details
Volume Distribution Algorithm: The indicator uses a price-weighted distribution method to estimate buy and sell volumes within each bar:
Delta multiplier = (close - low) / (high - low)
Buy volume = total volume × delta multiplier
Sell volume = total volume × (1 - delta multiplier)
Net delta = buy volume - sell volume
Cumulative Delta Tracking: Unlike basic volume indicators, this approach maintains a running cumulative total of net delta values:
CDV Open = Previous CDV Close
CDV Close = Previous CDV Close + Net Delta
CDV High/Low = Previous CDV Close + estimated intrabar extremes
Enhanced Features Beyond Standard CDV:
Divergence Detection: Automatically identifies when price direction conflicts with volume flow direction
Body Size Analysis: Compares current vs previous CDV candle body sizes to detect momentum changes
Conditional Color Coding: Special visual alerts when specific price/volume relationships occur
Signal Generation: Buy/sell signals based on divergence resolution patterns
How This Differs from Basic Cumulative Delta
Standard Limitations Addressed:
Most cumulative delta indicators on TradingView use simple uptick/downtick classification. This indicator enhances the approach by:
Price-Weighted Distribution: Instead of assuming 50/50 volume splits, uses the bar's price action (close relative to high/low) to estimate volume distribution
OHLC Representation: Displays CDV as candlesticks rather than just a line, showing intrabar volume dynamics
Integrated Divergence Detection: Built-in algorithms identify price/volume conflicts automatically
Advanced Signal Logic: Multi-condition signal generation beyond simple crossovers
Visual Enhancement Features:
Dual display modes (candlestick or line)
Special color coding for divergence conditions
Moving average overlays for trend confirmation
Optional buy/sell signal markers
Signal Generation Logic
Buy Signals Generated When:
Previous bar showed bearish divergence (price down, CDV up)
Current CDV candle shows specific color condition
Current CDV body is contained within previous divergence body
Price closes above previous high
Sell Signals Generated When:
Previous bar showed bullish divergence (price up, CDV down)
Current CDV candle shows specific color condition
Current CDV body is contained within previous divergence body
Price closes below previous low
Trading Applications
Volume Flow Analysis:
Identify periods of hidden accumulation or distribution
Spot when large players are buying/selling against the price trend
Confirm trend strength through volume alignment
Divergence Trading:
Early warning system for potential reversals
Identify when price movements lack volume support
Time entries based on divergence resolution
Trend Confirmation:
Use CDV direction to confirm price trend validity
Moving averages on CDV provide additional trend context
Volume momentum changes often precede price momentum shifts
Display Options & Settings
Visual Modes:
Candlestick: Full OHLC representation of cumulative delta
Line: Simplified cumulative line display
Moving Averages:
Optional SMA overlays (default: 50, 200 periods)
Optional EMA overlays (default: 50, 200 periods)
Customizable periods and colors
Signal Controls:
Toggle buy/sell signals on/off independently
Customizable colors for all visual elements
Adjustable transparency and styling options
Usage Guidelines & Limitations
Best Practices:
Most effective on timeframes 15m and higher due to volume data quality
Works best in liquid markets with consistent volume
Should be used alongside price action analysis and support/resistance levels
Signals are more reliable during trending market conditions
Technical Limitations:
Uses approximation methods due to lack of tick-by-tick data in Pine Script
Volume distribution estimates may be less accurate during gaps or low-volume periods
Effectiveness depends on quality of volume data from your broker/exchange
Market Context Considerations:
Less reliable during market holidays or extremely low volume sessions
News events and earnings can cause volume anomalies that affect calculations
Consider market microstructure when interpreting signals on very short timeframes
Important Disclaimers
Educational Purpose: This indicator is designed for educational and analysis purposes. It does not constitute financial or investment advice.
Risk Warning: All trading involves risk of loss. Past performance of any indicator signals does not guarantee future results.
Testing Required: Users should thoroughly backtest and forward test this indicator before using it in live trading. Paper trading is recommended to understand signal behavior.
No Guarantees: The developer makes no claims about profitability or accuracy. Market conditions change and historical effectiveness may not continue.
Proper Usage: This is a technical analysis tool, not a complete trading system. Always use appropriate risk management, position sizing, and combine with other forms of analysis.
Developer: Delta Merge Professional Trading Applications
Access Instructions: Send a private message through TradingView explaining your trading experience and how you plan to use this indicator. Access is provided to traders who demonstrate understanding of volume analysis concepts and proper risk management practices.

Langlands-Operadic Möbius Vortex (LOMV)Langlands-Operadic Möbius Vortex (LOMV)
Where Pure Mathematics Meets Market Reality
A Revolutionary Synthesis of Number Theory, Category Theory, and Market Dynamics
🎓 THEORETICAL FOUNDATION
The Langlands-Operadic Möbius Vortex represents a groundbreaking fusion of three profound mathematical frameworks that have never before been combined for market analysis:
The Langlands Program: Harmonic Analysis in Markets
Developed by Robert Langlands (Fields Medal recipient), the Langlands Program creates bridges between number theory, algebraic geometry, and harmonic analysis. In our indicator:
L-Function Implementation:
- Utilizes the Möbius function μ(n) for weighted price analysis
- Applies Riemann zeta function convergence principles
- Calculates quantum harmonic resonance between -2 and +2
- Measures deep mathematical patterns invisible to traditional analysis
The L-Function core calculation employs:
L_sum = Σ(return_val × μ(n) × n^(-s))
Where s is the critical strip parameter (0.5-2.5), controlling mathematical precision and signal smoothness.
Operadic Composition Theory: Multi-Strategy Democracy
Category theory and operads provide the mathematical framework for composing multiple trading strategies into a unified signal. This isn't simple averaging - it's mathematical composition using:
Strategy Composition Arity (2-5 strategies):
- Momentum analysis via RSI transformation
- Mean reversion through Bollinger Band mathematics
- Order Flow Polarity Index (revolutionary T3-smoothed volume analysis)
- Trend detection using Directional Movement
- Higher timeframe momentum confirmation
Agreement Threshold System: Democratic voting where strategies must reach consensus before signal generation. This prevents false signals during market uncertainty.
Möbius Function: Number Theory in Action
The Möbius function μ(n) forms the mathematical backbone:
- μ(n) = 1 if n is a square-free positive integer with even number of prime factors
- μ(n) = -1 if n is a square-free positive integer with odd number of prime factors
- μ(n) = 0 if n has a squared prime factor
This creates oscillating weights that reveal hidden market periodicities and harmonic structures.
🔧 COMPREHENSIVE INPUT SYSTEM
Langlands Program Parameters
Modular Level N (5-50, default 30):
Primary lookback for quantum harmonic analysis. Optimized by timeframe:
- Scalping (1-5min): 15-25
- Day Trading (15min-1H): 25-35
- Swing Trading (4H-1D): 35-50
- Asset-specific: Crypto 15-25, Stocks 30-40, Forex 35-45
L-Function Critical Strip (0.5-2.5, default 1.5):
Controls Riemann zeta convergence precision:
- Higher values: More stable, smoother signals
- Lower values: More reactive, catches quick moves
- High frequency: 0.8-1.2, Medium: 1.3-1.7, Low: 1.8-2.3
Frobenius Trace Period (5-50, default 21):
Galois representation lookback for price-volume correlation:
- Measures harmonic relationships in market flows
- Scalping: 8-15, Day Trading: 18-25, Swing: 25-40
HTF Multi-Scale Analysis:
Higher timeframe context prevents trading against major trends:
- Provides market bias and filters signals
- Improves win rates by 15-25% through trend alignment
Operadic Composition Parameters
Strategy Composition Arity (2-5, default 4):
Number of algorithms composed for final signal:
- Conservative: 4-5 strategies (higher confidence)
- Moderate: 3-4 strategies (balanced approach)
- Aggressive: 2-3 strategies (more frequent signals)
Category Agreement Threshold (2-5, default 3):
Democratic voting minimum for signal generation:
- Higher agreement: Fewer but higher quality signals
- Lower agreement: More signals, potential false positives
Swiss-Cheese Mixing (0.1-0.5, default 0.382):
Golden ratio φ⁻¹ based blending of trend factors:
- 0.382 is φ⁻¹, optimal for natural market fractals
- Higher values: Stronger trend following
- Lower values: More contrarian signals
OFPI Configuration:
- OFPI Length (5-30, default 14): Order Flow calculation period
- T3 Smoothing (3-10, default 5): Advanced exponential smoothing
- T3 Volume Factor (0.5-1.0, default 0.7): Smoothing aggressiveness control
Unified Scoring System
Component Weights (sum ≈ 1.0):
- L-Function Weight (0.1-0.5, default 0.3): Mathematical harmony emphasis
- Galois Rank Weight (0.1-0.5, default 0.2): Market structure complexity
- Operadic Weight (0.1-0.5, default 0.3): Multi-strategy consensus
- Correspondence Weight (0.1-0.5, default 0.2): Theory-practice alignment
Signal Threshold (0.5-10.0, default 5.0):
Quality filter producing:
- 8.0+: EXCEPTIONAL signals only
- 6.0-7.9: STRONG signals
- 4.0-5.9: MODERATE signals
- 2.0-3.9: WEAK signals
🎨 ADVANCED VISUAL SYSTEM
Multi-Dimensional Quantum Aura Bands
Five-layer resonance field showing market energy:
- Colors: Theme-matched gradients (Quantum purple, Holographic cyan, etc.)
- Expansion: Dynamic based on score intensity and volatility
- Function: Multi-timeframe support/resistance zones
Morphism Flow Portals
Category theory visualization showing market topology:
- Green/Cyan Portals: Bullish mathematical flow
- Red/Orange Portals: Bearish mathematical flow
- Size/Intensity: Proportional to signal strength
- Recursion Depth (1-8): Nested patterns for flow evolution
Fractal Grid System
Dynamic support/resistance with projected L-Scores:
- Multiple Timeframes: 10, 20, 30, 40, 50-period highs/lows
- Smart Spacing: Prevents level overlap using ATR-based minimum distance
- Projections: Estimated signal scores when price reaches levels
- Usage: Precise entry/exit timing with mathematical confirmation
Wick Pressure Analysis
Rejection level prediction using candle mathematics:
- Upper Wicks: Selling pressure zones (purple/red lines)
- Lower Wicks: Buying pressure zones (purple/green lines)
- Glow Intensity (1-8): Visual emphasis and line reach
- Application: Confluence with fractal grid creates high-probability zones
Regime Intensity Heatmap
Background coloring showing market energy:
- Black/Dark: Low activity, range-bound markets
- Purple Glow: Building momentum and trend development
- Bright Purple: High activity, strong directional moves
- Calculation: Combines trend, momentum, volatility, and score intensity
Six Professional Themes
- Quantum: Purple/violet for general trading and mathematical focus
- Holographic: Cyan/magenta optimized for cryptocurrency markets
- Crystalline: Blue/turquoise for conservative, stability-focused trading
- Plasma: Gold/magenta for high-energy volatility trading
- Cosmic Neon: Bright neon colors for maximum visibility and aggressive trading
📊 INSTITUTIONAL-GRADE DASHBOARD
Unified AI Score Section
- Total Score (-10 to +10): Primary decision metric
- >5: Strong bullish signals
- <-5: Strong bearish signals
- Quality ratings: EXCEPTIONAL > STRONG > MODERATE > WEAK
- Component Analysis: Individual L-Function, Galois, Operadic, and Correspondence contributions
Order Flow Analysis
Revolutionary OFPI integration:
- OFPI Value (-100% to +100%): Real buying vs selling pressure
- Visual Gauge: Horizontal bar chart showing flow intensity
- Momentum Status: SHIFTING, ACCELERATING, STRONG, MODERATE, or WEAK
- Trading Application: Flow shifts often precede major moves
Signal Performance Tracking
- Win Rate Monitoring: Real-time success percentage with emoji indicators
- Signal Count: Total signals generated for frequency analysis
- Current Position: LONG, SHORT, or NONE with P&L tracking
- Volatility Regime: HIGH, MEDIUM, or LOW classification
Market Structure Analysis
- Möbius Field Strength: Mathematical field oscillation intensity
- CHAOTIC: High complexity, use wider stops
- STRONG: Active field, normal position sizing
- MODERATE: Balanced conditions
- WEAK: Low activity, consider smaller positions
- HTF Trend: Higher timeframe bias (BULL/BEAR/NEUTRAL)
- Strategy Agreement: Multi-algorithm consensus level
Position Management
When in trades, displays:
- Entry Price: Original signal price
- Current P&L: Real-time percentage with risk level assessment
- Duration: Bars in trade for timing analysis
- Risk Level: HIGH/MEDIUM/LOW based on current exposure
🚀 SIGNAL GENERATION LOGIC
Balanced Long/Short Architecture
The indicator generates signals through multiple convergent pathways:
Long Entry Conditions:
- Score threshold breach with algorithmic agreement
- Strong bullish order flow (OFPI > 0.15) with positive composite signal
- Bullish pattern recognition with mathematical confirmation
- HTF trend alignment with momentum shifting
- Extreme bullish OFPI (>0.3) with any positive score
Short Entry Conditions:
- Score threshold breach with bearish agreement
- Strong bearish order flow (OFPI < -0.15) with negative composite signal
- Bearish pattern recognition with mathematical confirmation
- HTF trend alignment with momentum shifting
- Extreme bearish OFPI (<-0.3) with any negative score
Exit Logic:
- Score deterioration below continuation threshold
- Signal quality degradation
- Opposing order flow acceleration
- 10-bar minimum between signals prevents overtrading
⚙️ OPTIMIZATION GUIDELINES
Asset-Specific Settings
Cryptocurrency Trading:
- Modular Level: 15-25 (capture volatility)
- L-Function Precision: 0.8-1.3 (reactive to price swings)
- OFPI Length: 10-20 (fast correlation shifts)
- Cascade Levels: 5-7, Theme: Holographic
Stock Index Trading:
- Modular Level: 25-35 (balanced trending)
- L-Function Precision: 1.5-1.8 (stable patterns)
- OFPI Length: 14-20 (standard correlation)
- Cascade Levels: 4-5, Theme: Quantum
Forex Trading:
- Modular Level: 35-45 (smooth trends)
- L-Function Precision: 1.6-2.1 (high smoothing)
- OFPI Length: 18-25 (disable volume amplification)
- Cascade Levels: 3-4, Theme: Crystalline
Timeframe Optimization
Scalping (1-5 minute charts):
- Reduce all lookback parameters by 30-40%
- Increase L-Function precision for noise reduction
- Enable all visual elements for maximum information
- Use Small dashboard to save screen space
Day Trading (15 minute - 1 hour):
- Use default parameters as starting point
- Adjust based on market volatility
- Normal dashboard provides optimal information density
- Focus on OFPI momentum shifts for entries
Swing Trading (4 hour - Daily):
- Increase lookback parameters by 30-50%
- Higher L-Function precision for stability
- Large dashboard for comprehensive analysis
- Emphasize HTF trend alignment
🏆 ADVANCED TRADING STRATEGIES
The Mathematical Confluence Method
1. Wait for Fractal Grid level approach
2. Confirm with projected L-Score > threshold
3. Verify OFPI alignment with direction
4. Enter on portal signal with quality ≥ STRONG
5. Exit on score deterioration or opposing flow
The Regime Trading System
1. Monitor Aether Flow background intensity
2. Trade aggressively during bright purple periods
3. Reduce position size during dark periods
4. Use Möbius Field strength for stop placement
5. Align with HTF trend for maximum probability
The OFPI Momentum Strategy
1. Watch for momentum shifting detection
2. Confirm with accelerating flow in direction
3. Enter on immediate portal signal
4. Scale out at Fibonacci levels
5. Exit on flow deceleration or reversal
⚠️ RISK MANAGEMENT INTEGRATION
Mathematical Position Sizing
- Use Galois Rank for volatility-adjusted sizing
- Möbius Field strength determines stop width
- Fractal Dimension guides maximum exposure
- OFPI momentum affects entry timing
Signal Quality Filtering
- Trade only STRONG or EXCEPTIONAL quality signals
- Increase position size with higher agreement levels
- Reduce risk during CHAOTIC Möbius field periods
- Respect HTF trend alignment for directional bias
🔬 DEVELOPMENT JOURNEY
Creating the LOMV was an extraordinary mathematical undertaking that pushed the boundaries of what's possible in technical analysis. This indicator almost didn't happen. The theoretical complexity nearly proved insurmountable.
The Mathematical Challenge
Implementing the Langlands Program required deep research into:
- Number theory and the Möbius function
- Riemann zeta function convergence properties
- L-function analytical continuation
- Galois representations in finite fields
The mathematical literature spans decades of pure mathematics research, requiring translation from abstract theory to practical market application.
The Computational Complexity
Operadic composition theory demanded:
- Category theory implementation in Pine Script
- Multi-dimensional array management for strategy composition
- Real-time democratic voting algorithms
- Performance optimization for complex calculations
The Integration Breakthrough
Bringing together three disparate mathematical frameworks required:
- Novel approaches to signal weighting and combination
- Revolutionary Order Flow Polarity Index development
- Advanced T3 smoothing implementation
- Balanced signal generation preventing directional bias
Months of intensive research culminated in breakthrough moments when the mathematics finally aligned with market reality. The result is an indicator that reveals market structure invisible to conventional analysis while maintaining practical trading utility.
🎯 PRACTICAL IMPLEMENTATION
Getting Started
1. Apply indicator with default settings
2. Select appropriate theme for your markets
3. Observe dashboard metrics during different market conditions
4. Practice signal identification without trading
5. Gradually adjust parameters based on observations
Signal Confirmation Process
- Never trade on score alone - verify quality rating
- Confirm OFPI alignment with intended direction
- Check fractal grid level proximity for timing
- Ensure Möbius field strength supports position size
- Validate against HTF trend for bias confirmation
Performance Monitoring
- Track win rate in dashboard for strategy assessment
- Monitor component contributions for optimization
- Adjust threshold based on desired signal frequency
- Document performance across different market regimes
🌟 UNIQUE INNOVATIONS
1. First Integration of Langlands Program mathematics with practical trading
2. Revolutionary OFPI with T3 smoothing and momentum detection
3. Operadic Composition using category theory for signal democracy
4. Dynamic Fractal Grid with projected L-Score calculations
5. Multi-Dimensional Visualization through morphism flow portals
6. Regime-Adaptive Background showing market energy intensity
7. Balanced Signal Generation preventing directional bias
8. Professional Dashboard with institutional-grade metrics
📚 EDUCATIONAL VALUE
The LOMV serves as both a practical trading tool and an educational gateway to advanced mathematics. Traders gain exposure to:
- Pure mathematics applications in markets
- Category theory and operadic composition
- Number theory through Möbius function implementation
- Harmonic analysis via L-function calculations
- Advanced signal processing through T3 smoothing
⚖️ RESPONSIBLE USAGE
This indicator represents advanced mathematical research applied to market analysis. While the underlying mathematics are rigorously implemented, markets remain inherently unpredictable.
Key Principles:
- Use as part of comprehensive trading strategy
- Implement proper risk management at all times
- Backtest thoroughly before live implementation
- Understand that past performance does not guarantee future results
- Never risk more than you can afford to lose
The mathematics reveal deep market structure, but successful trading requires discipline, patience, and sound risk management beyond any indicator.
🔮 CONCLUSION
The Langlands-Operadic Möbius Vortex represents a quantum leap forward in technical analysis, bringing PhD-level pure mathematics to practical trading while maintaining visual elegance and usability.
From the harmonic analysis of the Langlands Program to the democratic composition of operadic theory, from the number-theoretic precision of the Möbius function to the revolutionary Order Flow Polarity Index, every component works in mathematical harmony to reveal the hidden order within market chaos.
This is more than an indicator - it's a mathematical lens that transforms how you see and understand market structure.
Trade with mathematical precision. Trade with the LOMV.
*"Mathematics is the language with which God has written the universe." - Galileo Galilei*
*In markets, as in nature, profound mathematical beauty underlies apparent chaos. The LOMV reveals this hidden order.*
— Dskyz, Trade with insight. Trade with anticipation.

AQPRO ScalperX📝 INTRODUCTION
AQPRO ScalperX is a trading indicator designed for fast-paced, intraday trading. It uses Donchian channel breakouts, combined with a proprietary filtering system, to catch buy and sell opportunities as close to the beginning as possible without losing quality of the signals.
On top of core signals, ScalperX includes a real-time max profit tracker, a multi-timeframe (MTF) dashboard, support and resistance zones, and risk management visualization tools like automatic rendering of TP and SL lines. The indicator is fully customizable for both its visuals and functional settings.
🎯 PURPOSE OF USAGE
This indicator was initially designed with the idea of trying to make such a tool, that would be able to catch trend reversal in the most safe way. In this particular situation term 'safe way' is very abstract and it is up to interpretation, but we decided that our definition will be 'trading with price breakouts' , meaning that we would like to capitalize on price breaking its previous structure in the direction opposite to the previous one.
You can clearly see on the chart how buy and sell signals are going one after another on the screenshot below:
This ensures that we follow trend consistently and without missing out on potential profits. Just like they say: " let the winners run ".
Even though indicator with similar goals already exist in the open market, we believe that our proprietary algorithms and filters for determining price breakouts can make a big difference to traders, which employ similar strategies on daily basis, by helping them understand where are the potential high-quality breakouts might be. We haven't found indicator with exact same functionality as ours, which means that traders will be able to leverage an actually new tool to generate new price insights.
In short, main goals of this indicator are as follows:
Catching high-quality price breakouts, filtered to reduce the amount of choppy moves and false signals;
Tracking potential profits in real-time, directly on trader's chart;
Organizing data visualization of data pf latest signals from chosen asset from multiple timeframe in one dashboard;
Automated highlighting of key support and resistance zones on the chart, which serve as confirmation for main signals;
⚙️ SETTINGS OVERVIEW
Options for customization of this indicator are straightforward, but let's review them to make things certainly clear:
🔑 ScalperX / Main Settings
Range — defines the "wideness" of the breakout boxes. Higher values create wider breakout zones and impact breakout sensitivity;
Filter — adjusts the spacing between breakout boxes, determining the strictness of signal filtering. Higher values lead to more selective and rarer signals;
Show Max Profit — displays a real-time line and label that updates when a trade achieves a new peak profit, measured in ticks.
⏰ MTF Signal / Main Settings
Show MTF Signals — enables the generation of buy/sell signals from selected higher timeframes, displayed as labels on the current chart;
Timeframe — specifies the higher timeframe to use for MTF signal detection, such as 1 hour (1h) or 4 hours (4h).
🗂️ MTF Dashboard / Main Settings
Show MTF Dashboard — activates a dashboard that tracks entries, TP, SL, and overall trade bias for one selected symbol across four customizable timeframes;
* Dashboard position ( Vertical ) — adjusts whether the dashboard appears on the Top, Middle, or Bottom of the chart;
* Dashboard position ( Horizontal ) — aligns the dashboard Left, Center, or Right within the chart window;
* the name of the parameter is hidden in the settings
🗂️ MTF Dashboard / Ticker
Ticker to Track — Allows you to choose the specific ticker symbol (e.g., BINANCE:BTCUSDT) for MTF tracking.
🗂️ MTF Dashboard / Timeframes
* Timeframe 1 — set the first timeframe for multi-timeframe analysis (e.g., 15 minutes);
* Timeframe 2 — set the second timeframe for multi-timeframe analysis (e.g., 30 minutes);
* Timeframe 3 — set the third timeframe for multi-timeframe analysis (e.g., 1 hour);
* Timeframe 4 — set the fourth timeframe for multi-timeframe analysis (e.g., 4 hours).
* the name of the parameter is hidden in the settings
🛡️ Risk Management / Main Settings
Show TP&SL — displays dynamic lines and labels for the entry, Take Profit (TP), and Stop Loss (SL) of the most recent signal, updated in real-time until a new signal triggers;
Risk-to-Reward Ratio (R:R) — defines the ratio for TP and SL calculation to control your risk and reward on every trade.
📐 Support & Resistance / Main Settings
Show Support & Resistance Zones — enables dynamic zones based on pivot points, colored bullish or bearish based on price context;
History Lookback — defines the number of bars to consider when calculating support and resistance levels. Increasing this results in zones derived from longer-term price structures.
🎨 Visual Settings / ScalperX
Bullish Box — defines the color for bullish breakout boxes;
Bearish Box — defines the color for bearish breakout boxes;
Max Profit — sets the color for the max profit line on the chart.
🎨 Visual Settings / S&R
Support — defines color used for standard support zones;
Resistance — defines color used for standard resistance zones;
Strong Support — defines special color for zones classified as "strong support";
Strong Resistance — defines special color for zones classified as "strong resistance".
🎨 Visual Settings / MTF Dashboard
Bullish — sets the color for bullish trade states in the MTF dashboard;
Bearish — sets the color for bearish trade states in the MTF dashboard.
🔔 Alerts / Main Settings
Buy & Sell — toggles alerts for buy and sell signals detected by the indicator in the current chart timeframe;
MTF Buy & Sell — toggles alerts for buy and sell signals detected across the selected MTF timeframes.
📈 APPLICATION GUIDE
Application flow of this indicator very easy to understand and get used to, because all of the necessary elements — analysis, drawing, alert — are already automated by our algorithms. Let's review how the indicator works.
Let's start with the most basic thing — how will your indicator look when you load it on your chart for the first time:
AQPRO ScalperX consists mainly of 6 logic blocks:
ScalperX signals;
Risk visualization;
Max Profit tracking;
MTF scalper signals;
MTF dashboard;
Support & Resistance zones.
Description of each logic block is provided in the corresponding sections below.
SCALPERX SIGNALS
Signals, generated by our indicator, are shown on the chart as coloured up/down triangle. When a signal appears on the chart, indicator also create a box of length equal to 'Range' parameter from "Main Settings" group of settings. This box is intended to show which area of the price was broken by current candle.
It also important to acknowledge, the breakout itself happens only when price closes beyond broken price area with its close (!) price . Breakouts with highs or lows are not counted. This reduces the amount of low-quality signals and ensures that only the strong breakout will appear on the chart.
VERY IMPORTANT NOTE: all signals are considered valid only on the close of the candle, which triggered the signal, so if you want to enter a trade by any signal, wait for its candle to close and open your trade right on the next candle.
Talking about scalper's settings, we need to shed a light on how the changes in them affect signal's quality.
Parameter 'Range' defines the amount of bars, that will be review prior to current candle to determine wether the price area of this bars is good enough to track and if current candle actually broke this price area.
👍 Rule of thumb : the higher the 'Range' is, the "wider" the boxes. Also the with the increase of this parameter rises the lag of the signals, so be carefully with setting high values to this parameter.
See the visual showcase of signals with different 'Range' parameters on the screenshot below:
The example above features two instancies of ScalperX with two different 'Range' parameter values: 15 (leftchart) and 5 (right chart). You can clearly see, that on left chart here are 2 signals in comparison to 6 signals on right chart. Also signals on the left side have bigger lag and they don't catch the start of the move in comparison to how quickly tops and bottoms are catched with low 'Range' . However, low 'Range' will lead to excessive amount of signals, quality of which during 'whipsaw' markets is not that great.
✉️ Our advice on how to optimally set 'Range' parameter:
Use low values to trade during the times, when there are a lot of clean up and down impulses. This way you will catch reversal opportunities sooner and the quality of the signals will still be great;
Use high values on the 'whipsaw' markets. This will filter out many bad signals, that you would get with low-value 'Range' , and will drastically reduces amount of losing trades.
Talking about the 'Filter' parameter, this particular setting defines the 'strictness' of rules which will be applied to price area validation process. Essentially, the higher this parameter is, the stronger price impulse has to be confirm the breakout. However, changes in this parameter will not impact the "wideness" of boxes at all.
👍 Rule of thumb : the higher the 'Filter' is, the more separated the signal will be. Setting this parameter to high value will lead to increase in lag and big reduction in amount of signals, so be careful this parameter to high values.
See the visual showcase of signals with different 'Filter' parameters on the screenshot below:
The example above features two instancies of ScalperX with two different 'Filter' parameter values: 20 (left chart) and 2.5 (right chart). You can clear see, that low 'Filter' generated 6 signals, while higher one generated only 4 signals. However if you look closer, you will see that 2 signals, that existing in the yellow dashed area on the right chart, don't exist in the same area on the left chart. This is because high value of this parameter requires price impulse to be very strong in order for the indicator to mark this breakout as a valid one. What is more important is that these 2 'missing' signals were actually bad and, technically, we actually cut our losses in this case with high value of 'Filter' . You can see that the leftmost sell signal on the left chart eventually closed in a nice profit, in comparison to the same trade being closed in a loss on the right chart because of the 2 signals that we were talking about above.
It is important to note, that setting 'Filter' to low values will not affect performance this much as it low value of 'Range' do, because the indicator already works on low values of this parameter by default and the signals on average are already good enough for trading.
✉️ Our advice on how to optimally set 'Filter' parameter:
Use low values to trade on the markets with clean up and down impulses. This way you avoid excessive filtering and leave a room for good signals to come right at you;
Use high values to trade on 'whipsaw' markets. Higher values of this parameter on these markets have same effect as high 'Range' parameter: filtering false signals and leaving room for actually strong price impulses, which you will later capitalize on.
RISK VISUALIZATION (TP&SL)
Rendering Take-Profits and Stop-Losses in our indicator works quite simple: for each new trade indicator creates new pairs of lines and labels for TP and SL, while lines & labels from previous trade are erased for aesthetics purposes. Each label shows price coordinates, so that each trader would be able to grap the numbers in seconds.
See the visual showcase of TP & SL visualization on the screenshot below:
Also, whenever TP or SL of the current trade is reached, drawing of both TP and SL stops. When the TP is reached, additional '✅' emoji on the TP price is shown as confirmation of Take-Profit.
However, while TP or SL has not been reached, TP&SL labels and lines will be prolonged until one of them will be reached or new signals will come.
See the visual showcase of TP & SL stopping being visualized & TP on the screenshot below:
MAX PROFIT TRACKING
This mechanic is not particularly a new one in field of trading, but people usually forgot that it can be a useful indicator of state of the market:
when lines and labels of Max Profit are far from entry points on consistent basis , it usually means that indicator's signals actually can catch a beginning of good price moves, which enables trader to capitalize on them;
when lines and labels of Max Profit are close to entry points on consistent basis , it means that either market is choppy or the indicator can't catch trading opportunities in time. To 'fix' this you can try to reconfigure scalper's parameters, which were described above.
Principles of Max Profit in this indicator are of industry-standard: when price updates its extremum and 'generates' more profit than it previously did, Max Profit label and line change their position to this extremum. Max Profit label displays the maximum potential amount of profit that a trader could have got during this trade in pips (!) .
See the visual showcase of Max Profit work on the screenshot below:
MTF SCALPER SIGNALS
The principles of these signals are exactly the same as principles for classic Scalper signals. Refer to 'Scalper Signals' section above to rehearse the knowledge.
Logic behind these signals is very simple:
We take classic Scalper signals;
We request the data about these latest signals from specific other timeframe ( user can choose it in the settings );
If such signals appeared, we display it on the chart as a big label with timeframe value inside of it. In comparison to classic signals, no additional boxes are created . TP&SL functionality doesn't cover MTF signals, so don't expect to see TP&SL lines and labels for MTF signals.
See the visual showcase of MTF Scalper signals on the screenshot below:
MTF DASHBOARD
The functionality of the dashboard is pretty simple, but it makes the dashboard itself a very powerful tool in a hands of experienced trader.
Let's review structure of MTF dashboard on the screenshot below:
The important feature of MTF dashboard is that its tracks latest trade's data from a particular ticker and its four timeframes, all of which any trader chooses in the settings. This means, that you can be on asset ABC , but track the data from asset XYZ . This allows for a quick scan of sentiment from different assets and their timeframes, which gives traders a clue on what is the trend on these assets both on lower and higher timeframes at the same moment and saves a lot of time from jumping from one asset & timeframe to another.
To see that this is exactly the case with our indicator, see the screenshot below:
Needless to say, that you can track current asset in the dashboard as well. This will have the same benefits, described in the paragraph above.
You can also customize colours for bullish and bearish patterns for MTF Dashboard in the settings.
SUPPORT & RESISTANCE ZONES
Support & resistance (S&R) zones are a great tool for confirming Scalper signals in complex situations. Using these zones to determine whether or a particular entry opportunity is good is a practice of professional traders, which we specifically added to our indicator for the reason of improving the quality of Scalper signals in long run.
The mechanics behind these zones is based on pivot points, the lookback for which you can customize in the parameter called 'History Lookback (Bars)' in "Support & Resistance / Main Settings" group of settings. Increasing this parameter will lead to a appearance of more 'global' zones, but they will appear much rarer, rather then zones, generated with low values of this parameter.
The quality of these zones doesn't change much when changing this parameter — it only changes the frequency of the zones on the chart. Zones, generated from high values of this parameter are more suitable for long-term trading, while zones, generated from low value of this parameter, are more suitable for short-term trading.
It also important to mention that any zone on the chart is considered active only until the moment its farther border ( top border for resistance zones and bottom border for support zones) is reached by price's high or low .
Take a look on the screenshot below to see which zones does the indicator draw:
Let's review the zones themselves now:
Classic Support/Resistance Zone — a standard zone, which on average has amedium success rate to reverse the price when collided with it;
High-buyer-volume/High-seller-volume Support/Resistance Zone — a stronger zone, which on average has much better success rate to reverse the price when collided with it. Classic zone is marked as high-volume only if the up/down volume near the pivot point of this zone is greater than a certain threshold ( not changeable );
Extreme Support/Resistance Zone — a zone, which appeared beyond price's least-possible-to-cross levels, and has to the highest success rate of reversing the price on encounter across the zones, mentioned previously. Classic zone, which appeared beyond certain price levels, calculated with our proprietary risk system, is considered extreme. Classic zone doesn't need to be high-volume to become an Extreme Zone!
High-buyer-volume/High-seller-volume Extreme Support/Resistance Zone — an Extreme Zone, which has also passed up/down volume evolution process, mentioned in the point 2 .
Trading with the zones, mentioned above, with highest-on-paper success rate — especially Extreme Zones — does NOT guarantee you a price reversal when the price will reach this zone. However, by conducting our own extensive research with this indicator, we have found that using these zone will actually help you increase your success rate on average, because using these zones as confirmation systems filter out quite a number of false signals on average.
It is also important to mention, that opacity (same as 'transparency') of S&R zones depends on the volume of around zone's pivot point:
if volume is high , zone has 'brighter' (less opacity) colour;
if volume is low , zone has 'darker' (more opacity) colour.
Let's review examples of Scalper signal, which 1) where filtered out by our S&R zones and 2) where confirmed by our S&R zones. See the screenshot below:
The example above clearly shows the importance of having an S&R zone confirming the signal. This kind of 'team work' between of Scalper signals and S&R zones results in filtering lots of bad signals and confirmation of truly strong ones.
🔔 ALERTS
This indicator employs alerts for an event when new signal occurs on the current timeframe or on MTF timeframe. While creating the alert below 'Condition' field choose 'any alert() function call'.
When this alert is triggered, it will generate this kind of message:
// Alerts for current timeframe
string msg_template = "EXCHANGE:ASSET, TIMEFRAME: BUY_OR_SELL"
string msg_example = "BINANCE:BTCUSDT, 15m: Buy"
// Alerts for MTF timeframe
string msg_template_mtf = "MTF / EXCHANGE:ASSET, TIMEFRAME: BUY_OR_SELL"
string msg_example_mtf = "MTF / BINANCE:BTCUSDT, 1h: Buy"
📌 NOTES
This indicators works best on assets with high liquidity; most suitable timeframes range from 1m to 4h (depends on your trading style) ;
Seriously consider using S&R zones as confirmation to main Scalper signals or any of your own signals. Confirmation process may filter out a lot of signals, but your PNL History will say "thank you" to you in the long-run and you will see yourself how good confirmed signals actually do work;
Don't forget to look at MTF dashboard from time to time to see global sentiment. This will help you time your entry moments better and will improve your performance in the long run;
This indicator can serve both as primary source of signals and as confirmation tool, but we advise to try to combine it with your own strategy frst to see if it will improve your performance.
🏁 AFTERWORD
AQPRO ScalperX was designed to help traders identify high-quality price breakouts and generate market insights based on them, which include signal generation. Main feature of this indicator is Scalper algorithm, which generate price-breakout-based signals directly on your chart.
Alongside these signals you can leverage 1) MTF Dashboard to track latest trade's data from chosen asset and its four timeframes, 2) risk visualization functionality (TP&SL) to improve understanding of current market risks and 3) Support & Resistance zones, which serve as a great confirmation tool for Scalper signals, but can also work with any other signal generation tool to enhance its performance.
ℹ️ If you have questions about this or any other our indicator, please leave it in the comments.
