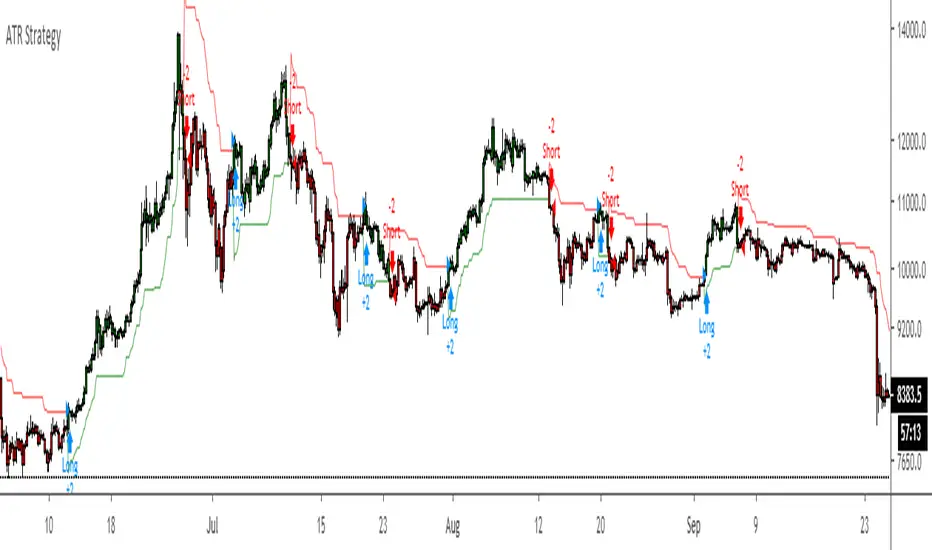
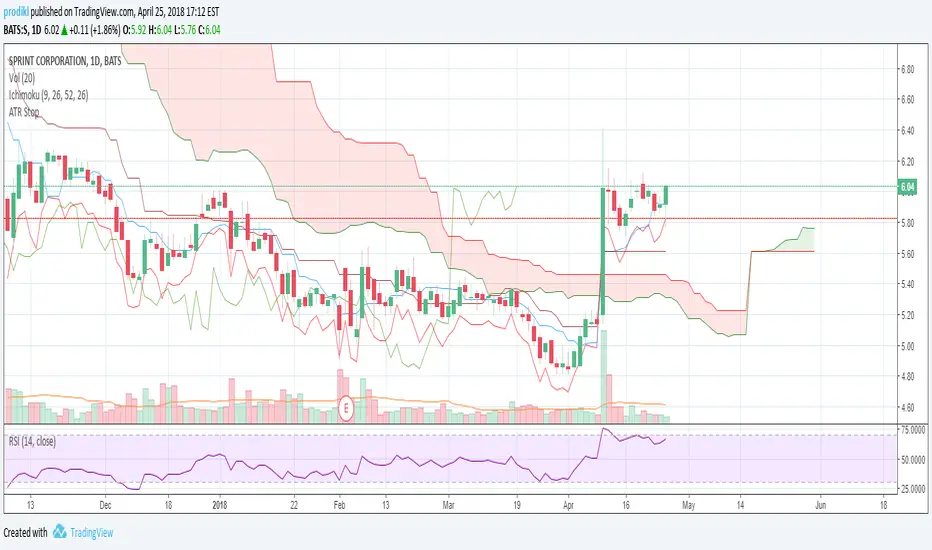
ATR Strategy Back test Original script by HPotter
ATR strategy is profitable.
Buy when it says buy and sell when it says sell.
Tìm kiếm tập lệnh với "atr"
ATR, Kijun-Sen, %R Strategy [No Nonsense FX]A strategy that employs the No Nonsense FX method as described by VP.
1. Risk: ATR
2. Baseline: Kijun-Sen
3. Confirmation #1: Williams % Range
4. Volume: TBD
5. Confirmation #2: TBD
6. Exit: TBD
Give me a follow if you enjoy and please PM me for more info/collabs!
Notes:
The defaults seem to work on all pairs
Please check the "two digit" box if running on JPY or Metals
If you have any ideas for a volume indicator, confirmation, and/or exit leave a comment!

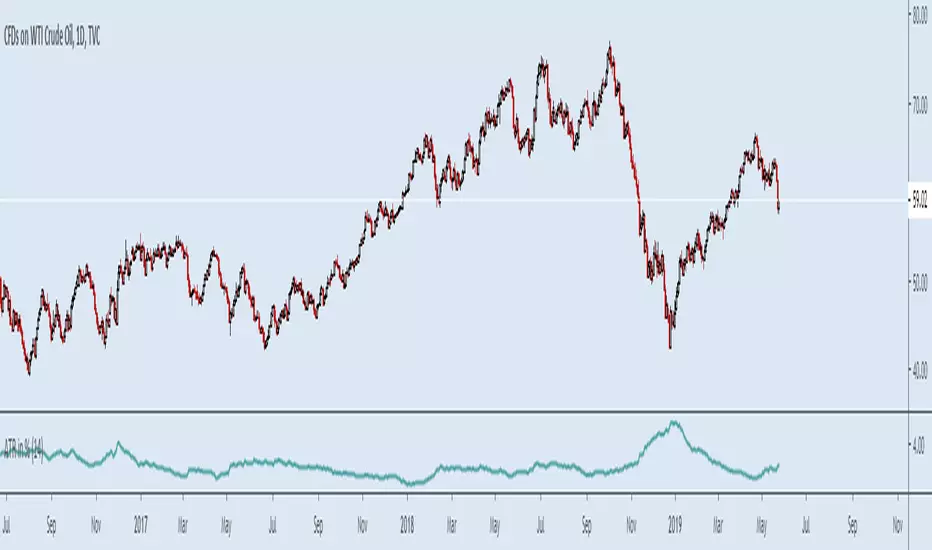
ATR in %Muh indicator :)
Simple but so useful little script. I work in percents because this is what makes sense not "pips" and "ticks" my account grows or diminishes a certain percentage I risk "1%" for example not ticks, ticks is what bad dogs have.
Was tired of calculating manually every time.
Makes it easier to set stop losses, get an idea of what to expect, risk in a kind of worse case scneario, backtest strategies, compare charts etc quickly. More quick now.
Example.
Bitcoin and NatGas, you do NOT need leverage...
optionsellers.com that somehow got surprised by Natgas volatility and squeezed, I think he did not bother doing this...
Happens all the time on NatGas, that "short seller catastrophy" that made the headlines was not even that big of a spike...
Plenty of way worse ones not long ago
ATR Z ScoreThis script normalizes ATR to a Z Score, or a number of standard deviations it is from its long term average, positive or negative.

ATR * 1.5 FX Stop LossPlots two lines to help with back testing strategies assuming a Stop less set at ATR*1.5

ATR TrueThis is True Average True Range, ((Hi-Low)/Lenght), Lenght (1,2 and more), no EMA, SMA etc.
Only based on Hi/Low Lenght.
Why Is all ATR bulish there is not correctly?

ATR Ranging market backgroundJust publishing a separate indicator from my ATR & RSI indicator if ever you liked to analyze and use them separate. Have a nice day

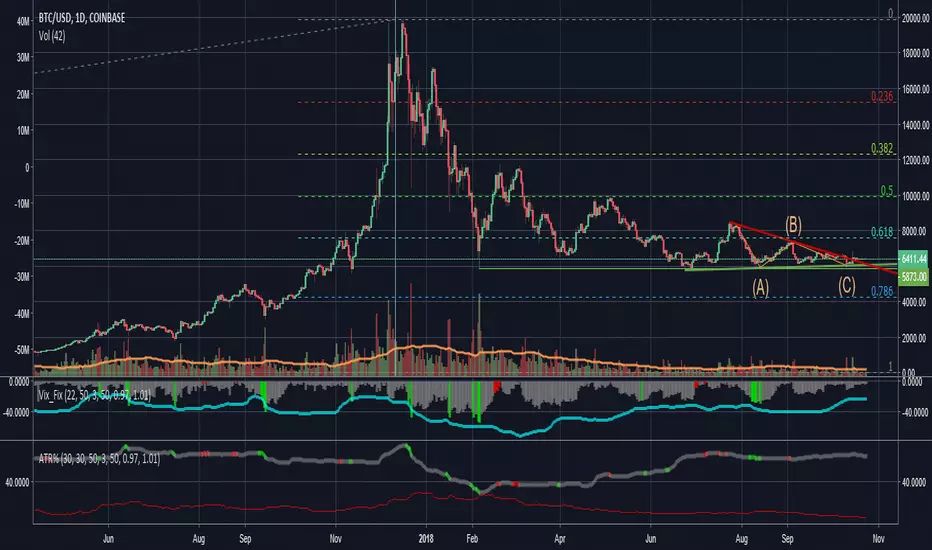
ATR and VIX For Profit Target and RSI LimitThe red line, based on ATR, should be used as a percentage gain goal. So I will set my profit targets based on this percentage.
The grey line is based on William's VIX and I use it to judge what RSI I should sell at.
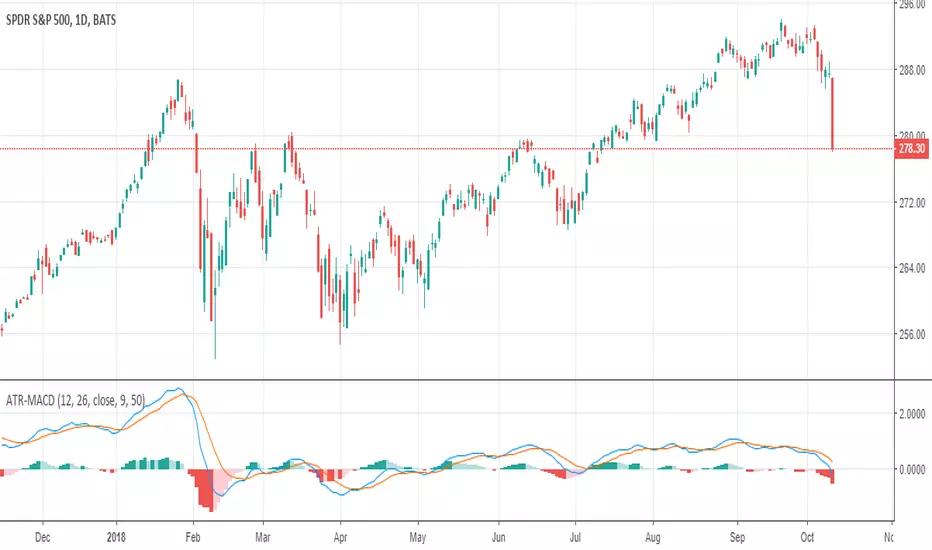
ATR adjusted MACDWhen running MACD, it can be useful to compare the value of the MA difference to other values. In other words, is a particular stock or futures contract at a more extreme MACD value than another. This can be done by dividing by the price, however, that doesn't adjust for volatility differences. Using ATR, one can adjust for price and volatility at the same time, allowing comparisons between securities more easily.
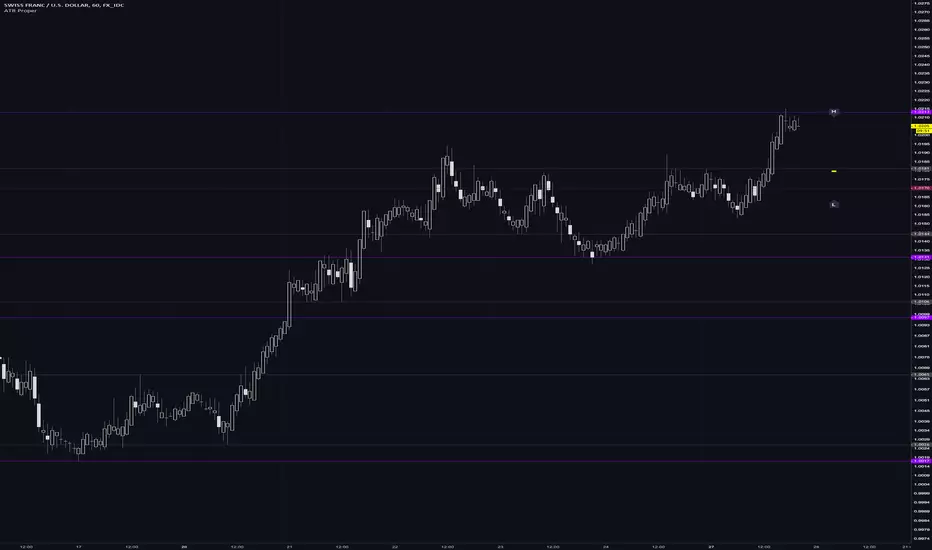
ATR Trailing Stop Bands Strategy [R] Originally based on a script by HPotter for an ATR Trailing Stop, which itself was based on an article by Sylvain Vervoort, but I adapted it to add Bands, to add extra optional Wick Protection, and have now made it a Strategy. It's not great for entries/exits, but as a Trailing Stop that can let winners ride, it's great.

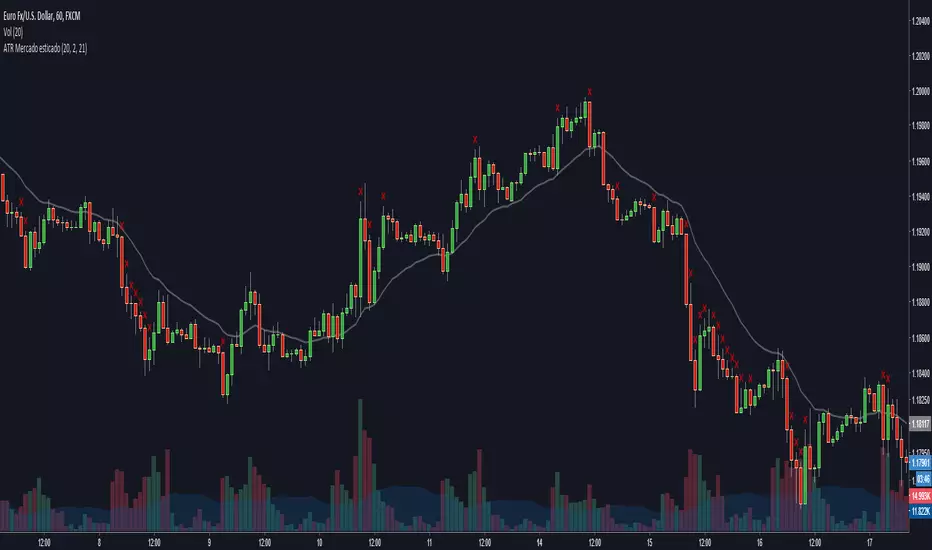
ATR Stretched Market [zauoyds]This indicator verify the close in comparison with EMA21. If the number is higher than 2ATR, the X is ploted above the candle.
Avoid positions when the candle is marked.
The best entries always will be close to the averages.
You can change the values through the inputs, according with your trade system.
ATR Stop LossAdds an indicator that can be used to set stop losses.
This is the close price minus the ATR + 10%.
The 10% is there to let the market perform and avoid whipsaws.

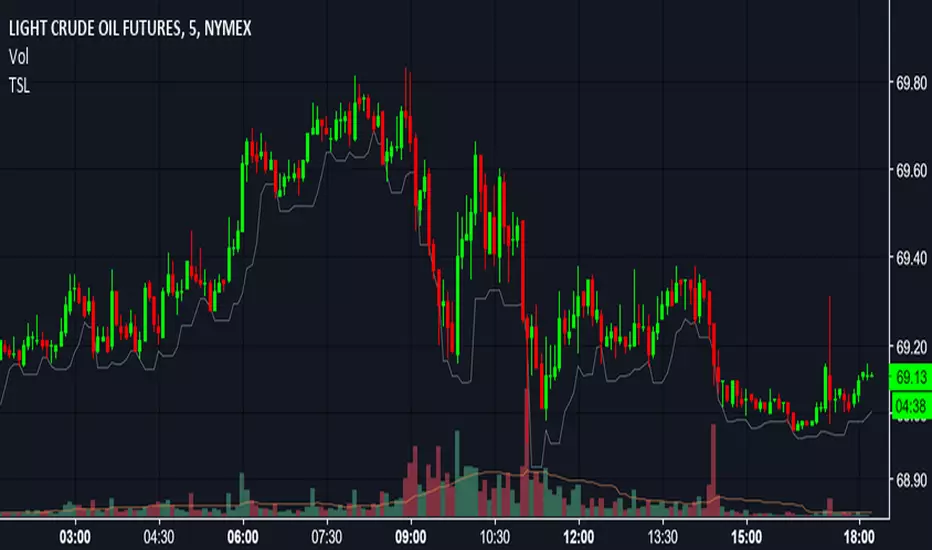
ATR on ChartPlots the ATR on the chart for easy visualization, default TF is the Daily but you can alter it.

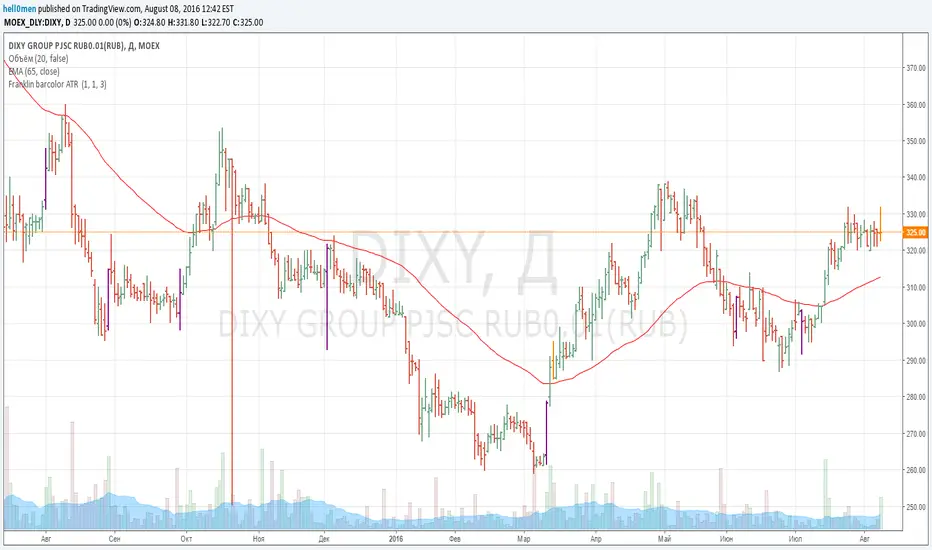
Franklin ATR Bar highlight by els (robotfarm.ru)Script highlights signal bars for tfc3.ru school trading strategy. Working timeframe D.
ATR Pips [LazyBear] [Elixium Mod: FEAR GAUGE]Modified version of ATR Pips
The indicator's value is a third of the daily range which is good to use as a stop loss value for intra day scalping on markets such as index futures and forex.
It's good for detecting and confirming inflection points in the market.

Adaptive ATR Limits█ OVERVIEW
This indicator plots adaptive ATR limits for intraday trading. A key feature of this indicator, which makes it different from other ATR limit indicators, is that the top and bottom ATR limit lines are always exactly one ATR apart from each other (in "auto" mode; there is also a "basic" mode, which plots the limits in the more traditional way—i.e., one ATR above the low and one ATR below the high at all times—and this can be used for comparison).
█ FEATURES
Provides an algorithm to plot the most reasonable intraday ATR top/bottom limits based on currently available information
Dynamically adapts limits as the price evolves during the day
Works correctly and consistently on both RTH and ETH charts
Has a user-selected ADR mode to base the limits on ADR instead of ATR
Option to include the current pre-market and previous day's post-market range in the calculation
Configurable ATR/ADR averaging length
Provides a visual smoothing option
Provides an information box showing the current numerical ATR/ADR values
Reasonable defaults that work well if the user changes nothing
Well-documented, high-quality, open-source code for those interested
█ HOW TO USE
At a minimum, there is nothing that needs to be set. The defaults work well. The ATR top line (red, configurable) gives you the most reasonable move given the currently available information. The line will move away from the price as the price approaches it; that is normal—it is reacting to new information. This happens until the ATR bottom limit hits the lower of the daily low and the previous day's close (in ATR mode). The ATR bottom line (green, configurable) works the same way, with reversed logic.
There is an option to use ADR instead of ATR. The ATR includes the previous day's RTH close in the range, whereas ADR does not. Another option allows the user to add the current day's pre-market range or the previous day's post-market into the current day's range, which has an effect if either of those went outside of today's RTH range, plus yesterday's RTH close (in the default ATR mode). Pre-market and post-market range is not typically included in the daily true range, so only change it if you really know you want it.
█ CONCEPTS
Most traditional ATR limit indicators plot the top ATR limit one ATR above the current daily low, and the bottom ATR limit one ATR below the current daily high. This indicator can also do that (in "basic" mode), but its value lies in its default "auto" mode, which uses an algorithm to dynamically adapt the ATR limits throughout the day, keeping them one ATR apart at all times. It tries to plot the most sensible ATR limits based on the current daily ATR, in order to provide a reasonable visual intraday target, given the available information at that point in time.
"Auto" mode is actually a weighted average of two methods: midpoint and relative (both of which can also be explicitly selected). The midpoint method places the midpoint of the ATR limit equal to the midpoint of the currently established daily range. The relative method measures the currently established daily range and calculates the position of the current price within it (as a ratio between 0 and 1). It then uses that value as a weight in a weighted average of extreme locations for the ATR limits, which are: the ATR top anchored to one ATR above the daily low, and the ATR bottom anchored to one ATR below the daily high.
The relative method is more advanced and better for most of the day; however, it can cause wild swings in the early market or pre-market before a reasonable range (as a percentage of ATR) has been established. "Auto" mode therefore takes another weighted average between the two methods, with the weight determined by the percentage of the ATR currently established within the day, more strongly weighting the calmer midpoint method before a good range is established. Once the full ATR has been achieved, the algorithm in "auto" mode will have fully switched to the relative method and will remain with that method for the rest of the day.
To explain the effect further, as an example, imagine that the price is approaching the full ATR range on the high side. At this point, the indicator will have almost fully transitioned to the second (relative) method. The lower ATR limit will now be anchored to the daily low as the price hits the upper ATR limit. If the price goes beyond the upper ATR, the lower ATR limit will stay anchored to the daily low, and the upper limit will stay anchored to one ATR above the lower limit. This allows you to see how far the price is going beyond the upper ATR limit. If the price then returns and backs off the upper ATR limit, the lower ATR limit will un-anchor from the daily low (it will actually rise, since the daily ATR range has been exceeded, so the lower ATR limit needs to come up because the actual daily range can’t fit into the ATR range anymore). The overall effect is to give you the best visual indication of where the price is in relation to a possible upper ATR-based target. Reverse this example for when the price low approaches the ATR range on the low side.
Care was taken so that the code uses no hard-coded time zones, exchanges, or session times. For this reason, it can in principle work globally. However, it very much depends on the information provided by the exchange, which is reflected in built-in Pine Script variables (see Limitations below).
█ LIMITATIONS
The indicator was developed for US/European equities and is tested on them only. It is also known to work on US futures; in this case, the whole 23-hour session is used, and the "Sessions to include in range" setting has no effect. It may or may not work as intended on security types and equities/futures for other countries.

Average True Range Trailing Mean [Alifer]Upgrade of the Average True Range default indicator by TradingView. It adds and plots a trailing mean to show periods of increased volatility more clearly.
ATR TRAILING MEAN
A trailing mean, also known as a moving average, is a statistical calculation used to smooth out data over time and identify trends or patterns in a time series.
In our indicator, it clearly shows when the ATR value spikes outside of it's average range, making it easier to identify periods of increased volatility.
Here's how the ATR Trailing Mean (atr_mean) is calculated:
atr_mean = ta.cum(atr) / (bar_index + 1) * atr_mult
The ta.cum() function calculates the cumulative sum of the ATR over all bars up to the current bar.
(bar_index + 1) represents the number of bars processed up to the current bar, including the current one.
By dividing the cumulative ATR ta.cum(atr) by (bar_index + 1) and then multiplying it by atr_mult (Multiplier), we obtain the ATR Trailing Mean value.
If atr_mult is set to 1.0, the ATR Trailing Mean will be equal to the simple average of the ATR values, and it will follow the ATR's general trend.
However, if atr_mult is increased, the ATR Trailing Mean will react more strongly to the ATR's recent changes, making it more sensitive to short-term fluctuations.
On the other hand, reducing atr_mult will make the ATR Trailing Mean less responsive to recent changes in ATR, making it smoother and less prone to reacting to short-term volatility.
In summary, adjusting the atr_mult input allows traders to fine-tune the ATR Trailing Mean's responsiveness based on their preferred level of sensitivity to recent changes in market volatility.
IMPLEMENTATION IN A STRATEGY
You can easily implement this indicator in an existing strategy, to only enter positions when the ATR is above the ATR Trailing Mean (with Multiplier-adjusted sensitivity). To do so, add the following lines of codes.
Under Inputs:
length = input.int(title="Length", defval=20, minval=1)
atr_mult = input.float(defval=1.0, step = 0.1, title = "Multiplier", tooltip = "Adjust the sensitivity of the ATR Trailing Mean line.")
smoothing = input.string(title="Smoothing", defval="RMA", options= )
ma_function(source, length) =>
switch smoothing
"RMA" => ta.rma(source, length)
"SMA" => ta.sma(source, length)
"EMA" => ta.ema(source, length)
=> ta.wma(source, length)
This will allow you to define the Length of the ATR (lookback length over which the ATR is calculated), the Multiplier to adjust the Trailing Mean's sensitivity and the type of Smoothing to be used for the ATR.
Under Calculations:
atr= ma_function(ta.tr(true), length)
atr_mean = ta.cum(atr) / (bar_index+1) * atr_mult
This will calculate the ATR based on Length and Smoothing, and the resulting ATR Trailing Mean.
Under Entry Conditions, add the following to your existing conditions:
and atr > atr_mean
This will make it so that entries are only triggered when the ATR is above the ATR Trailing Mean (adjusted by the Multiplier value you defined earlier).
ATR - DEFINITION AND HISTORY
The Average True Range (ATR) is a technical indicator used to measure market volatility, regardless of the direction of the price. It was developed by J. Welles Wilder and introduced in his book "New Concepts in Technical Trading Systems" in 1978. ATR provides valuable insights into the degree of price movement or volatility experienced by a financial asset, such as a stock, currency pair, commodity, or cryptocurrency, over a specific period.
ATR - CALCULATION AND USAGE
The ATR calculation involves three components:
1 — True Range (TR): The True Range is a measure of the asset's price movement for a given period. It takes into account the following factors:
The difference between the high and low prices of the current period.
The absolute value of the difference between the high price of the current period and the closing price of the previous period.
The absolute value of the difference between the low price of the current period and the closing price of the previous period.
Mathematically, the True Range (TR) for the current period is calculated as follows:
TR = max(high - low, abs(high - previous_close), abs(low - previous_close))
2 — ATR Calculation: The ATR is calculated as a Moving Average (MA) of the True Range over a specified period.
The ATR is calculated as follows:
ATR = MA(TR, length)
3 — ATR Interpretation: The ATR value represents the average volatility of the asset over the chosen period. Higher ATR values indicate higher volatility, while lower ATR values suggest lower volatility.
Traders and investors can use ATR in various ways:
Setting Stop Loss and Take Profit Levels: ATR can help determine appropriate stop-loss and take-profit levels in trading strategies. A larger ATR value might require wider stop-loss levels to allow for the asset's natural price fluctuations, while a smaller ATR value might allow for tighter stop-loss levels.
Identifying Market Volatility: A sharp increase in ATR might indicate heightened market uncertainty or the potential for significant price movements. Conversely, a decreasing ATR might suggest a period of low volatility and possible consolidation.
Comparing Volatility Between Assets: Since ATR uses absolute values, it shouldn't be used to compare volatility between different assets, as assets with higher prices will consistently have higher ATR values, while assets with lower prices will consistently have lower ATR values. However, the addition of a trailing mean makes such a comparison possible. An asset whose ATR is consistently close to its ATR Trailing Mean will have a lower volatility than an asset whose ATR continuously moves far above and below its ATR Trailing Mean. This can help traders and investors decide which markets to trade based on their risk tolerance and trading strategies.
Determining Position Size: ATR can be used to adjust position sizes, taking into account the asset's volatility. Smaller position sizes might be appropriate for more volatile assets to manage risk effectively.

50% Fib Trend Cloud + ATR BandsThis indicator plots two structural 50% fibonacci midpoints from recent confirmed 'left/right' swings that form a *cloud* of equilibrium, then adds a rolling 50% fibonacci range midpoint based on a lookback window that's wrapped in ATR bands. Importantly, it solves a specific trading problem:
Structural midpoints (macro context) are powerful but can lag when price escapes prior ranges. Enter rolling 50% fib + ATR ➡️ which restores real-time balance & tolerance (micro context). Together they show where price is balanced structurally, where it’s balanced right now, and how much volatility to tolerate before acting.
➖➖➖
🔑 Why this is different
Most tools either draw a single midpoint (ex., daily 50%) or ATR bands around a moving average. This script fuses dual swing-based 50% midpoints (structure) + a rolling 50% with ATR (flow), so you don’t lose context when price escapes prior ranges. The cloud tells you who’s in control (fast vs. slow structure). The rolling 50% + ATR tells you how far is “too far” now.
➖➖➖
🧠 What it does (at a glance)
🔸Structural Equilibrium × 2 (Fib1/Fib2)
Two independent 50% midpoints formed from swing pivots (configurable Left/Right bars + optional smoothing). Their gap is the Midpoint Cloud = structural “fair value” zone.
🔸Rolling 50% + ATR Bands
A rolling highest/lowest window computes an always-current 50% rolling midpoint plot; ±ATR × length envelopes define a soft value area and over-stretch boundaries.
🔸Actionable Visuals
Optional fill between Fib1/Fib2, labels, and candle-overlay modes to instantly read regime (above both / below both / between).
🔸Smart Defaults
Timeframe-aware presets for L/R pivots & smoothing; full manual overrides available.
➖➖➖
⚙️ Calculations (plain-English)
🔸Pivot midpoints (Fib1 & Fib2):
1) Detect a swing using `Left/Right` bars
2) Take the swing’s high/low → compute 50%
3) (Optional) Smooth the line (SMA) to stabilize on noisy TFs
4) Repeat with a different sensitivity to get two distinct midpoints
🔸Rolling midpoint:
Highest High / Lowest Low over the last *N* bars → (HH + LL) / 2
🔸ATR levels:
`Upper = Rolling50 + ATR × Mult`, `Lower = Rolling50 − ATR × Mult`
(Typical: ATR length 14–21; Multipliers 2.236 for L1, 5.382 for L2)
➖➖➖
🤖 Auto-Configured Presets (with Manual Override)
💡Goal: make the midpoints “just work” on common timeframes while still letting you dial them in.
💡How Auto Presets work
When Auto Presets = ON, the script picks sensible L/R/S (Left bars / Right bars / Smoothing) for Fib Trend 1 and Fib Trend 2 based on chart timeframe.
🔸Fib 1 (fast) emphasizes *micro-structure* for quicker bias shifts.
🔸Fib 2 (slow) emphasizes *macro-structure* for anchor/bias context.
These defaults keep Fib 1 responsive without jitter and Fib 2 stable without lag.
➡️ Turn Auto Presets = OFF to take full control with the manual inputs described below.
➖➖➖
🛠 Manual Fib Midpoint Settings (when Auto = OFF)
💡Each midpoint uses three knobs:
🔸Pivot Left (L): bars to the left that must be lower/higher to qualify a swing
🔸Pivot Right (R): bars to the right that must be lower/higher to confirm the swing
🔸Smoothing (S): SMA period applied to the raw 50% midpoint (stabilizes noise)
5-Minute optimized defaults
🔸Fib Trend 1: `L21 / R5 / S55` → responsive local structure (entries/exits, re-balancing zones)
🔸Fib Trend 2: `L55 / R13 / S89` → broader structure (trend context, anchors/stops)
Timeframe guidance
🔸1m–3m: may feel a touch laggy → consider ~`L13 / R3 / S34`
🔸15m–1h: defaults remain strong → optionally ~`L34 / R8 / S89`
🔸4h+ : increase span for stability → `L89–144 / R13–21 / S144–233`
➡️ Rule of thumb: shorter L/R = faster detection, longer S = smoother line. Tune until Fib 1 captures the “active swing” and Fib 2 captures the “dominant swing” without whipsaw.
➖➖➖
🎛 Inputs (quick reference)
🔸Fib Trend 1/2: Source (High/Low/Close), Left/Right bars, Smoothing length, Show/Hide, Cloud fill toggle
🔸Rolling 50%: Lookback length, Price basis (Wicks/Close/HLC3/OHLC4), Plot scope (Full / Last N / None)
🔸ATR Bands: ATR length, Multipliers (L1/L2), Plot scope, Line width/colors
🔸Overlay & Labels: Candle overlay mode, Label padding/size, 50% centerline toggle, Plot widths
➖➖➖
🖍️ Candle Coloring & Overlay Modes
💡Purpose: make trend instantly visible on the candles and ATR levels.
1) Color Logic (dropdown)
🔸 Fib Midpoints — Colors by position of price vs. Fib 1 & Fib 2
🔸ATR Zones — Colors by which ATR zone price is in relative to the Rolling 50%
➡️ Price Reference: Choose the input used for the decision (Close, HL2, OHLC3, OHLC4).
➡️Tip: Close is crisp; HL2/OHLC variants are smoother.
2) Overlay Style (dropdown)
🔸 None — No visual change to candles
🔸 Bar Color — Uses `barcolor()` to tint built-in candles (this takes into account your Trading View settings, for instance if you have wicks set to white, they will show up as white with this setting)
🔸 PlotCandles — Draws unified custom candles (body, wick, border) with the same color for maximum clarity
💡Practical use
🔸 Pick Fib Midpoints to read structural bias at a glance (above/below/between the cloud).
🔸 Pick ATR Zones to read value vs. stretch around the Rolling 50% (mean-reversion vs. trend extension).
➖➖➖
📘 How to use
A) Trend confirmation
- Strong bullish bias when price holds above both structural mids; strong bearish when below both.
- Use the Rolling 50% + ATR as a dynamic re-entry zone: pullbacks that respect ATR(L1) often continue the prevailing trend.
B) Transition / mean reversion
- Inside the Cloud (between Fib1 & Fib2) treat behavior as neutralization/re-balancing; range tactics tend to outperform momentum plays.
- In ranges, fades near ±ATR around the rolling 50% can mark short-term edges.
C) Breakout context
- When price leaves the Cloud, the Rolling 50% keeps you anchored so price never feels “floating.” A clean hold outside ATR(L1/L2) suggests regime strength; quick re-entries hint at traps.
➖➖➖
🖼 Chart examples
➡️ Each snapshot shows how the Cloud (structure) and the Rolling 50% + ATR (flow) work together.
1) 1-Minute Downtrend – Cloud as Dynamic Ceiling
- The Cloud slopes down; pullbacks repeatedly fail under the Cloud’s underside.
- Rolling 50% (dashed mid) + ATR(L1) act as a reversion band: rallies stall near upper ATR and rotate lower.
2) 15-Minute Persistent Drift – Structure Guides, Flow Times Entries
- Long drift lower with Cloud overhead.
- Consolidations near the rolling mid resolve in the trend direction; ATR bands frame risk on each attempt.
3) 15-Minute Uptrend (BTC) – From Cloud Escape to Value Stair-Step
- After escaping the prior Cloud, rolling 50% + ATR establish a new higher value area.
- Pullbacks into ATR(L1) produce orderly stair-steps; Cloud remains supportive on deeper dips
4) 5-Minute BTC – Pullback to Value then Rotate
- Strong leg up; retrace tags lower ATR band and rotates back toward the rolling mid.
- Labels (Fib1/Fib2) make the structural context explicit for decision-making.
➖➖➖
🧪 Starter presets
- Intraday (5–15m): Fib1 ~ L21/R5 (smooth 5), Fib2 ~ L55/R13 (smooth 9) • Rolling = 55 • ATR = 14 • L1 = 2.5x, L2 = 5.0x
- Scalping: Shorten lookbacks & smoothing; keep ATR multipliers similar, or tighten L1.
- Swing: Lengthen all lookbacks; consider ATR length 21–28.
➖➖➖
🏁Final Word
This script is not just a visual tool, it’s a complete trend and structure framework. Whether you're looking for clean trend alignment, dynamic support/resistance, or early warning signs of a reversal, this system is tuned to help you react with confidence — not hindsight.
Rembember, no single indicator should be used in isolation. For best results, combine it with price action analysis, higher-timeframe context, and complementary tools like trendlines, moving averages etc Use it as part of a well-rounded trading approach to confirm setups — not to define them alone.
---
💡Turn logic into clarity. Structure into trades. And uncertainty into confidence.

Combined ATR + VolumeOverview
The Combined ATR + Volume indicator (C-ATR+Vol) is designed to measure both price volatility and market participation by merging the Average True Range (ATR) and trading volume into a single normalized value. This provides traders with a more comprehensive tool than ATR alone, as it highlights not only how much price is moving, but also whether there is sufficient volume behind those moves.
Originality & Utility
Two Key Components
ATR (Average True Range): Measures price volatility by analyzing the range (high–low) over a specified period. A higher ATR often indicates larger price swings.
Volume: Reflects how actively traders are participating in the market. High volume typically indicates strong buying or selling interest.
Normalized Combination
Both ATR and volume are independently normalized to a 0–100 range.
The final output (C-ATR+Vol) is the average of these two normalized values. This makes it easy to see when both volatility and market participation are relatively high.
Practical Use
Above 80: Signifies elevated volatility and strong volume. Markets may experience significant moves.
Around 50–80: Indicates moderate activity. Price swings and volume are neither extreme nor minimal.
Below 50: Suggests relatively low volatility and lower participation. The market may be ranging or consolidating.
This combined approach can help filter out situations where volatility is high but volume is absent—or vice versa—providing a more reliable context for potential breakouts or trend continuations.
Indicator Logic
ATR Calculation
Uses Pine Script’s built-in ta.tr(true) function to measure true range, then smooths it with a user-selected method (RMA, SMA, EMA, or WMA).
Key Input: ATR Length (default 14).
Volume Calculation
Smooths the built-in volume variable using the same selectable smoothing methods.
Key Input: Volume Length (default 14).
Normalization
For each metric (ATR and Volume), the script finds the lowest and highest values over the lookback period and converts them into a 0–100 scale:
normalized value
=(current value−min)(max−min)×100
normalized value= (max−min)(current value−min) ×100
Combined Score
The final plot is the average of Normalized ATR and Normalized Volume. This single value simplifies the process of identifying high-volatility, high-volume conditions.
How to Use
Setup
Add the indicator to your chart.
Adjust ATR Length, Volume Length, and Smoothing to match your preferred time horizon or chart style.
Interpretation
High Values (above 80): The market is experiencing significant price movement with high participation. Potential for strong trends or breakouts.
Moderate Range (50–80): Conditions are active but not extreme. Trend setups may be forming.
Low Values (below 50): Indicates quieter markets with reduced liquidity. Expect ranging or less decisive moves.
Strategy Integration
Use C-ATR+Vol alongside other trend or momentum indicators (e.g., Moving Averages, RSI, MACD) to confirm potential entries/exits.
Combine it with support/resistance or price action analysis for a broader market view.
Important Notes
This script is open-source and intended as a community contribution.
No Future Guarantee: Past market behavior does not guarantee future results. Always use proper risk management and validate signals with additional tools.
The indicator’s performance may vary depending on timeframes, asset classes, and market conditions.
Adjust inputs as needed to suit different instruments or personal trading styles.
By adhering to TradingView’s publishing rules, this script is provided with sufficient detail on what it does, how it’s unique, and how traders can use it. Feel free to customize the settings and experiment with other technical indicators to develop a trading methodology that fits your objectives.
🔹 Combined ATR + Volume (C-ATR+Vol) 지표 설명
이 인디케이터는 ATR(Average True Range)와 거래량(Volume)을 결합하여 시장의 변동성과 유동성을 동시에 측정하는 지표입니다.
ATR은 가격 변동성의 크기를 나타내며, 거래량은 시장 참여자의 활동 수준을 반영합니다. 보통 높은 ATR은 가격 변동이 크다는 의미이고, 높은 거래량은 시장에서 적극적인 거래가 이루어지고 있음을 나타냅니다.
이 두 지표를 각각 0~100 범위로 정규화한 후, 평균을 구하여 "Combined ATR + Volume (C-ATR+Vol)" 값을 계산합니다.
이를 통해 단순한 가격 변동성뿐만 아니라 거래량까지 고려하여, 더욱 신뢰성 있는 변동성 판단을 할 수 있도록 도와줍니다.
📌 핵심 개념
1️⃣ ATR (Average True Range)란?
시장의 변동성을 측정하는 지표로, 일정 기간 동안의 고점-저점 변동폭을 기반으로 계산됩니다.
ATR이 높을수록 가격 변동이 크며, 낮을수록 횡보장이 지속될 가능성이 큽니다.
하지만 ATR은 방향성을 제공하지 않으며, 단순히 변동성의 크기만을 나타냅니다.
2️⃣ 거래량 (Volume)의 역할
거래량은 시장 참여자의 관심과 유동성을 반영하는 중요한 요소입니다.
높은 거래량은 강한 매수 또는 매도세가 존재함을 의미하며, 낮은 거래량은 시장 참여가 적거나 관심이 줄어들었음을 나타냅니다.
3️⃣ ATR + 거래량의 결합 (C-ATR+Vol)
단순한 ATR 값만으로는 변동성이 커도 거래량이 부족할 수 있으며, 반대로 거래량이 많아도 변동성이 낮을 수 있습니다.
이를 해결하기 위해 ATR과 거래량을 각각 0~100으로 정규화하여 균형 잡힌 변동성 지표를 만들었습니다.
두 지표의 평균값을 계산하여, 가격 변동과 거래량이 동시에 높은지를 측정할 수 있도록 설계되었습니다.
📊 사용법 및 해석
80 이상 → 강한 변동성 구간
가격 변동성이 크고 거래량도 높은 상태
강한 추세가 진행 중이거나 큰 변동이 일어날 가능성이 큼
상승/하락 방향성을 확인한 후 트렌드를 따라가는 전략이 유리
50~80 구간 → 보통 수준의 변동성
가격 움직임이 일정하며, 거래량도 적절한 수준
점진적인 추세 형성이 이루어질 가능성이 있음
시장이 점진적으로 상승 혹은 하락할 가능성이 크므로, 보조지표를 활용하여 매매 타이밍을 결정하는 것이 중요
50 이하 → 낮은 변동성 및 유동성 부족
가격 변동이 적고, 거래량도 낮은 상태
시장이 횡보하거나 조정 기간에 들어갈 가능성이 큼
박스권 매매(지지/저항 활용) 또는 돌파 전략을 고려할 수 있음
💡 활용 방법 및 전략
✅ 1. 트렌드 판단 보조지표로 활용
단독으로 사용하는 것보다는 RSI, MACD, 이동평균선(MA) 등의 지표와 함께 활용하는 것이 효과적입니다.
예를 들어, MACD가 상승 신호를 주고, C-ATR+Vol 값이 80을 초과하면 강한 상승 추세로 해석할 수 있습니다.
✅ 2. 변동성 돌파 전략에 활용
C-ATR+Vol이 80 이상인 구간에서 가격이 특정 저항선을 돌파한다면, 강한 추세의 시작을 의미할 수 있습니다.
반대로, C-ATR+Vol이 50 이하에서 가격이 저항선에 가까워지면 돌파 가능성이 낮아질 수 있습니다.
✅ 3. 시장 참여도와 변동성 확인
단순히 ATR만 높아서는 신뢰하기 어려운 경우가 많습니다. 예를 들어, 급등 후 거래량이 급감하면 상승 지속 가능성이 낮아질 수도 있습니다.
하지만 C-ATR+Vol을 사용하면 거래량이 함께 증가하는지를 확인하여 보다 신뢰할 수 있는 분석이 가능합니다.
🚀 결론
🔹 Combined ATR + Volume (C-ATR+Vol) 인디케이터는 단순한 ATR이 아니라 거래량까지 고려하여 변동성을 측정하는 강력한 도구입니다.
🔹 시장이 큰 움직임을 보일 가능성이 높은 구간을 찾는 데 유용하며, 80 이상일 경우 강한 변동성이 있음을 나타냅니다.
🔹 단독으로 사용하기보다는 보조지표와 함께 활용하여, 트렌드 분석 및 돌파 전략 등에 효과적으로 적용할 수 있습니다.
📌 주의사항
변동성이 크다고 해서 반드시 가격이 급등/급락한다는 보장은 없습니다.
특정한 매매 전략 없이 단순히 이 지표만 보고 매수/매도를 결정하는 것은 위험할 수 있습니다.
시장 상황에 따라 변동성의 의미가 다르게 작용할 수 있으므로, 반드시 다른 보조지표와 함께 활용하는 것이 중요합니다.
🔥 이 지표를 활용하여 시장의 변동성과 거래량을 보다 효과적으로 분석해보세요! 🚀
