EMA Volatility Channel [QuantAlgo]EMA Volatility Channel 🌊📈
The EMA Volatility Channel by QuantAlgo is an advanced technical indicator designed to capture price volatility and trend dynamics through adaptive channels based on exponential moving averages. This sophisticated system combines EMA-based trend analysis with dynamic volatility-adjusted bands to help traders and investors identify trend direction, potential reversals, and market volatility conditions. By evaluating both price momentum and volatility together, this tool enables users to make informed trading decisions while adapting to changing market conditions.
💫 Dynamic Channel Architecture
The EMA Volatility Channel provides a unique framework for assessing market trends through a blend of exponential moving averages and volatility-based channel calculations. Unlike traditional channel indicators that use fixed-width bands, this system incorporates dynamic volatility measurements to adjust channel width automatically, helping users determine whether price movements are significant relative to current market conditions. By combining smooth EMA trends with adaptive volatility bands, it evaluates both directional movement and market volatility, while the smoothing parameters ensure stable yet responsive channel adjustments. This adaptive approach allows users to identify trending conditions while remaining aware of volatility expansions and contractions, enhancing both trend-following and reversal strategies.
📊 Indicator Components & Mechanics
The EMA Volatility Channel is composed of several technical components that create a dynamic channel system:
EMA Midline: Calculates a smoothed exponential moving average that serves as the channel's centerline, providing a clear reference for trend direction.
Volatility Measurement: Computes average price movement to determine dynamic channel width, adapting to changing market conditions automatically.
Smooth Band Calculation: Applies additional smoothing to the channel bands, reducing noise while maintaining responsiveness to significant price movements.
📈 Key Indicators and Features
The EMA Volatility Channel combines various technical tools to deliver a comprehensive analysis of market conditions.
The indicator utilizes exponential moving averages with customizable length and smoothing parameters to adapt to different trading styles. Volatility calculations are applied to determine channel width, providing context-aware boundaries for price movement. The trend detection component evaluates price action relative to the channel bands, helping validate trends and identify potential reversals.
The indicator incorporates multi-layered visualization with color-coded channels and bars to signal both trend direction and market position. These adaptive visual cues, combined with programmable alerts for channel breakouts, help traders and investors track both trend changes and volatility conditions, supporting both trend-following and mean-reversion strategies.
⚡️ Practical Applications and Examples
✅ Add the Indicator: Add the indicator to your TradingView chart by clicking on the star icon to add it to your favorites ⭐️
👀 Monitor Channel Position: Watch the price position relative to the channel bands to identify trend direction and potential reversals. When price moves outside the channel, consider potential trend changes or extreme conditions.
🔔 Set Alerts: Configure alerts for channel breakouts and trend changes, ensuring you can act on significant technical developments promptly.
🌟 Summary and Tips
The EMA Volatility Channel by QuantAlgo is a versatile technical tool, designed to support both trend following and volatility analysis across different market environments. By combining smooth EMA trends with dynamic volatility-based channels, it helps traders and investors identify significant price movements while measuring market volatility, providing reliable technical signals. The tool's adaptability across timeframes makes it suitable for both trend-following and reversal strategies, allowing users to capture opportunities while maintaining awareness of changing market conditions.
Tìm kiếm tập lệnh với "averages"

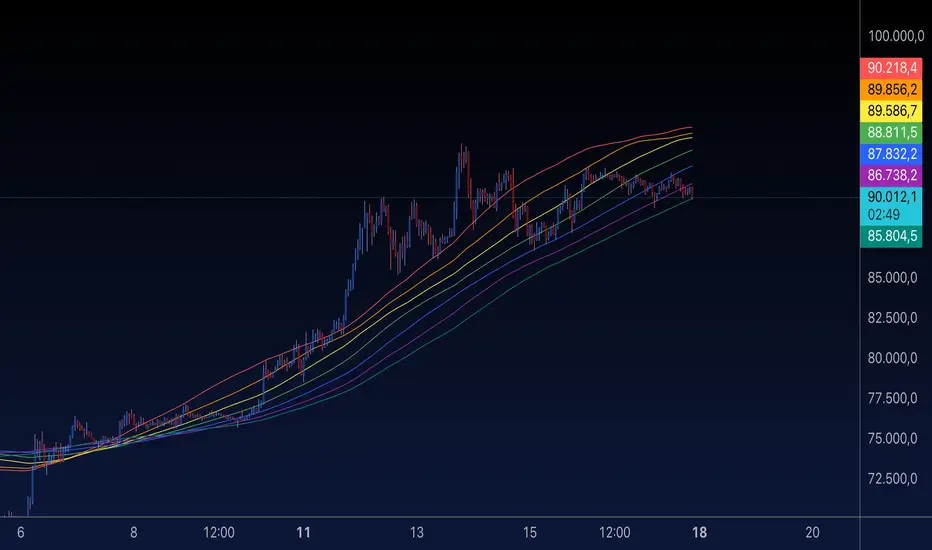
MA Rainbow-AYNETSummary of the "MA Rainbow"
The 200 MA Rainbow script creates a visually appealing representation of multiple moving averages (MAs) with varying lengths and colors to provide insights into price trends and market momentum.
Key Features:
Base Moving Average:
A starting point (ma_length, default 200) is used as the foundation for all other bands.
Rainbow Bands:
The script generates multiple moving averages (bands) with increasing lengths, spaced by a user-defined band_spacing multiplier.
The number of bands is controlled by rainbow_bands, allowing up to 7 bands.
Moving Average Types:
Users can select the MA type: Simple (SMA), Exponential (EMA), or Weighted (WMA).
Dynamic Colors:
Each band is assigned a unique color from a predefined rainbow palette, making the chart visually distinct.
Inputs for Customization:
ma_length: Adjust the base period of the moving average.
rainbow_bands: Set the number of bands to display.
band_spacing: Control the spread between bands.
How It Works:
Precomputing Bands:
Each band’s length is calculated based on the base length (ma_length) and a multiplier (band_spacing).
For example, if ma_length = 200 and band_spacing = 0.2, the lengths of the first 3 bands will be:
Band 1: 200
Band 2: 240
Band 3: 280
Global Plotting:
Each band’s moving average is precomputed using the selected type (SMA, EMA, or WMA).
Bands are plotted globally to avoid scope issues, ensuring compatibility with Pine Script rules.
Color Cycling:
Colors are assigned dynamically from a rainbow palette (red, orange, yellow, green, blue, purple, teal).
Use Case:
The 200 MA Rainbow helps traders:
Visualize market trends with multiple layers of moving averages.
Identify areas of support and resistance.
Gauge momentum through the spread and alignment of bands.
Customization:
Users can:
Change the base moving average length (ma_length).
Adjust the number of bands (rainbow_bands).
Control the spread between bands with band_spacing.
Select the moving average type (SMA, EMA, WMA).
Application:
Copy the script into the Pine Editor in TradingView.
Apply it to your chart to observe the Rainbow MA visualization.
Adjust inputs to match your trading style or strategy.
This script is a versatile tool for both beginner and advanced traders, providing a colorful way to track price trends and market conditions. 🌈
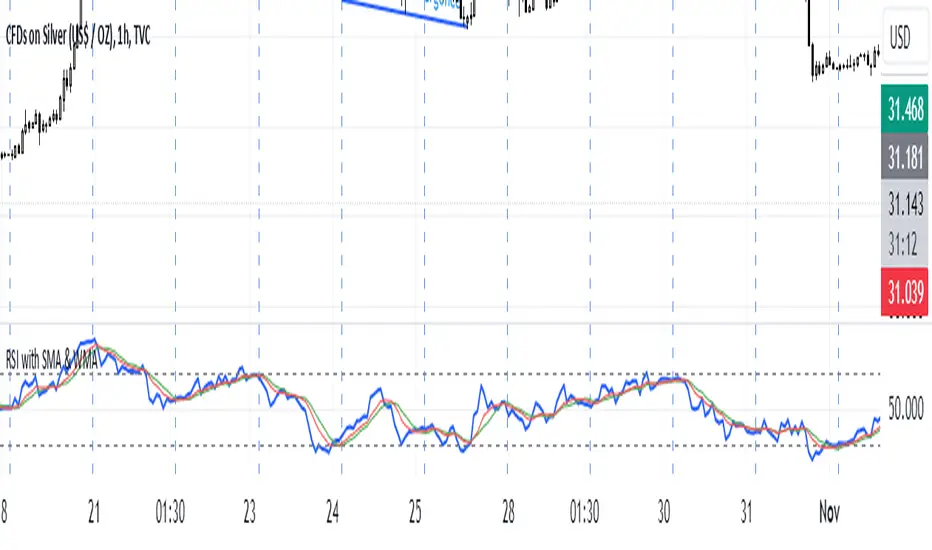
M.Kiriti RSI with SMA & WMAThis script is a custom RSI indicator with added SMA and WMA moving averages to smooth RSI trends and improve analysis of momentum shifts.
1. RSI Calculation: Measures 14-period RSI of the closing price, default threshold levels at 70 (overbought) and 30 (oversold).
2. Moving Averages (SMA and WMA):
- SMA and WMA are applied to RSI for trend smoothing.
- SMA gives equal weight; WMA gives more weight to recent values, making it more responsive.
3.Overbought/Oversold Lines and Labels:
- Horizontal lines and scale labels at 70 (overbought) and 30 (oversold) make these levels easy to reference.
This indicator is useful for identifying potential reversal points and momentum trends when RSI crosses its moving averages.
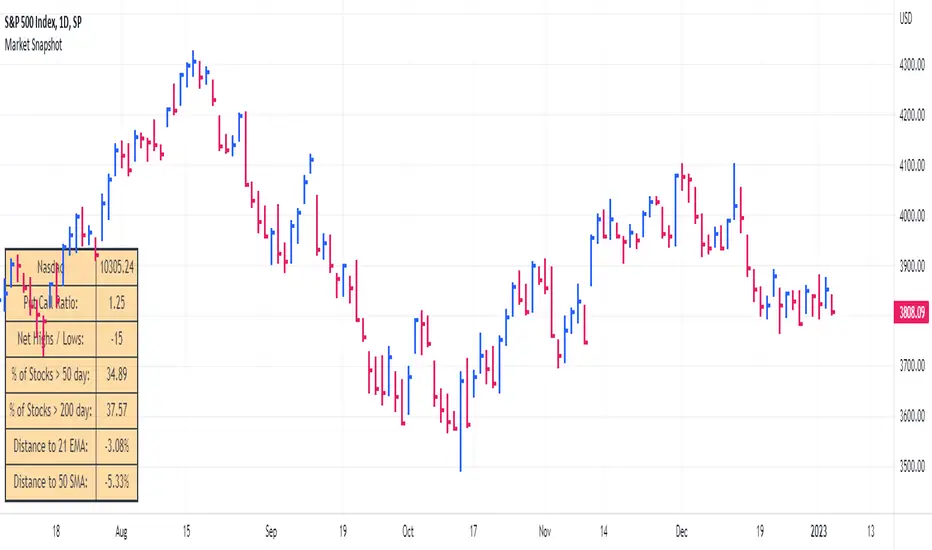
Larry Williams Valuation Index [tradeviZion]Larry Williams Valuation Index
Welcome to the Larry Williams Valuation Index by tradeviZion! This script is an interpretation of Larry Williams' famous WillVal (Valuation) Index, originally developed in 1990 to help traders determine whether a market or asset is overvalued or undervalued. We've extended it to support multiple securities and offer alerts for different valuation levels, helping you make more informed trading decisions.
What is the Valuation Index?
The Valuation Index measures how a security's current price compares to its historical price action. It helps identify whether the security is overvalued (priced too high), undervalued (priced too low), or in a normal range.
This version supports multiple securities and uses valuation parameters to help you assess the relative valuation of three securities simultaneously. It can help you determine the best times to enter (buy) or exit (sell) the market.
Key Features
Multi-Security Analysis: Analyze up to three securities simultaneously to get a broader view of market conditions.
Valuation Levels: Automatically calculate overvaluation and undervaluation levels or set manual levels for consistent analysis.
Custom Alerts: Create custom alerts when securities move between overvalued, undervalued, or normal ranges.
Customizable Table Display: Display a table with valuation values and their status on the chart.
Getting Started
Step 1: Adding the Script to Your Chart
First, add the Larry Williams Valuation Index script to your chart on TradingView. The script is designed to work with any timeframe, but for best results, use weekly or daily timeframes for a longer-term perspective.
Step 2: Configuring Securities
The script allows you to analyze up to three different securities :
Security 1 (Default: DXY)
Security 2 (Default: GC1!)
Security 3 (Default: ZB1!)
You can enable or disable each security individually.
Custom Timeframe Option: You have the option to select a custom timeframe for analysis. This allows you to see whether the security is overvalued or undervalued in lower or higher timeframes. Note that this feature is experimental and has not been extensively tested. Larry Williams originally used the weekly timeframe to determine if a stock was overvalued or undervalued. By default, the indicator compares the current price with the security based on the selected timeframe, except if you choose to use a custom timeframe.
Pro Tip : New users can start with the default securities to understand the concept before using other assets.
Step 3: Valuation Index Settings
Short EMA Length : This is the short-term average used for calculations. A lower value makes it more responsive to recent price changes.
Long EMA Length : This is the long-term average, used to smooth the valuation over time.
Valuation Length (Default: 156) : Represents approximately three years of daily bars (as recommended by Larry Williams).
How is the Valuation Index Calculated?
The valuation calculation is done using a method called WVI (WillVal Index), which compares the current price of a security to the price of another correlated security. Here’s a step-by-step explanation:
1. Data Collection: The script takes the closing price of the security you are analyzing and the closing price of the correlated security.
2. Ratio Calculation : The ratio of the two prices is calculated:
Price Ratio = (Price of your security) / (Price of correlated security) * 100.
This ratio helps determine how expensive or cheap your security is compared to the correlated one.
3. Exponential Moving Averages (EMAs) : The price ratio is used to calculate short-term and long-term EMAs (Exponential Moving Averages). EMAs are used to create smooth lines that represent the average price of a security over a specific period of time, with more weight given to recent data. By calculating both short-term and long-term EMAs, we can identify the trend direction and how the security is performing compared to its historical averages.
4. Valuation Index Calculation:
The Valuation Index is calculated as the difference between the short-term EMA and the long-term EMA. This difference helps to determine if the security is currently overvalued or undervalued:
A positive value indicates that the price is above its longer-term trend, suggesting potential overvaluation.
A negative value indicates that the price is below its longer-term trend, suggesting potential undervaluation.
5. Normalization:
To make the valuation easier to interpret, the calculated valuation index is then normalized using the highest and lowest values over the selected valuation length (e.g., 156 bars).
This normalization process converts the index into a percentage between 0 and 100, where higher values indicate overvaluation and lower values indicate undervaluation.
Step 4: Understanding Valuation Levels
The valuation levels indicate whether a security is currently undervalued, overvalued, or in a normal range.
Manual Levels : You can manually set the overvaluation and undervaluation thresholds (default is 85 for overvalued and 15 for undervalued).
Auto Levels : The script can automatically calculate these levels based on recent price action, allowing you to adapt to changing market conditions.
Auto Levels Calculation Explained:
The Auto Levels are calculated by taking the average of the valuation indices for all three securities (e.g., index1, index2, and index3).
The script then looks at the highest and lowest values of this average over a selected number of recent bars (e.g., 50 bars).
The overvaluation level is determined by taking the highest value and multiplying it by a multiplier (e.g., 5). Similarly, the undervaluation level is calculated using the lowest value and the multiplier.
These dynamic levels adjust according to recent price action, providing an adaptive approach to identifying overvalued and undervalued conditions.
Step 5: How to Use the Script to Make Trading Decisions
For new users, here's a step-by-step trading strategy you can use with the Valuation Index:
1. Identify Undervalued Opportunities
When two or more securities are in the undervalued range (below 15 for manual or below automatically calculated undervalue levels), wait for at least two of these securities to turn from undervalued to normal .
This transition indicates a potential buy opportunity .
2. Buying Signal
When at least two securities transition from undervalued to normal, you can consider buying the asset.
This indicates that the market may be recovering from undervalued conditions and could be moving into a growth phase.
3. Selling Signal
Exit when the price high closes below the EMA 21 (21-day exponential moving average).
Alternatively, if the valuation index reaches overvalued levels (above 85 manually or auto-calculated), wait for it to drop back to normal . This can be another point to exit the trade .
You can also use any other sell condition based on your r isk management strategy .
Alerts for Valuation Levels
The script includes alerts to notify you of changing market conditions:
To activate these alerts, follow these steps, referring to the provided screenshot with detailed steps:
1. Enable Alerts : Click on the settings gear icon on the script title in your chart. In the settings menu, scroll to the section labeled Alerts Settings .
Enable Alerts by checking the Enable Alerts box.
Set the Required Securities for Alert (default is 2 securities).
Choose the Alert Frequency : Selecting Once Per Bar Close will trigger alerts only at the close of each bar, ensuring you receive confirmed signals rather than potentially noisy intermediate signals.
2. Select Alert Type : Choose the type of alert you want to activate, such as Alert on Overvalued, Alert on Undervalued, Alert on Over to Normal , or Alert on Under to Normal .
3. Save Settings : Click OK to save your alert settings.
4. Add Alert on Indicator : Click the "..." (More button) next to the indicator name on the chart and select " Add alert on tradeviZion - WillVal ".
5. Create Alert : In the Create Alert window:
Set Condition to tradeviZion - WillVal .
Ensure Any alert() function call is selected.
Set the Alert Name and select your Expiration preferences.
6. Set Notification Preferences : Go to the Notifications tab and select how you want to receive notifications, such as via app notification, toast notification, email , or sound alert . Adjust these preferences to best suit your needs.
7. Click Create : Finally, click Create to activate the alert.
These alerts will help you stay informed about key market conditions and take action accordingly, ensuring you do not miss critical trading opportunities.
Understanding the Table Display
The script includes an interactive table on the chart to show the valuation status of each security:
Security : The name of the security being analyzed.
Value : The current valuation index value.
Status : Indicates whether the security is overvalued, undervalued , or in a normal range.
Color: Displays a color code for easy identification of status:
Red for overvalued.
Green for undervalued.
Other colors represent normal valuation levels.
Empowering Messages : Motivational messages are displayed to encourage disciplined trading. These messages will change periodically, helping keep a positive trading mindset.
Acknowledgment
This tool builds upon the foundational work of Larry Williams, who developed the WillVal (Valuation) Index concept. It also incorporates enhancements to extend multi-security analysis, valuation normalization, and advanced alerting features, providing a more versatile and powerful indicator. The Larry Williams Valuation Index [ tradeviZion ] helps traders make informed decisions by assessing overvalued and undervalued conditions for multiple securities simultaneously.
Note : Always practice proper risk management and thoroughly test the indicator to ensure it aligns with your trading strategy. Past performance is not indicative of future results.
Trade smarter with TradeVizion—unlock your trading potential today!

FVG Channel [LuxAlgo]The FVG Channel indicator displays a channel constructed from the averages of unmitigated historical fair value gaps (FVG), allowing to identify trends and potential reversals in the market.
Users can control the amount of FVGs to consider for the calculation of the channels, as well as their degree of smoothness through user settings.
🔶 USAGE
The FVG Channel is constructed by averaging together recent unmitigated Bullish FVGs (contributing to the creation of the upper bands), and Bearish unmitigated FVGs (contributing to the creation of the lower bands) within a lookback determined by the user. A higher lookback will return longer-term indications from the indicator.
The channel includes 5 bands, with one upper and one lower outer extremities, as well as an inner series of values determined using the Fibonacci ratios (respectively 0.786, 0.5, 0.236) from the channel's outer extremities.
An uptrend can be identified by price holding above the inner upper band (obtained from the 0.786 ratio), this band can also provide occasional support when the price retraces to it while in an uptrend.
Breaking below the inner upper band with an unwillingness to reach above again is a clear sign of hesitation in the market and can be indicative of an upcoming consolidation or reversal.
This can directly be applied to downtrends as well, below are examples displaying both scenarios.
Uptrend Example:
Downtrend Example:
🔹 Breakout Levels
When the price mitigates all FVGs in a single direction except for 1, the indicator will display a "Breakout Level". This is the level that price will need to cross in order for all FVGs in that direction to be mitigated, because of this they can also be aptly called "Last Stand Levels".
These levels can be considered as potential support and resistance levels, however, should always be monitored for breakouts since a substantial push above or below these points would indicate strong momentum.
🔹 Signals
The indicator includes Bullish and Bearish Signals, these signals fire when all FVGs for a single direction have been mitigated and an engulfing candle occurs in the opposite direction. These are reversal signals and should be used alongside other indicators to appropriately manage risk.
Note: When all FVGs in a single direction have been mitigated, the candles will change colors accordingly.
🔶 DETAILS
The script uses a typical identification method for FVGs. Once identified, the script collects and stores the mitigation levels of the respective bullish and bearish FVGs:
For Bullish FVGs this is the bottom of the FVG.
For Bearish FVGs this is the top of the FVG.
The data is managed to only consider a specific amount of FVG mitigation levels, determined by the set "Unmitigated FVG Lookback". If an FVG is mitigated, it frees up a spot in the memory for a new FVG, however, if the memory is full, the oldest will be deleted.
The averages displayed (Channel Upper and Lower) are created from 2 calculation steps, the first step involves taking the raw average of the FVG mitigation levels, and the second step applies a simple moving average (SMA) smoothing of the precedent obtained averages.
Note: To view the mitigation levels average obtained in the first step, the "Smoothing Length" can be set to 1.
🔶 SETTINGS
Unmitigated FVG Lookback: Sets the maximum number of Unmitigated FVG mitigation levels that the script will use to calculate the channel.
Smoothing Length: Sets the smoothing length for the channel to reduce noise from the raw data.

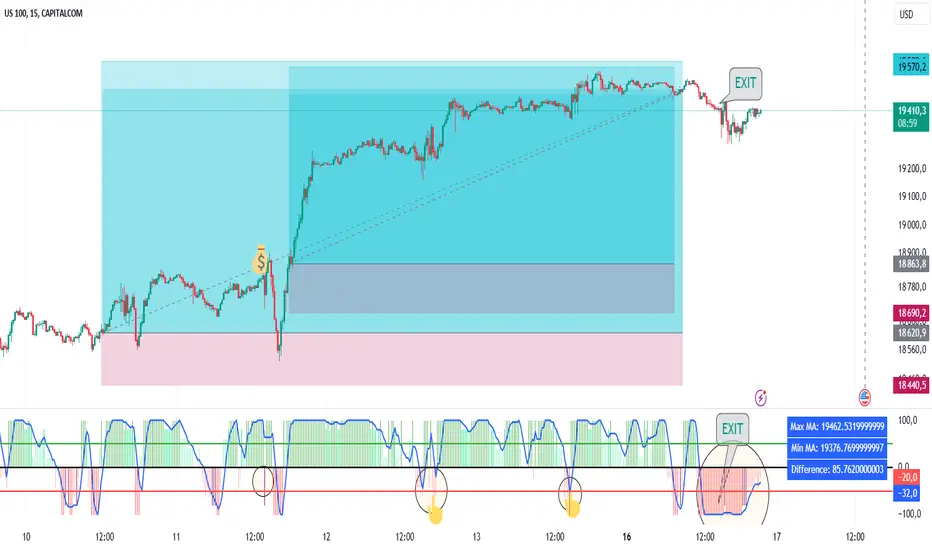
Power MarketPower Market Indicator
Description: The Power Market Indicator is designed to help traders assess market strength and make informed decisions for entering and exiting positions. This innovative indicator provides a comprehensive view of the evolution of Simple Moving Averages (SMA) over different periods and offers a clear measure of market strength through a total score.
Key Features:
Multi-Period SMA Analysis:
Calculates Simple Moving Averages (SMA) for 10 different periods ranging from 10 to 100.
Provides detailed analysis by comparing the current closing price with these SMAs.
Market Strength Measurement:
Assesses market strength by calculating a total score based on the relationship between the closing price and the SMAs.
The total score is displayed as a histogram with distinct colors for positive and negative values.
Smoothed Curve for Better View:
A smoothing of the total score is applied using a 5-period Simple Moving Average to represent the overall trend more smoothly.
Dynamic Information Table:
Real-time display of the maximum and minimum values among the SMAs, as well as the difference between these values, providing valuable insights into the variability of moving averages.
Visual Reference Lines:
Horizontal lines at zero, +50, and -50 for easy evaluation of key score levels.
How to Use the Indicator:
Position Entries: Use high positive scores to identify buying opportunities when market strength is strong.
Position Exits: Negative scores may signal market weakness, allowing you to exit positions or wait for a better opportunity.
Data Analysis: The table helps you understand the variability of SMAs, offering additional context for your trading decisions.
This powerful tool provides an in-depth view of market dynamics and helps you navigate your trading strategies with greater confidence. Embrace the Power Market Indicator and optimize your trading decisions today!
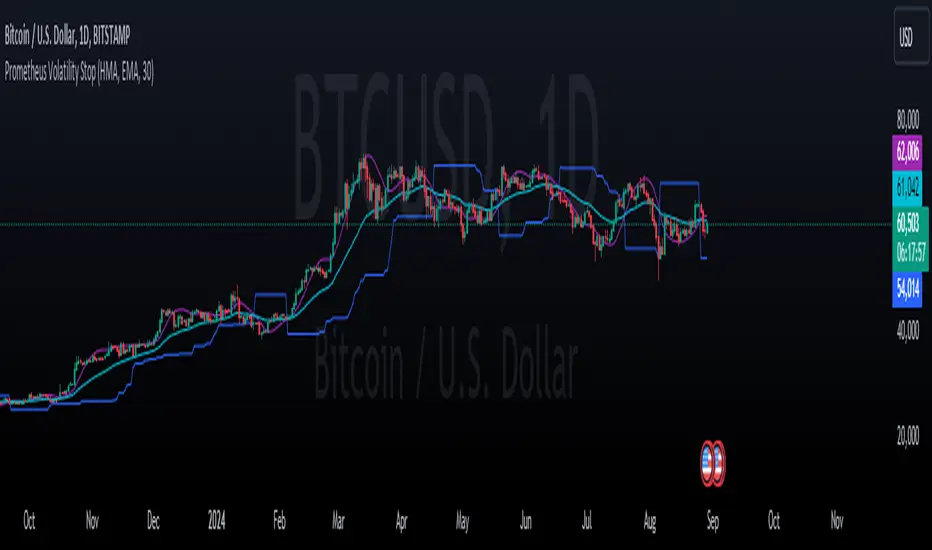
Prometheus Volatility StopThe Prometheus Volatility Stop is an indicator designed to give you a moving risk metric along with a custom Moving Average cross. After a calculation of the annualized volatility for the specified lookback period we determine bullish or bearish from the moving averages and plot the Volatility Stop accordingly.
User Input:
A user can select from Hull Moving Average, Exponential Moving average, Simple Moving Average, the Moving Average used in RSI, and Weighted Moving Average. The default is Hull Moving Average and Exponential Moving average.
A user can also specify the lookback period. The default is 30.
A user may also turn off the plots for the Moving Averages.
The reason for this approach is to be more original from the traditional Volatility Stop.
Calculation:
The Historical Volatility is calculated by taking the standard deviation of the log returns for the specified period and then annualizing it.
hv = ta.stdev(math.log(close / close ), lkb) * math.sqrt(252/5)
Then the Volatility Stop is calculated as follows:
recent_max = ta.highest(close, lkb)
recent_min = ta.lowest(close, lkb)
hv_stop = ma_2 > ma_1 ? recent_max + hv : recent_min - hv
When the second selected moving average is greater than the first, which signals bearishness, the historical volatility gets added to the high of that period. When the moving averages signal bullish the historical volatility gets subtracted from the low of that period.
Here is an example on NASDAQ:ARM :
After the first crossover, bullish signal, price runs for some time. As we get higher and higher so does the Volatility Stop. At the highs before a bearish crossover the price hits and closes at the Volatility Stop. Providing what could be an exit from a strong run up.
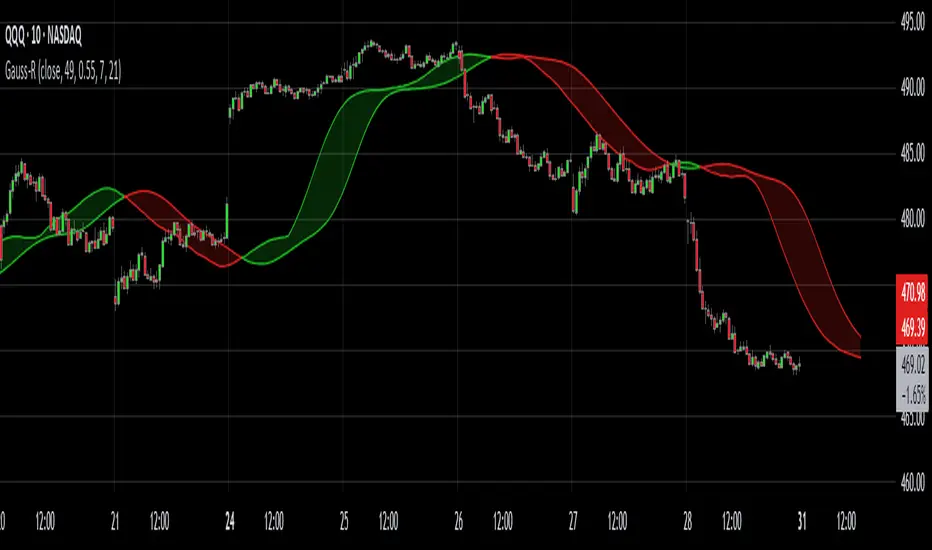
Intra-day example on NASDAQ:QQQ :
We see that in the early bearish move price goes on to hit the Volatility Stop before the trend switches.
We also see that in the failed long. The price action throughout the rest of the day, while not providing in profit stop outs, do provide fine directional alerts.
All those examples have been done with the default settings. Upon changing Moving Average One to a WMA and Moving Average Two to an SMA, as well as the lookback to 75. We see this quickly can become a simple trend follower.
This is the perspective we aim to provide. We encourage traders to not follow indicators blindly. No indicator is 100% accurate. This one can give you a different perspective of price strength with volatility. We encourage any comments about desired updates or criticism!
RSI-based MACDThe RSI is one of the most popular indicators available. This indicator, which represents the strength of market momentum based on the gains and losses over the past 14 candlesticks, is rational and is mainly used as an oscillator to determine overbought or oversold conditions. However, because the RSI is an older indicator, its very simple design—displaying only a single line on the graph—may feel somewhat lacking in functionality to modern traders. The main issue is that there is no objective measure to determine whether the RSI is currently rising or falling.
That’s when I came up with the idea of calculating the MACD based on the smoothed values of the RSI. As is well known, the MACD is an indicator that represents the distance between moving averages, designed to show when the moving averages cross as the value falls below zero. By observing the golden crosses and death crosses of the MACD and signal line, one can anticipate the golden and death crosses of the moving averages. Applying the same logic, I thought that calculating the MACD based on RSI values would allow us to predict the rise and fall of the RSI by observing these golden and death crosses.
Currently, the RSI is often used as a contrarian indicator to determine overbought and oversold conditions, but with this approach, I believe the RSI can instead function extremely well as a trend-following indicator. Whenever an uptrend occurs, the RSI inevitably rises, and when a downtrend occurs, the RSI inevitably falls. Therefore, by predicting the rise and fall of the RSI, it becomes possible to forecast what kind of trend is likely to develop.
In this indicator, the MACD calculated from the RSI is displayed, with the original RSI line plotted above it. Since the scales of the RSI and MACD are different, I originally wanted to provide a separate scale for the RSI on the left side. However, due to TradingView’s limitations, it seems quite difficult to display more than one scale in a single panel, so I had to give up on that. Instead, I ask that you mentally multiply the RSI values displayed on the right by 10—for example, 2.11 indicates 21.1%.
Additionally, as a bonus, I’ve included a feature that detects divergences. With these features, I believe this has become the most useful indicator when compared to existing RSI-based indicators. I hope you find it helpful in your trading.

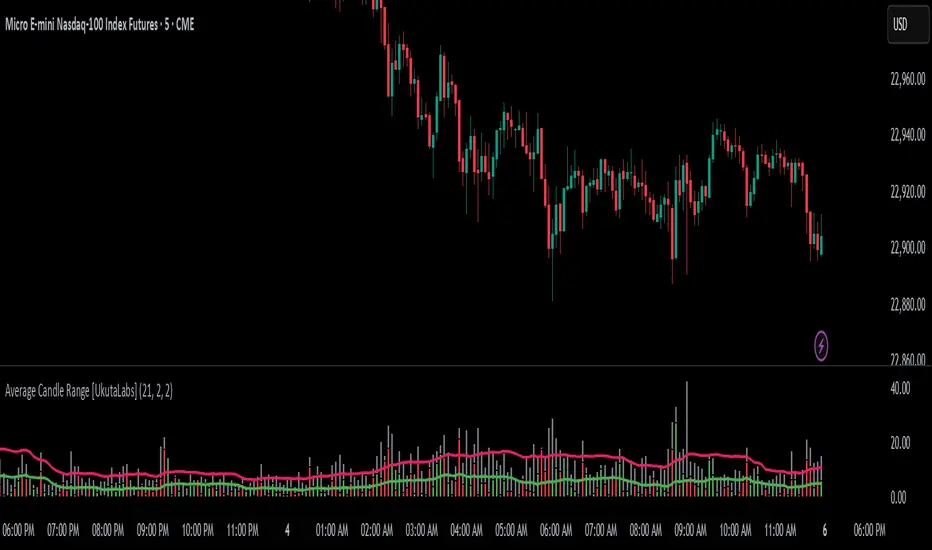
Average Candle Range [UkutaLabs]█ OVERVIEW
The Average Candle Range is a powerful indicator that compares the size of the current bar to past bars. This comparison can be used in a wide variety of trading strategies, allowing traders to understand at a glance the relative size of each candle.
█ USAGE
As each candlestick forms, two bars will be plotted on the indicator. The grey bar represents the total range of the candle from the high to the low, and the second bar represents the body of the bar from the open to the close. Depending on whether the bar is bullish or bearish, the second bar will be colored green or red respectively.
Two averages will also be drawn over these bars that represent the average size of the two bar types over a period that is specified by the user. These averages can be toggled in the indicator settings.
█ SETTINGS
Configuration
• Period: Determines how many bars to use in the calculation of the averages.
• Show Bar Average: Determines whether or not the average for the full bar size is displayed.
• Show Body Average: Determines whether or not the average for the body is displayed.
MA DifferenceThe MA Difference indicator shows 3 histograms representing differences in moving averages between a base MA (10) and 3 MA's: short (20), medium (50), and long (200). It also shows an exponentially weighted trend line which can indicate breakout opportunities, has alerts on all base <-> X crossovers, and shows potential consolidation zones where MA differences are below a user-defined tolerance.
The suggested way to use this indicator is to place a trade when the trend line is above the histogram (and filling the space between them). This indicates that the current MA values are significantly above or below the expected range and that prices are in the midst of breaking out. You may also consult the consolidation zones to eliminate false breakouts and momentary changes in trend. You may also consult the various short, medium, and long crossovers and crossunders to time entries and exits accordingly.
Histograms
The 3 histograms represent the differences between:
Base MA (10) and Short MA (20)
Base MA (10) and Medium MA (50)
Base MA (10) and Long MA (200)
All 4 moving average values can be configured in the indicator's settings. Consistency in direction and color of the histogram indicates a consistent trend across the various moving averages.
Trend Line
The trend line is an exponentially weighted average of the 3 moving averages, scaled by a factor configurable in the settings. When using the trend line, shading will be applied to the difference between the extremes of the histogram and the trend line to indicate that the chart is in a "breakout zone" and is beyond the normal, gradual sway of price action.
Crossovers/Crossunders
You may optionally turn on crossovers and crossunders in the indicator's settings to display when a short, medium, or long crossover occurs against the base moving average. Likewise, alerts are available for each crossover and crossunder for each of the 3 moving average convergences.
Consolidation Zones
Consolidation zones, as well as a line representing the current amount of consolidation, can also be optionally drawn on the chart. These indicate when a security is likely in consolidation, according to the spread of various MA values.

RV - Relative Strength Index Buy/SellIntroduction
The RV - RSI B/S V1.2 indicator leverages the RSI to identify overbought and oversold conditions in the market. The RSI line color changes according to bullish, bearish, oversold, and overbought zones, helping users identify direction and avoid false trades. By plotting the RSI along with user-defined moving averages and Bollinger Bands, it offers a multi-faceted approach to analyzing market momentum.
Indicator Overview
The indicator RSI line color changes as per the bullish, bearish, oversold, and overbought zones. This helps users find out the direction and the zones. The oversold and overbought zones are colored to help users avoid false trades.
Trading Strategy
Long Trades (Bullish Setup):
Entry: A long trade is initiated when the RSI crosses from 60 up to 80.
Exit: Long trades are generally exited when the RSI is between 80 and 90.
Condition: No long trades are taken if the RSI exceeds 80.
Short Trades (Bearish Setup):
Entry: A short trade is initiated when the RSI crosses from 40 down to 20.
Exit: Short trades are generally exited when the RSI is between 20 and 10.
Condition: No short trades are taken if the RSI falls below 20.
RSI Color Coding and Interpretation
The RV - RSI B/S V1.2 indicator uses color coding to provide a visual representation of RSI values, making it easier to identify critical levels at a glance:
Green (RSI 60-80): Indicates a bullish zone where long trades can be considered.
Red (RSI > 80): Signals an overbought condition where long trades should be avoided.
Orange (RSI 20-40): Indicates a bearish zone where short trades can be considered.
Pink (RSI < 20): Signals an oversold condition where short trades should be avoided.
RSI Settings and Their Importance
RSI Length: The default length is set to 12, which is the standard period for RSI calculation. This setting can be adjusted to increase or decrease sensitivity.
Source: The source of the data for the RSI calculation is typically the closing price.
MA Type: Various moving averages can be applied to the RSI, including SMA, EMA, SMMA (RMA), WMA, and VWMA. Each type offers different smoothing properties and can be selected based on
trading preferences.
MA Length: The default length is set to 20, aligning with the RSI length for consistency.
Bollinger Bands: When using Bollinger Bands, the standard deviation multiplier is set to 2.0 by default, but it can be adjusted to suit different volatility conditions.
Disclaimer
This indicator provides valuable signals for potential trading opportunities based on RSI levels and moving averages. However, it is crucial to incorporate directional price action analysis to confirm signals and improve trading accuracy. The RV - RSI B/S V1.2 should be used as part of a broader trading strategy, considering other technical and fundamental factors.

Multi-Chart Widget [LuxAlgo]The Multi-Chart Widget tool is a comprehensive solution crafted for traders and investors looking to analyze multiple financial instruments simultaneously. With the capability to showcase up to three additional charts, users can customize each chart by selecting different financial instruments, and timeframes.
Users can add various widely used technical indicators to the charts such as the relative strength index, Supertrend, moving averages, Bollinger Bands...etc.
🔶 USAGE
The tool offers traders and investors a comprehensive view of multiple charts simultaneously. By displaying up to three additional charts alongside the primary chart, users can analyze assets across different timeframes, compare their performance, and make informed decisions.
Users have the flexibility to choose from various customizable chart types, including the recently added "Volume Candles" option.
This tool allows adding to the chart some of the most widely used technical indicators, such as the Supertrend, Bollinger Bands, and various moving averages.
In addition to the charting capabilities, the tool also features a dynamic statistic panel that provides essential metrics and key insights into the selected assets. Users can track performance indicators such as relative strength, trend, and volatility, enabling them to identify trends, patterns, and trading opportunities efficiently.
🔶 DETAILS
A brief overview of the indicators featured in the statistic panel is given in the sub-section below:
🔹Dual Supertrend
The Dual Supertrend is a modified version of the Supertrend indicator, which is based on the concept of trend following. It generates buy or sell signals by analyzing the asset's price movement. The Dual Supertrend incorporates two Supertrend indicators with different parameters to provide potentially more accurate signals. It helps traders identify trend reversals and establish trend direction in a more responsive manner compared to a single Supertrend.
🔹Relative Strength Index
The Relative Strength Index is a momentum oscillator that measures the speed and change of price movements. RSI oscillates between 0 and 100 and is typically used to identify overbought or oversold conditions in a market. Traditionally, RSI values above 70 are considered overbought, suggesting that the asset may be due for a reversal or correction, while RSI values below 30 are considered oversold, indicating potential buying opportunities.
🔹Volatility
Volatility in trading refers to the degree of variation or fluctuation in the price of a financial instrument, such as a stock, currency pair, or commodity, over a certain period of time. It is a measure of the speed and magnitude of price changes and reflects the level of uncertainty or risk in the market. High volatility implies that prices are experiencing rapid and significant movements, while low volatility suggests that prices are relatively stable and are not changing much. Traders often use volatility as an indicator to assess the potential risk and return of an investment and to make informed decisions about when to enter or exit trades.
🔹R-Squared (R²)
R-squared, also known as the coefficient of determination, is a statistical measure that indicates the proportion of the variance in the dependent variable that is predictable from the independent variable(s). In other words, it quantifies the goodness of fit of a regression model to the observed data. R-squared values range from %0 to %100, with higher values indicating a better fit of the model to the data. An R-squared of 100% means that all movements of a security are completely explained by movements in the index, while an R-squared value of %0 indicates that the model does not explain any of the variability in the dependent variable.
In simpler terms, in investing, a high R-squared, from 85% to 100%, indicates that the stock’s or fund’s performance moves relatively in line with the index. Conversely, a low R-squared (around 70% or less) indicates that the fund's performance tends to deviate significantly from the movements of the index.
🔶 SETTINGS
🔹Mini Chart(s) Generic Settings
Mini Charts Separator: This option toggles the visibility of the separator lines.
Number Of Bars: Specifies the number of bars to be displayed for each mini chart.
Horizontal Offset: Determines the distance at which the mini charts will be displayed from the primary chart.
🔹Mini Chart Settings: Top - Middle - Bottom
Mini Chart Top/Middle/Bottom: Toggle the visibility of the selected mini chart.
Symbol: Choose the financial instrument to be displayed in the mini chart. If left as an empty string, it will default to the current chart instrument.
Timeframe: This option determines the timeframe used for calculating the mini charts. If a timeframe lower than the chart's timeframe is selected, the calculations will be based on the chart's timeframe.
Chart Type: Selection from various chart types for the mini charts, including candles, volume candles, line, area, columns, high-low, and Heikin Ashi.
Chart Size: Determines the size of the mini chart.
Technical Indicator: Selection from various technical indicators to be displayed on top of the mini charts.
Note : Chart sizing is relative to other mini charts. For example, If all the mini charts are sized to x5 relative to each other, the result will be the same as if they were all sized as x1. This is because the relative proportions between the mini charts remain consistent regardless of their absolute sizes. Therefore, their positions and sizes relative to each other remain unchanged, resulting in the same visual representation despite the differences in absolute scale.
🔹Supertrend Settings
ATR Length: is the lookback length for the ATR calculation.
Factor: is what the ATR is multiplied by to offset the bands from price.
Color: color customization option.
🔹Moving Average Settings
Type: is the type of the moving average, available types of moving averages include SMA (Simple Moving Average), EMA (Exponential Moving Average), RMA (Root Mean Square Moving Average), HMA (Hull Moving Average), WMA (Weighted Moving Average), and VWMA (Volume Weighted Moving Average).
Source: Determines what data from each bar will be used in calculations.
Length: The time period to be used in calculating the Moving Average.
Color: Color customization option.
🔹Bollinger Bands Settings
Basis Type: Determines the type of Moving Average that is applied to the basis plot line.
Source: Determines what data from each bar will be used in calculations.
Length: The time period to be used in calculating the Moving Average which creates the base for the Upper and Lower Bands.
StdDev: The number of Standard Deviations away from the Moving Average that the Upper and Lower Bands should be.
Color: Color customization options for basis, upper and lower bands.
🔹Mini Chart(s) Panel Settings
Mini Chart(s) Panel: Controls the visibility of the panel containing the mini charts.
Dual Supertrend: Toggles the display of the evaluated dual super trend, based on the super trend settings provided below the option. The definitions for the options are the same as stated above for the super trend.
Relative Strength Index: Toggles the display of the evaluated RSI, based on the source and length settings provided below the option.
Volatility: Toggles the display of the calculated Volatility, based on the length settings provided below the option.
R-Squared: Toggles the display of the calculated R-Squared (R²), based on the length settings provided below the option.
🔶 LIMITATIONS
The tool allows users to display mini charts featuring various types of instruments alongside the primary chart instrument. However, there's a limitation: the selected primary chart instrument must have an ACTIVE market status. Alternatively, if the primary chart instrument is not active, the mini chart instruments must belong to the same exchange and have the same type as the primary chart instrument.

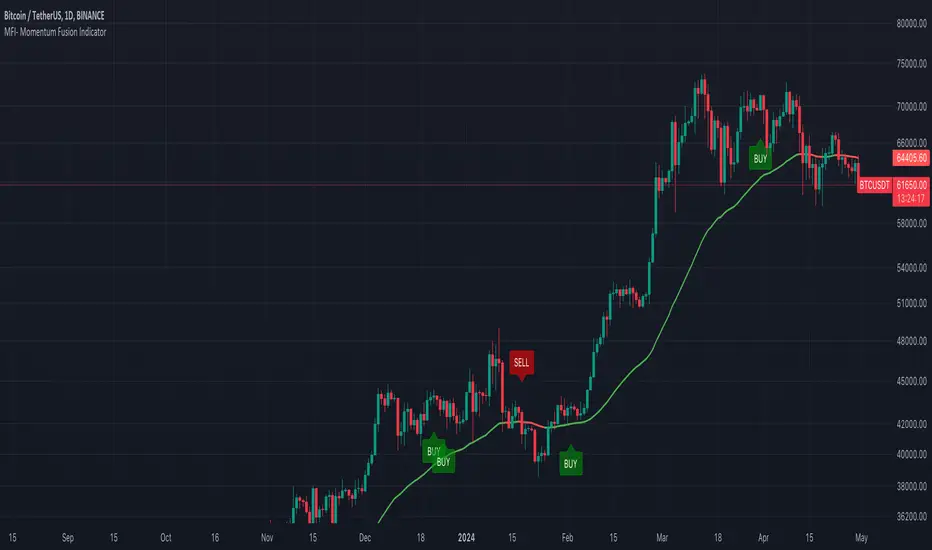
MFI- Momentum Fusion IndicatorIndicator Overview
The "MFI - Momentum Fusion Indicator" is a comprehensive trading tool designed for TradingView that combines several technical analysis methods to assist traders in identifying potential buy and sell opportunities in financial markets.
Key Components
Moving Averages (MA): Uses two Simple Moving Averages (SMA) with periods defined by the user (default 10 and 20). The indicator generates buy signals when the shorter MA (MA 10) crosses above the longer MA (MA 20) and sell signals when it crosses below, helping to pinpoint trend reversals.
Relative Strength Index (RSI): A momentum oscillator that helps identify overbought or oversold conditions, adding a layer of confirmation to the signals generated by the moving averages.
Exponential Moving Average (EMA 50): Used to gauge the medium-term trend direction. The color of the EMA line changes based on whether the trend is up (green) or down (red), providing a visual representation of the market trend.
Average True Range (ATR): This component measures market volatility. Signals are only generated when the ATR confirms significant market movement relative to the EMA50, enhancing the reliability of the signals during volatile conditions.
How It Works
Signal Generation: The core of the indicator is based on the crossover of two SMAs. A buy signal is issued when the short-term MA crosses above the long-term MA during sufficient market volatility (confirmed by ATR). Conversely, a sell signal is triggered when the short-term MA crosses below the long-term MA under similar conditions.
Trend Confirmation: The EMA50 helps confirm the broader market trend, while the ATR ensures that the crossover signals occur during periods of meaningful price movement, filtering out noise and less significant price movements.
Use Case
For Traders: The indicator is ideal for traders who need clear, actionable signals combined with an assessment of market conditions. It’s particularly useful in markets where understanding volatility and momentum is crucial, such as in cryptocurrencies and forex.
Benefits
Comprehensive Analysis: Combines trend, momentum, and volatility analysis in one tool, providing a multifaceted approach to the markets.
Enhanced Decision-Making: By integrating multiple indicators, it reduces the likelihood of false signals and enhances decision-making confidence.
Customizable and Dynamic: Allows for easy adjustment of parameters to fit different trading styles and market conditions.
This indicator equips traders with a powerful blend of tools to analyze price movements and make informed trading decisions based on a combination of trend, momentum, and volatility insights.
Volatility Adjusted Weighted DEMA [BackQuant]Volatility Adjusted Weighted DEMA
The Volatility Adjusted Weighted Double Exponential Moving Average (VAWDEMA) by BackQuant is a sophisticated technical analysis tool designed for traders seeking to integrate volatility into their moving average calculations. This innovative indicator adjusts the weighting of the Double Exponential Moving Average (DEMA) according to recent volatility levels, offering a more dynamic and responsive measure of market trends.
Primarily, the single Moving average is very noisy, but can be used in the context of strategy development, where as the crossover, is best used in the context of defining a trading zone/ macro uptrend on higher timeframes.
Why Volatility Adjustment is Beneficial
Volatility is a fundamental aspect of financial markets, reflecting the intensity of price changes. A volatility adjustment in moving averages is beneficial because it allows the indicator to adapt more quickly during periods of high volatility, providing signals that are more aligned with the current market conditions. This makes the VAWDEMA a versatile tool for identifying trend strength and potential reversal points in more volatile markets.
Understanding DEMA and Its Advantages
DEMA is an indicator that aims to reduce the lag associated with traditional moving averages by applying a double smoothing process. The primary benefit of DEMA is its sensitivity and quicker response to price changes, making it an excellent tool for trend following and momentum trading. Incorporating DEMA into your analysis can help capture trends earlier than with simple moving averages.
The Power of Combining Volatility Adjustment with DEMA
By adjusting the weight of the DEMA based on volatility, the VAWDEMA becomes a powerful hybrid indicator. This combination leverages the quick responsiveness of DEMA while dynamically adjusting its sensitivity based on current market volatility. This results in a moving average that is both swift and adaptive, capable of providing more relevant signals for entering and exiting trades.
Core Logic Behind VAWDEMA
The core logic of the VAWDEMA involves calculating the DEMA for a specified period and then adjusting its weighting based on a volatility measure, such as the average true range (ATR) or standard deviation of price changes. This results in a weighted DEMA that reflects both the direction and the volatility of the market, offering insights into potential trend continuations or reversals.
Utilizing the Crossover in a Trading System
The VAWDEMA crossover occurs when two VAWDEMAs of different lengths cross, signaling potential bullish or bearish market conditions. In a trading system, a crossover can be used as a trigger for entry or exit points:
Bullish Signal: When a shorter-period VAWDEMA crosses above a longer-period VAWDEMA, it may indicate an uptrend, suggesting a potential entry point for a long position.
Bearish Signal: Conversely, when a shorter-period VAWDEMA crosses below a longer-period VAWDEMA, it might signal a downtrend, indicating a possible exit point or a short entry.
Incorporating VAWDEMA crossovers into a trading strategy can enhance decision-making by providing timely and adaptive signals that account for both trend direction and market volatility. Traders should combine these signals with other forms of analysis and risk management techniques to develop a well-rounded trading strategy.
Alert Conditions For Trading
alertcondition(vwdema>vwdema , title="VWDEMA Long", message="VWDEMA Long - {{ticker}} - {{interval}}")
alertcondition(vwdema

Reversal and Breakout Signals [AlgoAlpha]🚀🌟 Introducing the Reversal and Breakout Signals by AlgoAlpha 🌟🚀
This innovative tool is crafted to enhance your chart analysis by identifying potential reversal and breakout opportunities directly on your charts. It's designed with both novice and experienced traders in mind, providing intuitive visual cues for better decision-making. Let's dive into the key features and how it operates:
### Key Features:
🔶 Dynamic Period Settings: Customize the sensitivity of the indicator with user-defined periods for both the indicator and volume strength.
📊 Volume Threshold: Set a threshold to define what constitutes strong volume, enabling the identification of significant market movements.
💡 Trend Coloring: Option to color candles during trends, making it easier to visualize bullish and bearish market conditions.
🌈 Customizable Visuals: Choose your preferred colors for bullish, bearish, and breakout signals, personalizing the chart to your liking.
🚨 Advanced Alert System: Configure alerts for reversal and breakout signals, ensuring you never miss a potential trading opportunity.
### How to Use:
To maximize the effectiveness of the Reversal and Breakout Signals tool, follow these steps:
1. 🔧 Set Up Your Preferences:
- Adjust the Indicator Period and Volume Strength Period to match the timeframe of your trading strategy. This fine-tuning allows the indicator to better align with your specific market analysis needs.
- Define the Strong Volume Threshold to distinguish between ordinary and significant volume movements. This helps in identifying breakout or reversal signals with higher confidence.
2. 🎨 Customize Visuals:
- Choose colors for Bullish , Bearish , and Breakout Signals to visually differentiate between different types of market activities. This customization facilitates quicker decision-making while scanning charts.
3. 🔍 Reversal Signals:
- Bullish Reversal : Look for a triangle below the bar indicating a potential upward movement. It's identified when the price dips below the lower level but closes above it, suggesting a rejection of lower prices.
- Bearish Reversal : A triangle above the bar signals a potential downward movement. This occurs when the price spikes above the upper level but closes below, indicating a rejection of higher prices.
4. 📈 Trend and Breakout Signals:
- Diamonds represent breakout signals. A bullish breakout is marked below the bar when the price closes above the upper level, suggesting strong buying pressure. Conversely, a bearish breakout above the bar indicates strong selling pressure as the price closes below the lower level.
- The tool also features a Trend Tracker that highlights the current market trend using the Hull Moving Average (HMA). This can help you stay aligned with the overall market direction for your trades.
By integrating these steps into your trading strategy, the Reversal and Breakout Signals tool can provide actionable insights to help identify potential entry and exit points, enhancing your trading decisions with visual cues and alerts for market reversals and breakouts.
### How It Works:
The core logic revolves around calculating weighted moving averages of high and low prices over a user-defined period, identifying the highest and lowest points within this period to establish potential breakout or breakdown levels while reducing the amount of noise, hence the use of moving averages.
1. Weighted Moving Averages Calculation:
sh = ta.wma(high, len)
sl = ta.wma(low, len)
h = ta.highest(sh, len)
l = ta.lowest(sl, len)
2. Breakout and Reversal Detection:
The script then employs logic to detect bullish and bearish breakouts and reversals based on the closing price's position relative to these levels, combined with volume analysis to confirm the strength of the move.
if not (h < h or h > h )
hstore := h
if not (l < l or l > l )
lstore := l
bullishbreakout := (breakout or ((breakout or breakout or breakout or breakout ) and candledir == 1)) and strongvol and not (bullishbreakout or bullishbreakout or bullishbreakout )
bearishbreakout := (breakdown or ((breakdown or breakdown or breakdown or breakdown ) and candledir == -1)) and strongvol and not (bearishbreakout or bearishbreakout or bearishbreakout )
3. Visual Indicators and Alerts:
Visual cues such as triangle shapes for reversals and diamonds for breakouts, along with colored bars, make it easy to spot these opportunities. Additionally, alerts can be set up for these events, ensuring traders can react promptly to potential trading setups.
plotshape(bullishrej and not (state ==- 1) ? low * 0.9995 : na, " Bullish Reversal ", shape.triangleup, location.belowbar, color.new(green, 0), size = size.tiny, text = "𝓡", textcolor = color.gray)
plotshape(bearishrej and not (state == 1) ? high * 1.0005 : na, " Bearish Reversal ", shape.triangledown, location.abovebar, color.new(red, 0), size = size.tiny, text = "𝓡", textcolor = color.gray)
plotshape(bullishbreakout ? low * 0.999 : na, " Bullish Breakout ", shape.diamond, location.belowbar, color.new(yellow, 0), size = size.tiny, text = "𝓑", textcolor = color.gray)
plotshape(bearishbreakout ? high * 1.001 : na, " Bearish Breakout ", shape.diamond, location.abovebar, color.new(yellow, 0), size = size.tiny, text = "𝓑", textcolor = color.gray)
This script is a versatile tool designed to aid in the identification of key reversal and breakout points, helping traders to make informed decisions based on technical analysis. Its customization options allow for a tailored analysis experience, fitting the unique needs and strategies of each trader.

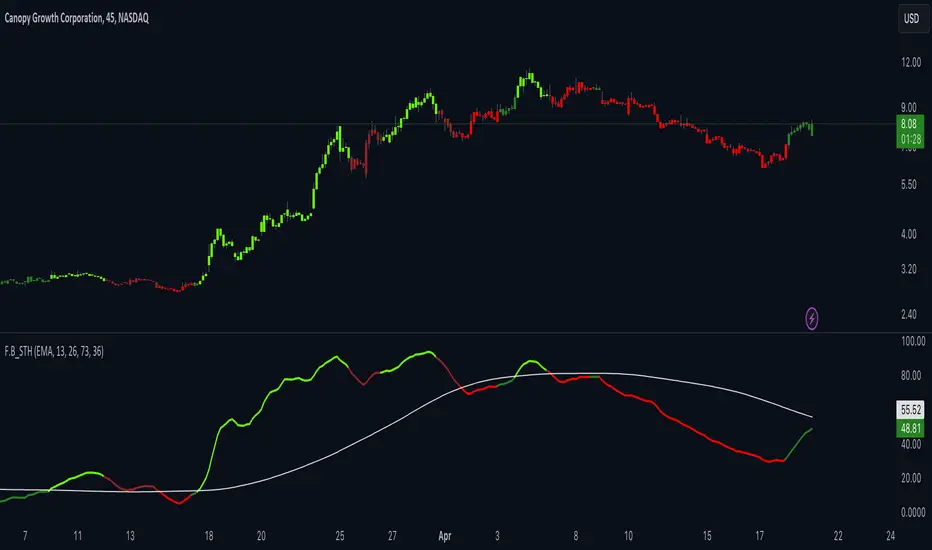
F.B_Stochastic Trend HarmonizerThe "F.B_Stochastic Trend Harmonizer" has been developed to provide insights into market trends. It combines stochastic oscillations with moving averages. Stochastic oscillators are used to measure market fluctuations, while moving averages serve to smooth these fluctuations and identify trends. By linking these elements, the indicator aims to offer an enhanced representation of market dynamics and potential trend reversals.
You can choose various types of moving averages such as SMA, EMA, or WMA and control the sensitivity of the lines by adjusting the smoothing factors. The fast line displays harmonized stochastic values, while the slow line is smoothed by a moving average.
The "Fast Line 2" marks individual candles for better visibility. It is recommended to combine this indicator with other analysis tools to make trading decisions.
If the "Fast Line" is greater than the "Slow Line MA," it indicates an uptrend. Conversely, if the "Fast Line" is smaller than the "Slow Line MA," it signals a downtrend.
VARGAS"VARGAS" is an indicator that can be used in all timeframes on charts in the stock, crypto, and commodity markets. It allows trades to be opened according to the intersections of moving averages in different time periods.
It is an indicator using weighted moving averages. Using a weighted moving average has the following benefits for traders:
1) Precision and Smoothness: The WMA typically gives more weight to recent prices and therefore reacts faster to more recent data. This helps you catch price movements faster and recognize trend changes faster. On the other hand, the WMA is smoother than the simple moving average (SMA), which makes it less likely to generate false signals.
2) Trend Identification: The WMA is used to identify and analyze price trends. It is especially important for traders who want to track short-term movements. The WMA is used to assess the direction and strength of the trend.
3) Trading Signals: The WMA is used as part of various trading strategies. It is especially used in moving average crossover strategies. For example, a short-term WMA crossing the long-term WMA to the upside can be considered a buy signal, while a reversal can be interpreted as a sell signal.
4) Adaptability to Volatility: WMA can adapt to volatility by changing weighting factors. Investors can adopt a more flexible approach by assigning different weights based on market conditions and asset classes.
5) Data Correction: WMA can be helpful in reducing data noise. A single large price fluctuation can cause the SMA to be more affected, while the WMA reduces the impact of these fluctuations.
In our VARGAS coding, the intersection times of the 9-day and 15-day weighted moving averages allow us to decide the direction of the trend. The green and red cloud areas following the price candles make the strategy easy for the user to follow.
At the intersection between the 9-day weighted moving average and the 15-day weighted moving average, we can use buy and sell signals as follows:
If the 9-day weighted moving average crosses the 15-day weighted moving average upwards, buy,
Sell if the 9-day weighted moving average crosses the 15-day weighted moving average downwards.
Within the scope of this strategy, GOLDEN CROSS and DEATH CROSS intersections, which guide us for trend changes, are also included in the coding. Thus, it is aimed to add strength to our WMA 9 and WMA 15 intersection strategy as an idea.
VARGAS indicator gives better results for longer periods of 4 hours and above. As the time period increases, the probability of correct results will increase.
**
"VARGAS" hisse senedi, kripto, ve emtia piyasalarındaki grafiklerde her türlü zaman diliminde kullanılabilen bir indikatördür. Farklı zaman periyotlarındaki hareketli ortalamaların kesişimlerine göre işlem açılmasını sağlar.
Ağırlıklı hareketli ortalamalar kullanılarak hazırlanmış bir göstergedir. Ağırlıklı hareketli ortalama kullanmanın yatırımcılara aşağıdaki gibi faydaları bulunmaktadır:
1) Duyarlılık ve Pürüzsüzlük: WMA, tipik olarak son dönem fiyatlarına daha fazla ağırlık verir ve bu nedenle daha güncel verilere daha hızlı tepki verir. Bu, fiyat hareketlerini daha hızlı yakalamanıza ve daha hızlı trend değişikliklerini tanımanıza yardımcı olur. Diğer yandan, WMA, basit hareketli ortalamaya (SMA) göre daha pürüzsüzdür, bu da yanlış sinyal üretme olasılığını azaltır.
2) Trend Belirleme: WMA, fiyat trendlerini belirlemek ve analiz etmek için kullanılır. Özellikle kısa vadeli hareketleri izlemek isteyen yatırımcılar için önemlidir. WMA, trendin yönünü ve gücünü değerlendirmek için kullanılır.
3) Ticaret Sinyalleri: WMA, çeşitli ticaret stratejilerinin bir parçası olarak kullanılır. Özellikle hareketli ortalama crossover stratejilerinde kullanılır. Örneğin, kısa vadeli WMA'nın uzun vadeli WMA'yı yukarı yönlü kesmesi bir alım sinyali olarak kabul edilebilir, tersine dönmesi ise bir satış sinyali olarak yorumlanabilir.
4) Volatiliteye Uyarlanabilirlik: WMA, ağırlıklandırma faktörlerini değiştirerek volatiliteye uyum sağlayabilir. Yatırımcılar, piyasa koşullarına ve varlık sınıflarına göre farklı ağırlıklar atayarak daha esnek bir yaklaşım benimseyebilirler.
5) Veri Düzeltme: WMA, veri gürültüsünü azaltmada yardımcı olabilir. Tek bir büyük fiyat dalgalanması, SMA'nın daha fazla etkilenmesine neden olabilirken, WMA bu dalgalanmaların etkisini azaltır.
VARGAS isimli kodlamamızda ise 9 günlük ve 15 günlük ağırlıklı hareketli ortalamaların kesişme zamanları trendin yönüne karar vermemizi sağlar. Fiyat mumlarını takip eden yeşil ve kırmızı bulut alanları stratejinin kullanıcı tarafından kolaylıkla takip edilmesini sağlamaktadır.
9 Günlük Ağırlıklı hareketli ortalama, 15 Günlük Ağırlıklı hareketli ortalama arasındaki kesişimde al ve sat sinyallerini şu şekilde kullanabiliriz:
Eğer 9 günlük ağırlıklı hareketli ortalama 15 günlük ağırlıklı hareketli ortalamayı yukarı doğru kesiyorsa al,
Eğer 9 günlük ağırlıklı hareketli ortalama, 15 günlük ağırlıklı hareketli ortalamayı aşağı doğru keserse sat.
Bu strateji kapsamında trend değişimleri için bizlere yön veren GOLDEN CROSS ve DEATH CROSS kesişimleri de kodlamanın içerisinde dahil edilmiştir. Böylelikle WMA 9 ve WMA 15 kesişim stratejimize fikir olarak güç katması hedeflenmiştir.
VARGAS indikatörü 4 saat ve üzeri daha uzun periyotlarda daha iyi sonuçlar vermektedir. Zaman periyodu büyüdükçe doğru sonuç verme olasılığı artacaktır.

Gaussian RibbonThe Gaussian Ribbon utilizes two "Arnaud Legoux" moving averages with the same length to identify changes in trend direction. The plotted channel consists of two lines, one based on the default offset and sigma values, and the other with slightly adjusted customizable parameters.
ALMA is a type of moving average that is related to the Gaussian function through its mathematical formula and the concept of weighted averages.
The ALMA is designed to reduce lag in moving averages and provide more timely responses to price changes. It achieves this by applying a Gaussian distribution (bell-shaped curve) as a weighting function to the price data.
The Gaussian function is used to calculate the weights in the ALMA formula. These weights give more importance to recent price data while gradually reducing the influence of older data points. This results in a smoother and more responsive moving average.
In summary, the Gaussian Ribbon uses the offset and power of the second ALMA to create a lag that still calculates using the same length.
EMA-Deviation-Corrected T3 [Loxx]EMA-Deviation-Corrected T3 is a T3 moving average that uses EMA deviation correcting to produce signals. This comes via the beloved genius Mladen.
The origin of the correcting algorithm can be attributed to Dr. Alexander Uhl, who developed a method to filter the moving average and identify signals. Originally, this method utilized standard deviation as a measure to correct the average values.
However, the current indicator in question employs a modified version of the correcting method. Instead of using standard deviation for calculation, it uses EMA deviation, which stands for Exponential Moving Average deviation. The idea behind using EMA deviation is two-fold:
Efficiency: EMA deviation can be calculated faster than standard deviation, resulting in more efficient code execution.
Signal Reduction: Surprisingly, this modified "correcting" approach generates fewer signals compared to using standard deviation. This is because EMA deviation is more responsive to price changes, making the correcting process less sensitive to whipsaws or false signals.
What is T3?
The T3 moving average, short for "Tim Tillson's Triple Exponential Moving Average," is a technical indicator used in financial markets and technical analysis to smooth out price data over a specific period. It was developed by Tim Tillson, a software project manager at Hewlett-Packard, with expertise in Mathematics and Computer Science.
The T3 moving average is an enhancement of the traditional Exponential Moving Average (EMA) and aims to overcome some of its limitations. The primary goal of the T3 moving average is to provide a smoother representation of price trends while minimizing lag compared to other moving averages like Simple Moving Average (SMA), Weighted Moving Average (WMA), or EMA.
To compute the T3 moving average, it involves a triple smoothing process using exponential moving averages. Here's how it works:
Calculate the first exponential moving average (EMA1) of the price data over a specific period 'n.'
Calculate the second exponential moving average (EMA2) of EMA1 using the same period 'n.'
Calculate the third exponential moving average (EMA3) of EMA2 using the same period 'n.'
The formula for the T3 moving average is as follows:
T3 = 3 * (EMA1) - 3 * (EMA2) + (EMA3)
By applying this triple smoothing process, the T3 moving average is intended to offer reduced noise and improved responsiveness to price trends. It achieves this by incorporating multiple time frames of the exponential moving averages, resulting in a more accurate representation of the underlying price action.
Included
Bar coloring
Signals
Alerts
Loxx's Expanded Source Types

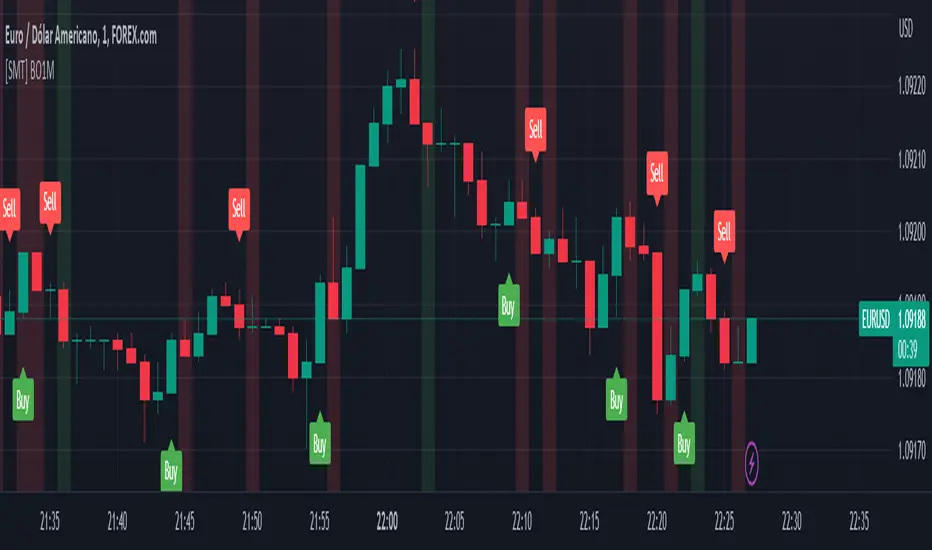
[SMT] Binary Option 1 MinuteThis indicator called " Binary Option 1 Minute" is designed to trade binary options on 1-minute time frames. It is based on two moving averages and a crossover signal. The moving averages used are calculated from the average prices of the last time periods. The first moving average is calculated with a shorter period, while the second is calculated with a longer period.
The signal is generated when the first moving average crosses above or below the second moving average, and then an additional filter is applied. The signal filter is calculated using an exponentially weighted moving average of the difference between the two moving averages. When the signal crosses above the zero line, a buy signal is generated, and when the signal crosses below the zero line, a sell signal is generated.
The indicator plots buy and sell arrows on the chart when a signal is generated. Additionally, it can also display gains and losses in the form of background colors. The green color indicates a gain, and the red color indicates a loss. Finally, the indicator includes sound and text alerts to inform the trader about the generation of a signal.
Attention: This indicator does not repaint! Wait for the candle to close to confirm the entry signal. Remember that signals do not imply guarantees of accuracy or gains. It is highly recommended that you test the indicator on a demo account before using it on a real account.
SuperTrend with Chebyshev FilterModified Super Trend with Chebyshev Filter
The Modified Super Trend is an innovative take on the classic Super Trend indicator. This advanced version incorporates a Chebyshev filter, which significantly enhances its capabilities by reducing false signals and improving overall signal quality. In this post, we'll dive deep into the Modified Super Trend, exploring its history, the benefits of the Chebyshev filter, and how it effectively addresses the challenges associated with smoothing, delay, and noise.
History of the Super Trend
The Super Trend indicator, developed by Olivier Seban, has been a popular tool among traders since its inception. It helps traders identify market trends and potential entry and exit points. The Super Trend uses average true range (ATR) and a multiplier to create a volatility-based trailing stop, providing traders with a dynamic tool that adapts to changing market conditions. However, the original Super Trend has its limitations, such as the tendency to produce false signals during periods of low volatility or sideways trading.
The Chebyshev Filter
The Chebyshev filter is a powerful mathematical tool that makes an excellent addition to the Super Trend indicator. It effectively addresses the issues of smoothing, delay, and noise associated with traditional moving averages. Chebyshev filters are named after Pafnuty Chebyshev, a renowned Russian mathematician who made significant contributions to the field of approximation theory.
The Chebyshev filter is capable of producing smoother, more responsive moving averages without introducing additional lag. This is possible because the filter minimizes the worst-case error between the ideal and the actual frequency response. There are two types of Chebyshev filters: Type I and Type II. Type I Chebyshev filters are designed to have an equiripple response in the passband, while Type II Chebyshev filters have an equiripple response in the stopband. The Modified Super Trend allows users to choose between these two types based on their preferences.
Overcoming the Challenges
The Modified Super Trend addresses several challenges associated with the original Super Trend:
Smoothing: The Chebyshev filter produces a smoother moving average without introducing additional lag. This feature is particularly beneficial during periods of low volatility or sideways trading, as it reduces the number of false signals.
Delay: The Chebyshev filter helps minimize the delay between price action and the generated signal, allowing traders to make timely decisions based on more accurate information.
Noise Reduction: The Chebyshev filter's ability to minimize the worst-case error between the ideal and actual frequency response reduces the impact of noise on the generated signals. This feature is especially useful when using the true range as an offset for the price, as it helps generate more reliable signals within a reasonable time frame.
The Great Replacement
The Modified Super Trend with Chebyshev filter is an excellent replacement for the original Super Trend indicator. It offers significant improvements in terms of signal quality, responsiveness, and accuracy. By incorporating the Chebyshev filter, the Modified Super Trend effectively reduces the number of false signals during low volatility or sideways trading, making it a more reliable tool for identifying market trends and potential entry and exit points.
In-Depth Guide to the Modified Super Trend Settings
The Modified Super Trend with Chebyshev filter offers a wide range of settings that allow traders to fine-tune the indicator to suit their specific trading styles and objectives. In this section, we will discuss each setting in detail, explaining its purpose and how to use it effectively.
Source
The source setting determines the price data used for calculations. The default setting is hl2, which calculates the average of the high and low prices. You can choose other price data sources such as close, open, or ohlc4 (average of open, high, low, and close prices) based on your preference.
Up Color and Down Color
These settings control the color of the trend line when the market is in an uptrend (up_color) and a downtrend (down_color). You can customize these colors to your liking, making it easier to visually identify the current market trend.
Text Color
This setting controls the color of the text displayed on the chart when using labels to indicate trend changes. You can choose any color that contrasts well with your chart background for better readability.
Mean Length
The mean_length setting determines the length (number of bars) used for the Chebyshev moving average calculation. A shorter length will make the moving average more responsive to price changes, while a longer length will produce a smoother moving average. It is crucial to find the right balance between responsiveness and smoothness, as a too-short length may generate false signals, while a too-long length might produce lagging signals. The default value is 64, but you can experiment with different values to find the optimal setting for your trading strategy.
Mean Ripple
The mean_ripple setting influences the Chebyshev filter's ripple effect in the passband (Type I) or stopband (Type II). The ripple effect represents small oscillations in the frequency response, which can impact the moving average's smoothness. The default value is 0.01, but you can experiment with different values to find the best balance between smoothness and responsiveness.
Chebyshev Type: Type I or Type II
The style setting allows you to choose between Type I and Type II Chebyshev filters. Type I filters have an equiripple response in the passband, while Type II filters have an equiripple response in the stopband. Depending on your preference for smoothness and responsiveness, you can choose the type that best fits your trading style.
ATR Style
The atr_style setting determines the method used for calculating the Average True Range (ATR). By default (false), it uses the traditional high-low range. When set to true, it uses the absolute difference between the open and close prices. You can choose the method that works best for your trading strategy and the market you are trading.
ATR Length
The atr_length setting controls the length (number of bars) used for calculating the ATR. Similar to the mean_length, a shorter length will make the ATR more responsive to price changes, while a longer length will produce a smoother ATR. The default value is 64, but you can experiment with different values to find the optimal setting for your trading strategy.
ATR Ripple
The atr_ripple setting, like the mean_ripple, influences the ripple effect of the Chebyshev filter used in the ATR calculation. The default value is 0.05, but you can experiment with different values to find the best balance between smoothness and responsiveness.
Multiplier
The multiplier setting determines the factor by which the ATR is multiplied before being added
Super Trend Logic and Signal Optimization
The Modified Super Trend with Chebyshev filter is designed to minimize false signals and provide a clear indication of market trends. It does so by using a combination of moving averages, Average True Range (ATR), and a multiplier. In this section, we will discuss the Super Trend's logic, its ability to prevent false signals, and the early warning crosses added to the indicator.
Super Trend Logic
The Super Trend's logic is based on a combination of the Chebyshev moving average and ATR. The Chebyshev moving average is a smooth moving average that effectively filters out market noise, while the ATR is a measure of market volatility.
The Super Trend is calculated by adding or subtracting a multiple of the ATR from the Chebyshev moving average. The multiplier is a user-defined value that determines the distance between the trend line and the price action. A larger multiplier results in a wider channel, reducing the likelihood of false signals but potentially missing out on valid trend changes.
Preventing False Signals
The Super Trend is designed to minimize false signals by maintaining its trend direction until a significant change in the market occurs. In a downtrend, the trend line will only decrease in value, and in an uptrend, it will only increase. This helps prevent false signals caused by temporary price fluctuations or market noise.
When the price crosses the trend line, the Super Trend does not immediately change its direction. Instead, it employs a safety logic to ensure that the trend change is genuine. The safety logic checks if the new trend line (calculated using the updated moving average and ATR) is more extreme than the previous one. If it is, the trend line is updated; otherwise, the previous trend line is maintained. This mechanism further reduces the likelihood of false signals by ensuring that the trend line only changes when there is a significant shift in the market.
Early Warning Crosses
To provide traders with additional insight, the Modified Super Trend with Chebyshev filter includes early warning crosses. These crosses are plotted on the chart when the price crosses the trend line without the safety logic. Although these crosses do not necessarily indicate a trend change, they can serve as a valuable heads-up for traders to monitor the market closely and prepare for potential trend reversals.
In conclusion, the Modified Super Trend with Chebyshev filter offers a significant improvement over the original Super Trend indicator. By incorporating the Chebyshev filter, this modified version effectively addresses the challenges of smoothing, delay, and noise reduction while minimizing false signals. The wide range of customizable settings allows traders to tailor the indicator to their specific needs, while the inclusion of early warning crosses provides valuable insight into potential trend reversals.
Ultimately, the Modified Super Trend with Chebyshev filter is an excellent tool for traders looking to enhance their trend identification and decision-making abilities. With its advanced features, this indicator can help traders navigate volatile markets with confidence, making more informed decisions based on accurate, timely information.

Customizable Moving Average RibbonThis indicator is a highly customizable moving average ribbon with some unique features.
This script can utilize multiple unique sources, including a non-repainting renko closing price. Renko charts focus solely on price movement and minimize the impacts of time and the extra noise time creates. Employing the renko close helps smooth out the MA ribbon. Insignificant price movements will not cause a change in the plotted lines of the indicator unless a new threshold is breached or a "brick" is created. This is highly useful for quickly identifying consolidation areas or overall flat price movement.
There are two methods for selecting the box size when utilizing the renko source. Box size is critical for the overall function and efficacy of the plots you will visually see with this indicator. Box size is set automatically using the Average True Range "ATR" or manually using the "Traditional" setting. The simplest way to determine a manual box size is to take the ATR of the given instrument and round it to the nearest decimal place. As an example, if the ATR for the asset is 0.18, you would round that number to 0.2 and utilize this as your traditional box size.
The MA ribbon contains eleven adjustable moving average lines. Users can choose to turn off as many as they would like. Users can also adjust the length of the individual moving averages and the source for all moving averages. There are nine types of moving averages to choose from for the ribbon. The MA options are:
Exponential Moving Average = 'EMA'
Double Exponential Moving Average= 'DEMA'
Triple Exponential Moving Average = 'TEMA'
Simple Moving Average = 'SMA'
Relative Moving Average = 'RMA'
Volume Weighted Moving Average = 'VWMA'
Weighted Moving Average = 'WMA'
Smoothed Simple Moving Average = 'SSMA'
Hull Moving Average = 'HULL'
We believe that the ribbons features, including the line color change, help quickly identify trends and give users optimum customization. Users can select from five different color schemes including:
Green/Red
Purple/White
White/Blue
Silver / Orange
Teal/ Orange

Market SnapshotGet a snapshot of the market with the index's last price, distance to selectable moving averages, and breadth data.
Choose to see data based on the Nasdaq or SPX, as well as net highs / lows for the Nasdaq, NYSE or combined.
Snapshot shows:
- Index's (SPX or Nasdaq's) last price
- Put call ratio
- % of stocks above the 50 day moving average for the index of your choice
- % of stocks above the 200 day moving average for the index of your choice
- Distance to or from two selectable moving averages. (negative number means price is below the moving average, positive means price is above)
Configurable options:
- Which moving averages to use
- Where to display the table on your chart
- Table size, background and text colors