7 Moving Averages [Plus]Moving Averages are price based, lagging (or reactive) indicators that display the average price of a security over a set period of time. A Moving Average is a good way to gauge momentum as well as to confirm trends, and define areas of support and resistance. Essentially, Moving Averages smooth out the “noise” when trying to interpret charts. Noise is made up of fluctuations of both price and volume. Because a Moving Average is a lagging indicator and reacts to events that have already happened, it is not used as a predictive indicator but as an interpretive one for confirmations and analysis.
Bollinger Bands (BB) are a widely popular technical analysis instrument created by John Bollinger. The BB consist of a band of three lines which are plotted in relation to security prices. The line in the middle is usually a Simple Moving Average (SMA) set to a period of 20 days (the type of trend line and period can be changed by the trader; however a 20 day moving average is by far the most popular). The SMA then serves as a base for the Upper and Lower Bands which are used as a way to measure volatility by observing the relationship between the Bands and price. Typically the Upper and Lower Bands are set to two standard deviations away from the SMA (The Middle Line); however the number of standard deviations can also be adjusted by the trader.
This script shows 6 moving averages and Bollinger Bands.
Features:
- Standard MA inputs.
- MA type.
- MA period.
- MA source.
- MA resolution (time frame).
- MA Offset.
- Forecasting : forcasted prices are calculated using our MAType and MASource for the MAPeriod.
- Trail: Show only candles not included in the MA calculation.
The color of MA1 depends on the chosen strategy, by default this is the 3EMA strategy. You can also select "Pivot Point Supertrend" or "Ichimoku Trend"
Added "Parabolic Stop and Reverse (PSAR)" . The PSAR is a time and price technical analysis tool primarily used to identify points of potential stops and reverses. In fact, the SAR in Parabolic SAR stands for "Stop and Reverse". The indicator's calculations create a parabola which is located below price during a Bullish Trend and above Price during a Bearish Trend.
Added "Linear Regression Channel" which can be correctly plotted on logarithmic charts. A linear regression channel consists of a median line with 2 parallel lines, above and below it, at the same distance. Those lines can be seen as support and resistance. The median line is calculated based on linear regression of the closing prices but the source can also be set to open, high or low. The height of the channel is based on the deviation of price to the median line. Extrapolating the channel forward can help to provide a bias and to find trading opportunities.
Tìm kiếm tập lệnh với "averages"

RSI Averages BandThis indicator shows a band of EMAs of the RSI(14). The timeframe for the indicator here is hourly on a 10m chart, a shorter timeframe will produce a choppier band of averages that will resemble the actual RSI at this timeframe more closely.
The averages are coloured according to whether they are higher or lower than the preceding value for that moving average.
The blue RSI line travelling OUTSIDE the band of averages will tend to show higher price momentum, while rejection of an entry/exit into the band can be a strong signal of continuation/reversal as appropriate.
Happy Trading :)

Adjustable Moving AveragesAdjustable Moving Averages
This script has fixed simple moving averages and fixed exponential moving averages function.
And script has 2 lines
1. Simpe Moving Average Line
2. Exponential Moving Average Line
You can change this 2 lines length and also you can change periods aswell.
With this; you can use any length of sma and ema with different periods without changing period.
For example this chart on 1 day period
And you can see 2 lines
Red Line: SMA100 and 4H perioıd
Yellow Line : EMA100 and 4H period

Multiple Time Frames Moving Averages (x3)This indicator is a set of 3 moving averages for which you can configure the type of the moving averages , their length , and of course the time frame . The moving averages you can choose from are:
- Simple Moving Average ( SMA )
- Exponential Moving Average ( EMA )
- Weighted Moving Average ( WMA )
- Running Moving Average (RMA)
- Hull Moving Average ( HMA )
- Volume Weighted Moving Average ( VWMA )
- Arnaud Legoux Moving Average ( ALMA )
The time-frames you can choose from - minutes (1, 3, 5, 15, 45), hours (1, 2, 3, 4, 12), days (1, 3), weekly or monthly .
Overall, it is a minimalistic indicator. No major improvements or trading logic like some of my other indicators, but I did make it slightly easier to use and visually appealing. The MAs' colors change from light to dark green/blue/red depending on the trend - bullish or bearish respectively. Initially, those were changing from green to red (based on direction) but it became a bit confusing when they started crossing each other. Anyway, feel free to change those colors to whatever you like.
If you have suggestions on how to improve this indicator or ideas about new ones, please drop me a line. Thanks.

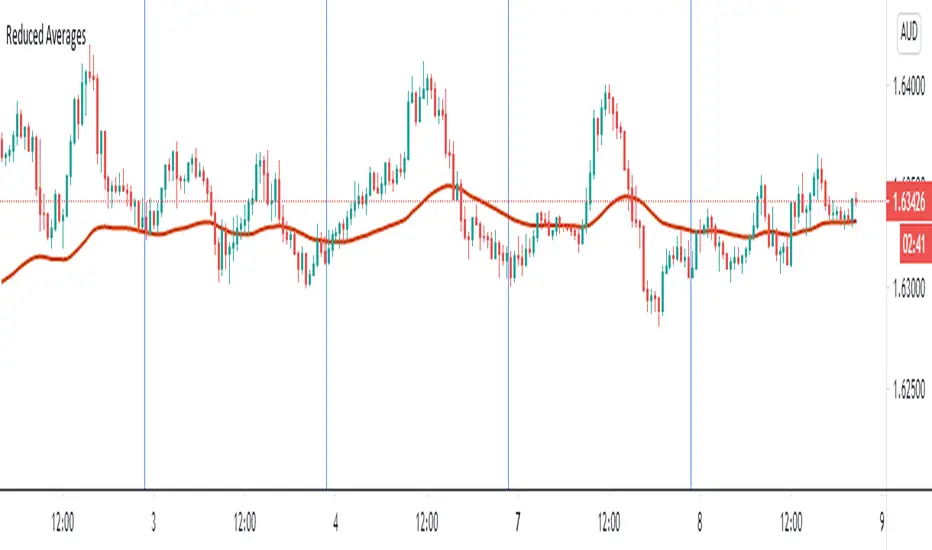
Reduced Averages (20,50,100,200)This script simply takes average value of exponential averages with a goal of reducing the noise on your chart. Many traders use a bunch of averages to identify a trend as they perfectly line up. Reduced Averages does just that. When price is close to a central line, you can comfortbly switch to another chart. When you see it deviating further away, you can enable 20 EMA, 50 EMA, 100 EMA and 200 EMA with a single click.
A Fibonacci Moving Averages Ribbon Using One PlotThe following script aims to visually reproduce a Fibonacci moving averages ribbon by only using one plot function, the period of the moving average is determined by a number of the Fibonacci sequence. This trick is made possible by computing the value of a moving average at time t with a period determined by a periodic Fibonacci sequence and using plot.style_circles as plot style.
Settings
From Fibonacci Number: Determine the n th Fibonacci number to be used as the lowest moving average period
To Fibonacci Number: Determine the n th Fibonacci number to be used as the highest moving average period, capped at 19 to avoid errors. If you still have errors lower the value.
Src : input series of the moving average.
Details
The first thing we must do is to compute a periodic (repeating) linear sequence n from the number in From Fibonacci Number to the number in To Fibonacci Number , then we get the n th Fibonacci number from the previous sequence using Binet's formula.
To get the moving average we first compute the fib period momentum of the cumulative sum of Src , where fib is the current number of our periodic Fibonnacci sequence, we then divide the result by fib .
If we zoom in we can indeed see that there is only one point per bar.
However, zooming out and using a different color for each point allows us to get something visually similar to a ribbon. Adding more plots would create a visually more accurate result.
This trick is not the most useful in the world, but let's imagine you want to plot a massive ribbon consisting of 1000 moving averages with periods that can be determined by a specific sequence, using this trick would allow you to have the effect of 1000 plots while keeping your script relatively efficient, altho ribbons consisting of lots of moving averages are rarely easy to visualize.

Difference of Exponentially Weighted AveragesImplementation of Difference of Exponentially Weighted Averages in Pine Script. It can generate a line that adjust to the overall trend of a graphic. The lines that are generated in a new plot are the the Difference of Exponentially Weighted Averages (blue) and it binarization over the previous values.
Exponentially Weighted Averages
This technique is used for generating smoother lines that adjust to a graphic. In finances, it is used to predict the overall trend of a graphic. The function that defines the EWA is the one bellow:
Vt = β V(t-1) + (1 - β) θt
Where:
β: Hyper-parameter that we have to adjust.
V(t-1): Value calculated for the previous element of the graphic.
θt: Current element of the graphic.
The calculus of differences consist in subtract to each value the previous values.

8 Separate Moving AveragesCOINBASE:BTCUSD Combine all your moving averages into one indicator.
This indicator allows for 8 separate moving averages, which can individually be configured as simple or exponential to any lengths you wish.
Allowing you to make room for other indicators.
Since is just moving averages, it can be used in any market.
Find me on twitter. Handle @Samih .

Fibonacci Based Three Simple Moving AveragesSimple Moving Averages 55
Simple Moving Averages 144
Simple Moving Averages 233

Fibonacci Based Three Simple Moving AveragesSimple Moving Averages 55
Simple Moving Averages 144
Simple Moving Averages 233

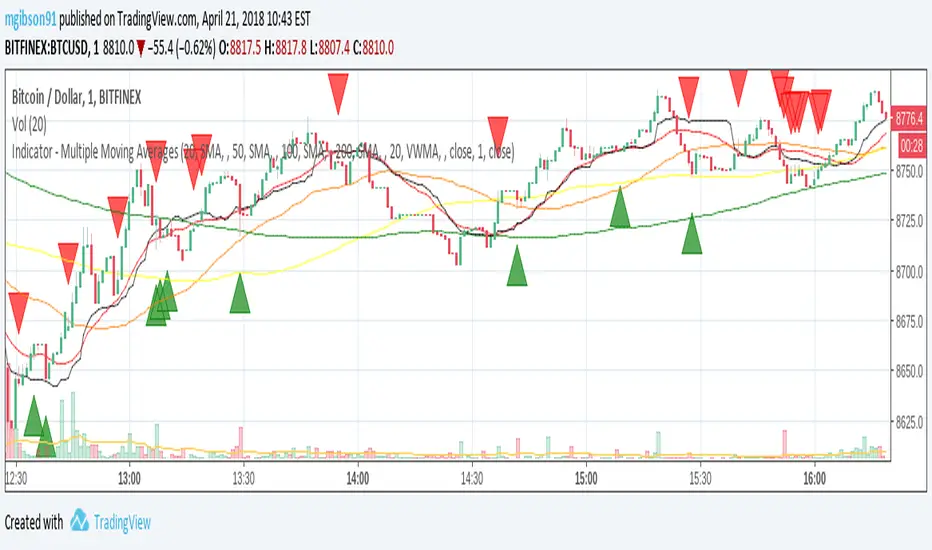
MG - Multiple Moving Averages & Candle Wick Alerts - 1.0Features:
- Each moving average has customizable length, type and source
- The ability to change the source of all moving averages with one input (changing an individual MA source will override the general for that MA)
- At a glance comparison of 20 SMA and 20 VWMA to gauge volume trend
- Wick alerts which can be toggled for each moving average.
- Bullish wick alerts are when the wick is the only part of the candle to drop below the moving average
- Bearish wick alerts are when the wick is the only part of the candle to reach above the moving average
- Simple candle closed alert if you want a notification, for example each hour.
Defaults: Four SMAs (20, 50, 100, 200) and a 20 VWMA .
Recommended Usage:
- Set the general source (sets the source of all moving averages) to 'low' when in an uptrend and 'high' in a downtrend to maximize Risk : Reward.
- Use Fibonacci levels, oscillators .etc for confluence
NOTE: The moving average component of this indicator is the same as the previous indicator ()
Triple Moving Averages++Extended version of Triple Moving Averages
Puts three moving averages on the chart can choose from
Simple Moving Average
Exponentially Weighted Moving Average
RSI Moving Average
Weighted Moving Average
Arnaud Legoux Moving Average
Volume Weighted Moving Average
Also includes options to hide each of the moving averages

Moving Averages 7 & 15 & 50 & 100 & 200 & 400we can use 7 moving averages for one indicator.
base moving averages are 7, 15, 50, 100, 200 and 400.
it can be used for determining of trend
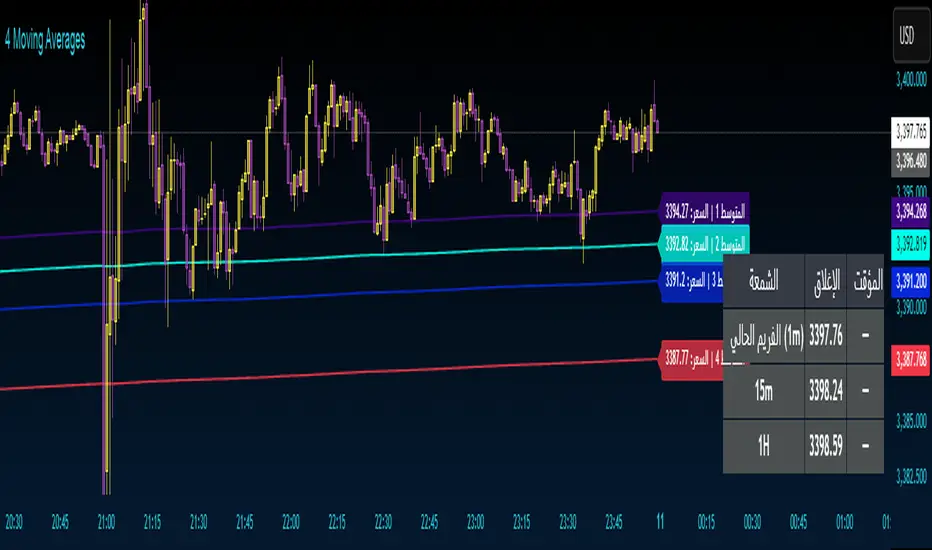
4 Moving Averages 4 Moving Averages
An indicator with four moving averages with ready-to-use settings. Use them as support and resistance.
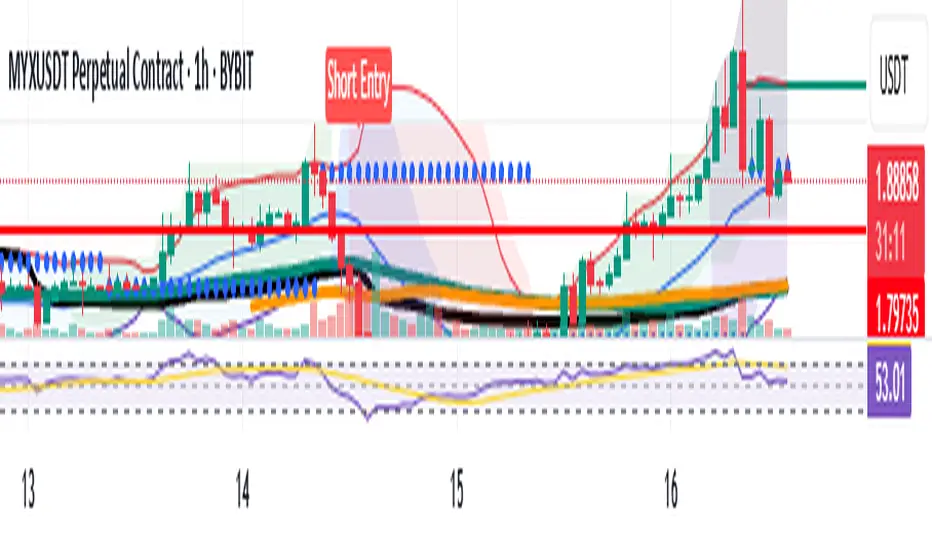
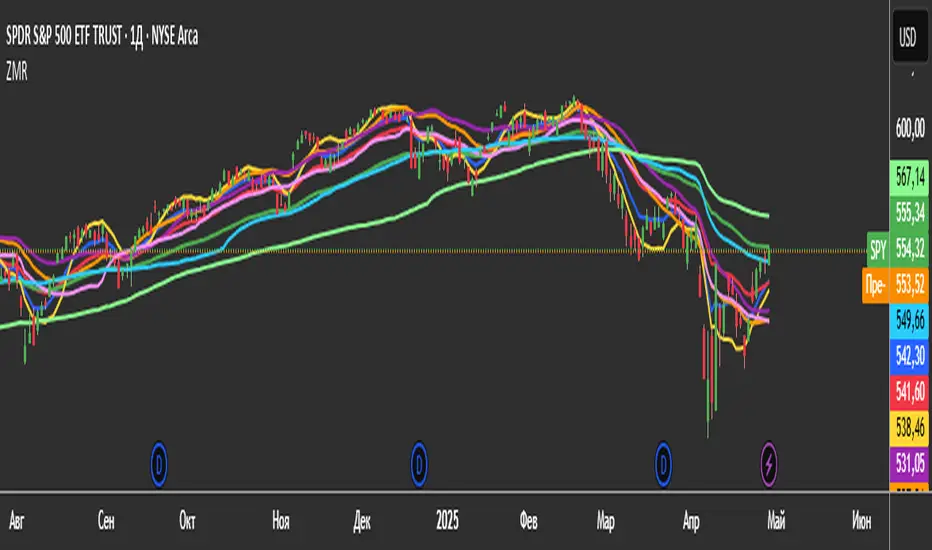
3 Zero Lag + 3 Moving Averages + 3 RVWAPThe "3 Zero Lag + 3 Moving Averages + 3 RVWAP" (ZMR) indicator combines three groups of tools for technical analysis.
1. Three Customizable Moving Averages (MAs):
Configuration for Each MA:
Choice of 7 types (SMA, EMA, WMA, HMA, VWMA, LSMA, SMMA).
Independent periods and price sources for each line.
Visualization:
MA1 (Blue), MA2 (Red), MA3 (Green).
2. Three Zero Lag EMAs (ZLEMA) with Individual Settings:
Lag Reduction: Corrects traditional EMA lag using:
Adjusted Price = 2 * Current Price - Price .
Flexibility:
Unique lengths (20, 50, 70) and individual price sources for each ZLEMA (HLC3, HL2, Close, etc.).
Colors:
ZLEMA1 (Yellow), ZLEMA2 (Orange), ZLEMA3 (Purple).
3. Three Rolling VWAPs with Custom Parameters:
Volume-Weighted Average Price (VWAP):
Calculated for three periods (20, 50, 100) with dedicated price sources for each VWAP.
Colors:
VWAP1 (Pink), VWAP2 (Light Blue), VWAP3 (Neon Green).
Moving Averages By MoneyTribe21This custom indicator displays three Smoothed Moving Averages (SMAs) designed to help traders identify market trends, potential reversals, and key support/resistance levels. It is ideal for trend-following strategies, momentum trading, and confirming price direction in various timeframes.
Three Smoothed Moving Averages to track short-term, mid-term, and long-term trends:
21-Day SMA: Captures short-term price momentum and trend direction.
50-Day SMA: Represents the mid-term trend, often used as dynamic support/resistance.
200-Day SMA: The long-term trend filter, commonly watched by institutional traders.
Fully Customizable Settings
Adjust period length for each SMA to fit your strategy.
Modify line colors, thickness, and styles for better visibility.
Enable/disable specific SMAs based on preference.
Works Across All Markets
Compatible with Forex, Stocks, Commodities, Crypto, and Indices.
Supports multiple timeframes (1M, 5M, 1H, Daily, Weekly, etc.)

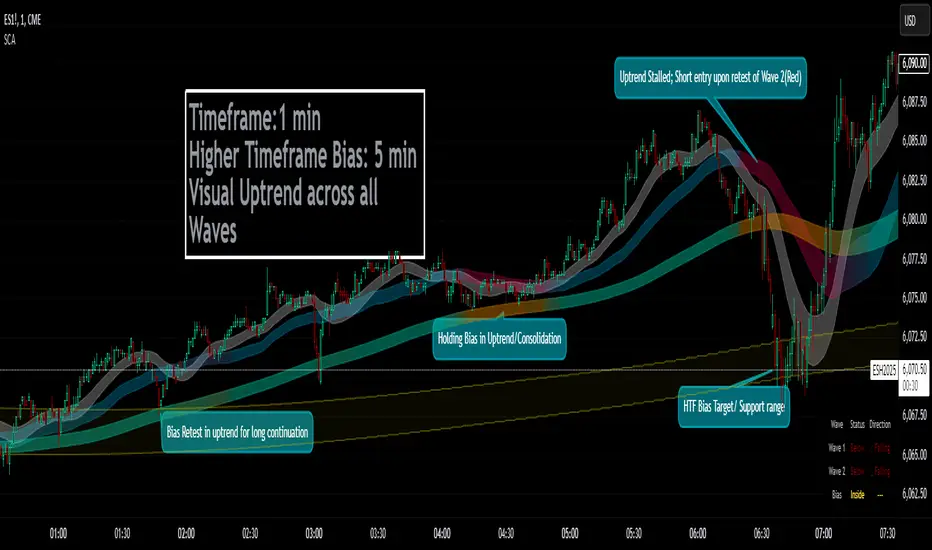
Smoothed Candle Averages- NovaTheMachineThis script utilizes a series of moving averages that the user is able to change as they see fit for their own use.
The averages plotted for the first 2 waves are the High-Low rays of the selected period of time with the chosen moving average style.
The Bias is the Heikin Ashi High-Low ray plotted over the chosen time period, while the Secondary Bias is a higher Timeframe Bias for the same period of time on a selected higher timeframe.
The visuals for each ray are able to be changed to either; lines, solid wave, or dynamic wave.
The Dynamic waves will change color according to the total dissection and utilize the Min-Max range selected as a weight for the strength of the trend. Thus providing an at-a-glance overview of the price relative to trend.
The key objective with this script is to gauge the longer term trend with the current price action, to establish patterns and determine strength of moves both away from and towards the moving average/bias.
When both waves are trending with the Bias, it can be reasoned that there is a strong trend established, when waves and Bias are mixed or trending sideways it can be reasoned there is a range forming or potential for a direction change. When price has broken the waves and biases we can reasonably assume that a new trend has been formed, using the waves and biases again to determine the strength and length of the trend.
The Table will display whether the current price is above or below each wave, and whether the price is continuing or retracing. The Signals plotted are used to help identify when price has broken a wave more swiftly.
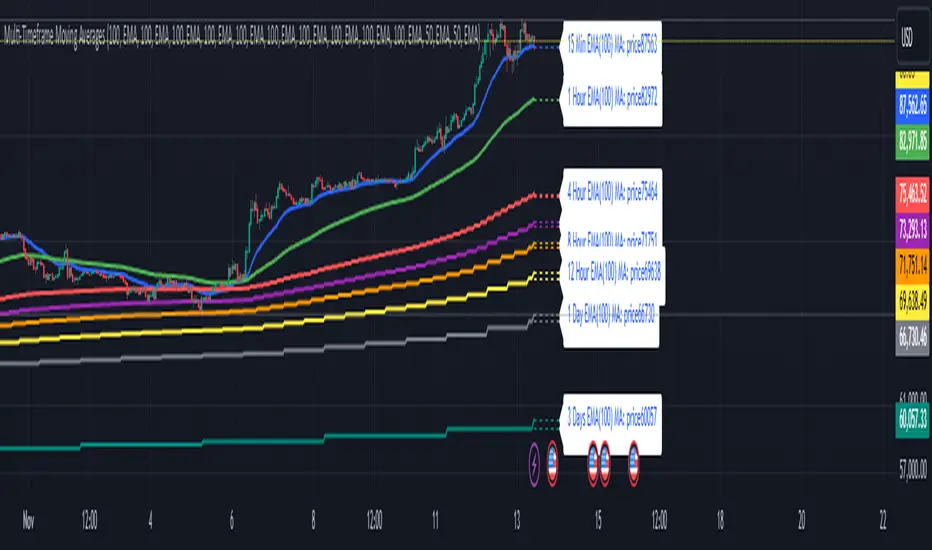
Multi-Timeframe Moving Averages by Skyito"Hope everyone likes this and finds it useful! This multi-timeframe moving average indicator provides a comprehensive view of moving averages from various timeframes directly on one chart. It’s designed to help traders analyze market trends and levels more effectively without constantly switching between charts.
Script Explanation: This indicator supports a range of moving average types, including SMA, EMA, HMA, WMA, VWMA, RMA, SSMA, and DEMA, allowing for flexibility in analysis. Each moving average is fully customizable by length and type for each timeframe, giving you control over how trends are represented.
The indicator includes timeframes such as 15 minutes, 1 hour, 4 hours, 6 hours, 8 hours, 12 hours, 1 day, 3 days, 5 days, 1 week, 3 weeks, and 1 month. Each moving average is displayed as a line with a small dashed extension, showing a label that contains the moving average’s timeframe, type, and current price level. The dark blue labels are slightly enlarged to enhance readability on the chart, making it easier to track important levels at a glance.
Use Case: This tool is ideal for traders looking to stay aware of trend levels across multiple timeframes on one chart. Adjusting the moving averages’ lengths and types enables customization for any strategy, while the label information provides an immediate understanding of the timeframe and trend context.
Enjoy the streamlined view and the added insights from multi-timeframe analysis!"
Hull Moving Averages 10, 20, 50, 100, 200This script generates multiple Hull Moving Averages (HMAs) on a trading chart, allowing for comprehensive trend analysis across different timeframes. Five HMAs with lengths of 10, 20, 50, 100, and 200 periods are plotted on the chart, providing insights into short, medium, and long-term market trends.
Each HMA can be customized with individual colors to easily distinguish between the different timeframes, helping traders visually track momentum changes and trend strength across these intervals. The Hull Moving Average is known for reducing lag compared to other moving averages, which makes it particularly useful for identifying turning points more accurately.
With this script:
You can adjust the colors of each HMA line individually, ensuring optimal visual differentiation.
You can analyze short-term trends with HMA 10 and HMA 20, medium-term trends with HMA 50, and long-term trends with HMA 100 and HMA 200.
The chart provides an at-a-glance view of multi-timeframe trends, making it useful for trading strategies that rely on crossovers or divergence patterns.
This tool is ideal for traders who want to identify trend direction, strength, and possible reversal points with minimal lag.
Multi-timeframe 24 moving averages + BB+SAR+Supertrend+VWAP █ OVERVIEW
The script allows to display up to 24 moving averages ("MA"'s) across 5 timeframes plus two bands (Bollinger Bands or Supertrend or Parabolic SAR or VWAP bands) each from its own timeframe.
The main difference of this script from many similar ones is the flexibility of its settings:
- Bulk enable/disable and/or change properties of several MAs at once.
- Save 3 of your frequently used templates as presets using CSV text configurations.
█ HOW TO USE
Some use examples:
In order to "show 31, 50, 200 EMAs and 20, 100, 200 SMAs for each of 1H, 4H, D, W, M timeframes using blue for short MA, yellow for mid MA and red for long MA" use the settings as shown on a screenshot below.
In order to "Show a band of chart timeframe MA's of lengths 5, 8, 13, 21, 34, 55, 100 and 200 plus some 1H, 4H, D and W MAs. Be able to quickly switch off the band of chart tf's MAs. For chart timeframe MA's only show labels for 21, 100 and 200 EMAs". You can set TF1 and TF2 to chart's TF and set you fib MAs there and configure fixed higher timeframe MAs using TF3, TF4 and TF5 (e.g. using 1H, D and W timeframes and using 1H 800 in place of 4H 200 MA). However, quicker way may be using CSV - the syntax is very simple and intuitive, see Preset 2 as it comes in the script. You can easily switch chart tf's band of MAs by toggling on/off your chart timeframe TF's (in our example, TF1 and TF2).
The settings are either obvious or explained in tooltips.
Note 1: When using group settings and CSV presets do not forget that individual setting affected will no have any effect. So, if some setting does not work, check whether it is overridden with some group setting or a CSV preset.
Note 2: Sometimes you can notice parts of MA's hanging in the air, not lasting up to the last bar. This is not a bug as explained on this screenshot:
█ FOR DEVELOPERS
The script is a use case of my CSVParser library, which in turn uses Autotable library, both of which I hope will be quite helpful. Autotable is so powerful and comprehensive that you will hardly ever wish to use normal table functions again for complex tables.
The indicator was inspired by Pablo Limonetti's url=https://www.tradingview.com/script/nFs56VUZ/]Multi Timeframe Moving Averages and Raging @RagingRocketBull's # Multi SMA EMA WMA HMA BB (5x8 MAs Bollinger Bands) MAX MTF - RRB

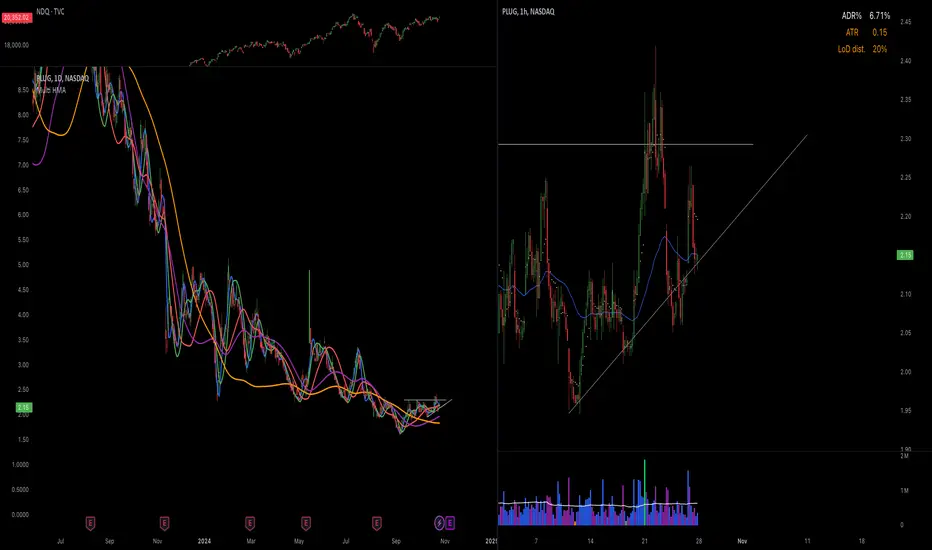
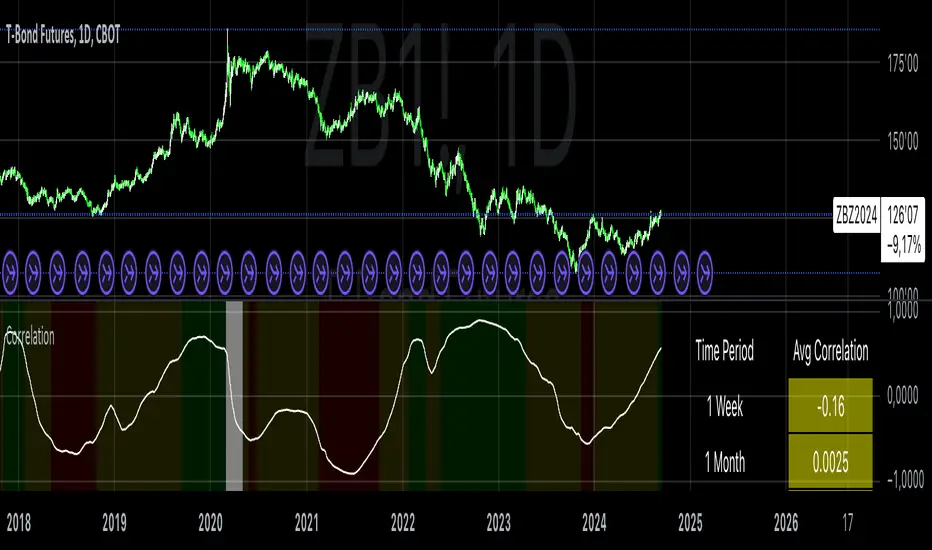
Correlation with AveragesThe "Correlation with Averages" indicator is designed to visualize and analyze the correlation between a selected asset's price and a base symbol's price, such as the S&P 500 (SPY). This indicator allows users to evaluate how closely an asset’s price movements align with those of the base symbol over various time periods, providing insights into market trends and potential portfolio adjustments.
Key Features:
Base Symbol and Correlation Period:
Users can specify the base symbol (default is SPY) and the period for correlation measurement (default is 252 trading days, approximating one year).
Correlation Calculation:
The indicator computes the correlation between the asset’s closing price and the base symbol’s closing price for the defined period.
Visualization:
The correlation value is plotted on the chart, with conditional background colors indicating the strength and direction of the correlation:
Red for negative correlation (below -0.5)
Green for positive correlation (above 0.5)
Yellow for neutral correlation (between -0.5 and 0.5)
Average Correlation Over Time:
Average correlations are calculated and displayed for various periods: one week, one month, one year, and five years.
A table on the chart provides dynamic updates of these average values with color-coded backgrounds to indicate correlation strength.
The Role of Correlation in Portfolio Management
Correlation is a crucial concept in portfolio management because it measures the degree to which two securities move in relation to each other. Understanding correlation helps investors construct diversified portfolios that balance risk and return. Here's why correlation is important:
Diversification:
By including assets with low or negative correlation in a portfolio, investors can reduce overall portfolio volatility and risk. For instance, if one asset is negatively correlated with another, when one performs poorly, the other may perform well, thus smoothing the overall returns.
Risk Management:
Correlation analysis helps in identifying the potential impact of one asset’s performance on the entire portfolio. Assets with high correlation can lead to concentrated risk, while those with low correlation offer better risk management.
Performance Analysis:
Correlation measures the degree to which asset returns move together. This can inform strategic decisions, such as whether to adjust positions based on expected market conditions.
Scientific References
Markowitz, H. M. (1952). "Portfolio Selection." Journal of Finance, 7(1), 77-91.
This foundational paper introduced Modern Portfolio Theory, highlighting the importance of diversification and correlation in reducing portfolio risk.
Jorion, P. (2007). Financial Risk Manager Handbook. Wiley.
This handbook provides an in-depth exploration of risk management techniques, including the use of correlation in portfolio management.
Elton, E. J., Gruber, M. J., Brown, S. J., & Goetzmann, W. N. (2014). Modern Portfolio Theory and Investment Analysis. Wiley.
This book elaborates on the concepts of correlation and diversification, offering practical insights into portfolio construction and risk management.
By utilizing the "Correlation with Averages" indicator, traders and portfolio managers can make informed decisions based on the relationship between asset prices and the base symbol, ultimately enhancing their investment strategies.
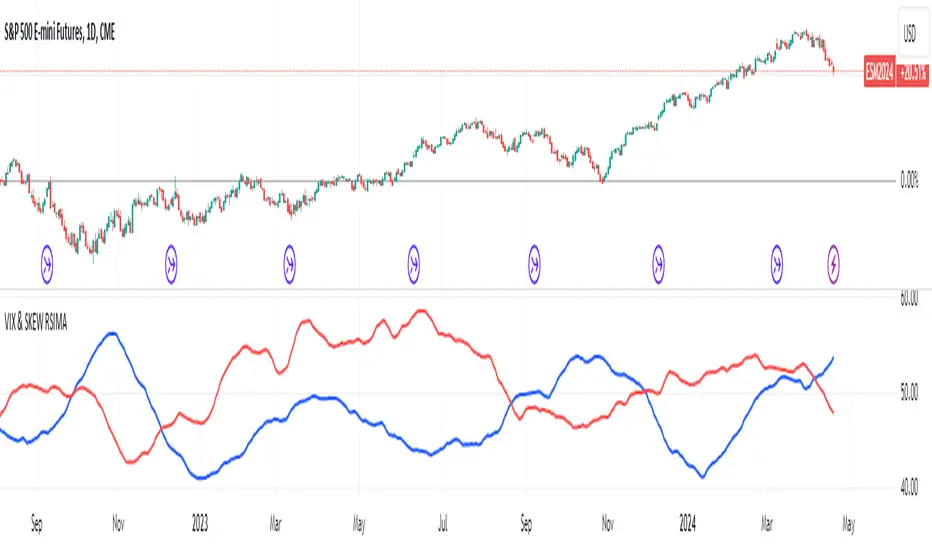
VIX and SKEW RSI Moving AveragesSKEW and VIX are both indicators of market volatility and risk, but they represent different aspects.
VIX (CBOE Volatility Index) :.
The VIX is a well-known indicator for predicting future market volatility. It is calculated primarily based on S&P 500 options premiums and indicates the degree of market instability and risk.
Typically, when the VIX is high, market participants view the future as highly uncertain and expect sharp volatility in stock prices. It is generally considered an indicator of market fear.
SKEW Index :.
The SKEW is a measure of how much market participants estimate the risk of future declines in stock prices, calculated by the CBOE (Chicago Board Options Exchange) and derived from the premium on S&P 500 options.
If the SKEW is high, market participants consider the risk of future declines in stock prices to be high. This generally indicates a "fat tail at the base" of the market and suggests that the market perceives it as very risky.
These indicators are used by market participants to indicate their concerns and expectations about future stock price volatility. In general, when the VIX is high and the SKEW is high, the market is considered volatile and risky. Conversely, when the VIX is low and the SKEW is low, the market is considered relatively stable and low risk.
Inverse Relationship between SKEW and VIX
It is often observed that there is an inverse correlation between SKEW and VIX. In general, the relationship is as follows
High VIX and low SKEW: When the VIX is high and the SKEW is low, the market is considered volatile while the risk of future stock price declines is low. This indicates that the market is exposed to sharp volatility, but market participants do not expect a major decline.
Low VIX and High SKEW: A low VIX and high SKEW indicates that the market is relatively stable, while the risk of future declines in stock prices is considered high. This indicates that the market is calm, but market participants are wary of a sharp future decline.
This inverse correlation is believed to be the result of market participants' psychology and expectations affecting the movements of the VIX and SKEW. For example, when the VIX is high, it is evident that the market is volatile, and under such circumstances, people tend to view the risk of a sharp decline in stock prices as low. Conversely, when the VIX is low, the market is considered relatively stable and the risk of future declines is likely to be higher.
SKEWVIX RSIMACROSS
In order to compare the trends of the SKEW and VIX, the 50-period moving average of the Relative Strength Index (RSI) was used for verification. the RSI is an indicator of market overheating or overcooling, and the 50-period moving average can be used to determine the medium- to long-term trend. This analysis reveals how the inverse correlation between the SKEW and the VIX relates to the long-term moving average of the RSI.
how to use
Moving Average Direction
Rising blue for VIXRSI indicates increased uncertainty in the market
Rising red for SKEWRSI indicates optimism and beyond
RSI moving average crossing
When the SKEW is dominant, market participants are considered less concerned about a black swan event (significant unexpected price volatility). This suggests that the market is stable and willing to take risks. On the other hand, when the VIX is dominant, it indicates increased market volatility. Investors are more concerned about market uncertainty and tend to take more conservative positions to avoid risk. The direction of the moving averages and the crossing of the moving averages of the two indicators can give an indication of the state of the market.
SKEW>VIX Optimistic/Goldilocks
VIX>SKEW Uncertainty/turbulence
The market can be judged as follows.
BestRegards
Triple Moving Averages (Gradient, Alarm & Multi TF)Triple Moving Averages
Features:
- 7 Different MA's (RMA, SMA, EMA, 'WMA', HMA, DEMA, EMA)
- Gradient coloring
- Multi timeframe
- Crossover alarm's and alarm delay function
- Forecasting (By removing the last bar in the MA period)
Moving Average to easely identify the trend and trend strength.
Gradient coloring and personal color preferences can be made.
Alert Delay System
When timing is essentially, this helps you get the alarm just in time.
Use it with the triggers ONLY ONCE PER BAR or ONLY ONCE. Then the alarm comes before the close, but you don't have to worry about it triggering just seconds after bar open :)
Default = 15m Recomended for 1h chart
Alarm's
Get the alarms before it's actually crossing or when it crosses
*This is not a selfmade indicator but simply merging from several indicators and added alert delay function and multi timeframe support
// Credits
- BigBitsIO Script : Scripting Tutorial 6 Triple Many Moving Averages Forecasting
- PineCoders Script : Color Gradient Framework PineCoders
