MoneyLine CypherMoneyLine Cipher - Adaptive Trend-Following Signal System
MoneyLine Cipher decodes market structure by fusing multiple technical indicators into a unified signal system with intelligent threshold adaptation. The indicator automatically adjusts its sensitivity based on trend conditions, making it harder to buy in downtrends and harder to sell in uptrends - letting winners run while protecting capital during adverse conditions.
━━━━━━━━━━━━━━━━━━━━━━━━━━━━━━━━━━━━━━━━━━━━━━━━━━━━
CORE COMPONENTS
The MoneyLine
The foundation is a 16-period linear regression line that serves as a dynamic mean. Price oscillates around this line, and the slope determines the visual color coding: green for bullish slope, red for bearish, yellow for neutral/flat conditions.
Grok Dynamic Bands
ATR-based envelope bands surround the MoneyLine. When ADX exceeds the threshold (default 22), the bands automatically widen using a multiplier that scales with trend strength. Base multiplier is 1.8x ATR, expanding up to 2.8x during strong trends. This prevents premature signals during powerful directional moves.
━━━━━━━━━━━━━━━━━━━━━━━━━━━━━━━━━━━━━━━━━━━━━━━━━━━━
TREND STATE ENGINE
MoneyLine Cipher classifies market conditions into five trend states using a combination of DI spread, ADX strength, and OBV confirmation.
The DI spread (Plus DI minus Minus DI) determines directional bias. When the spread exceeds +10 with ADX above 20 and bullish OBV confirmation, the market is classified as STRONG UPTREND. A spread between +5 and +10 indicates UPTREND. The reverse applies for downtrends. Spreads between -5 and +5 are NEUTRAL.
This trend state classification drives all dynamic threshold adjustments throughout the indicator.
━━━━━━━━━━━━━━━━━━━━━━━━━━━━━━━━━━━━━━━━━━━━━━━━━━━━
DYNAMIC THRESHOLDS
The key innovation of MoneyLine Cipher is that buy and sell thresholds adapt based on the current trend state.
Fisher Transform Thresholds
In a STRONG UPTREND, the Fisher buy threshold relaxes to -1.0 (easier to trigger) while the sell threshold tightens to 2.5 (harder to trigger). This lets you accumulate during strength and hold winners longer. In a STRONG DOWNTREND, the opposite occurs: buy threshold tightens to -2.5 (requiring extreme oversold) while sell threshold relaxes to 1.0 (quick exits). NEUTRAL conditions use base thresholds of -1.8 for buys and 1.8 for sells.
Aroon Thresholds
Aroon Up and Aroon Down thresholds follow the same adaptive logic. During uptrends, buy conditions become easier to meet while sell conditions become stricter. During downtrends, the system becomes defensive - demanding stronger oversold readings before allowing buys.
━━━━━━━━━━━━━━━━━━━━━━━━━━━━━━━━━━━━━━━━━━━━━━━━━━━━
SIGNAL GENERATION
Buy signals trigger when Fisher is below the dynamic buy threshold AND Aroon conditions are met, OR when price touches the lower band. Sell signals trigger when Fisher exceeds the dynamic sell threshold AND Aroon conditions are met, OR when price touches the upper band.
Signals are displayed as labels showing the entry price and buy count (e.g., "BUY 2/3: 89,450.00").
━━━━━━━━━━━━━━━━━━━━━━━━━━━━━━━━━━━━━━━━━━━━━━━━━━━━
CASCADE PROTECTION SYSTEM
Two layers of protection prevent catastrophic drawdowns during volatile conditions.
BBWP Freeze
Bollinger Band Width Percentile measures volatility expansion relative to recent history. When BBWP exceeds 92%, ALL buy signals are frozen. This prevents averaging down during volatility spikes that often precede major crashes. The info panel displays BBWP status with OK (green) or FROZEN (red).
Consecutive Buy Limit
The system tracks how many buys have occurred without an intervening sell. Default maximum is 3 consecutive buys. Once reached, additional buys are blocked until a sell resets the counter. This prevents unlimited averaging down into a falling knife. The info panel shows the current count (e.g., "2/3").
━━━━━━━━━━━━━━━━━━━━━━━━━━━━━━━━━━━━━━━━━━━━━━━━━━━━
EXTREME MOVE DETECTION
When price penetrates beyond the bands by more than 0.6x ATR (configurable), an EXTREME signal fires. These signals have special properties.
Extreme signals can bypass the normal cooldown period, allowing rapid response to flash crashes or spikes. They can optionally bypass the BBWP freeze (though the consecutive buy counter still applies). Extreme signals fire intra-bar when the threshold is hit, catching wick reversals before candle close.
EXTREME BUY labels appear in cyan. EXTREME SELL labels appear in fuchsia.
━━━━━━━━━━━━━━━━━━━━━━━━━━━━━━━━━━━━━━━━━━━━━━━━━━━━
RSI DIVERGENCE DETECTION
The indicator automatically detects four types of RSI divergence.
Regular Bullish Divergence occurs when price makes a lower low but RSI makes a higher low - suggesting weakening selling pressure and potential reversal up.
Hidden Bullish Divergence occurs when price makes a higher low but RSI makes a lower low - suggesting trend continuation in an uptrend.
Regular Bearish Divergence occurs when price makes a higher high but RSI makes a lower high - suggesting weakening buying pressure and potential reversal down.
Hidden Bearish Divergence occurs when price makes a lower high but RSI makes a higher high - suggesting trend continuation in a downtrend.
Divergences are marked with small diamond shapes: cyan for regular divergences, purple for hidden divergences. Optional lines connect the pivot points on the price chart.
━━━━━━━━━━━━━━━━━━━━━━━━━━━━━━━━━━━━━━━━━━━━━━━━━━━━
COOLDOWN SYSTEM
After any signal fires, a configurable cooldown period (default 5 bars) prevents signal spam. This can be configured to apply after buys only, sells only, or both. Extreme signals can optionally bypass cooldown for rapid response to major moves.
━━━━━━━━━━━━━━━━━━━━━━━━━━━━━━━━━━━━━━━━━━━━━━━━━━━━
VISUAL ELEMENTS
ADX Bar
A colored dot at the bottom of each candle indicates trend state. Lime for STRONG UPTREND, blue for UPTREND, orange for NEUTRAL, red for DOWNTREND, maroon for STRONG DOWNTREND, and white for RANGING (ADX below 15). All colors are configurable.
Signal Candles
When a buy or sell signal fires, the candle turns bright blue for easy identification.
Info Panel
A compact panel in the top-right displays real-time status: current trend state, divergence detection, BBWP percentage and status, buy counter, ADX reading, Aroon values, Fisher value, cooldown status, and current dynamic thresholds for both buy and sell.
━━━━━━━━━━━━━━━━━━━━━━━━━━━━━━━━━━━━━━━━━━━━━━━━━━━━
WEBHOOK ALERTS
MoneyLine Cipher outputs JSON-formatted webhook alerts compatible with automated trading systems. Each alert includes action (BUY/SELL), symbol, price, trigger type (INDICATOR, BAND_TOUCH, EXTREME, or EXTREME_INTRABAR), current trend state, consecutive buy count, and BBWP reading.
Separate alert conditions are available for regular buys, regular sells, extreme buys, extreme sells, BBWP freeze activation, BBWP unfreeze, and max consecutive buys reached.
━━━━━━━━━━━━━━━━━━━━━━━━━━━━━━━━━━━━━━━━━━━━━━━━━━━━
RECOMMENDED SETTINGS
The default settings are optimized for 5-minute cryptocurrency charts. Key adjustable parameters include Money Line Length (16), Base ATR Multiplier (1.8), Max Multiplier for strong trends (2.8), ADX threshold for band expansion (22), minimum ADX for strong trend classification (20), BBWP freeze level (92%), maximum consecutive buys (3), cooldown period (5 bars), and extreme penetration threshold (0.6x ATR).
━━━━━━━━━━━━━━━━━━━━━━━━━━━━━━━━━━━━━━━━━━━━━━━━━━━━
PHILOSOPHY
MoneyLine Cipher embodies a core trading principle: be aggressive when conditions favor you, defensive when they don't. By automatically adapting thresholds based on trend state and implementing multiple layers of capital protection, the indicator helps traders stay on the right side of the market while avoiding the common pitfalls of averaging down into crashes or selling too early in strong trends.
The name "Cipher" reflects the indicator's purpose: decoding the complex interplay of price, momentum, trend, and volatility into clear, actionable signals.
Tìm kiếm tập lệnh với "a股开盘前15分钟交易规则"

Trend Following $BTC - Multi-Timeframe Structure + ReversTREND FOLLOWING STRATEGY - MULTI-TIMEFRAME STRUCTURE BREAKOUT SYSTEM
Strategy Overview
This is an enhanced Turtle Trading system designed for cryptocurrency spot trading. It combines Donchian Channel breakouts with multi-timeframe structure filtering and ATR-based dynamic risk management. The strategy trades both long and short positions using reverse signal exits to maximize trend capture.
Core Features
Multi-Timeframe Structure Filtering
The strategy uses Swing High/Low analysis to identify market structure trends. You can customize the structure timeframe (default: 3 minutes) to match your trading style. Only enters trades aligned with the identified trend direction, avoiding counter-trend positions that often lead to losses.
Reverse Signal Exit System
Instead of using fixed stop-losses or time-based exits, this strategy exits positions only when a reverse entry signal triggers. This approach maximizes trend profits and reduces premature exits during normal market retracements.
ATR Dynamic Pyramiding
Automatically adds positions when price moves 0.5 ATR in your favor. Supports up to 2 units maximum (adjustable). This pyramid scaling enhances profitability during strong trends while maintaining disciplined risk management.
Complete Risk Management
Fixed position sizing at 5000 USD per unit. Includes realistic commission fees of 0.06% (Binance spot rate). Initial capital set at 10,000 USD. All backtest parameters reflect real-world trading conditions.
Trading Logic
Entry Conditions
Long Entry: Close price breaks above the 20-period high AND structure trend is bullish (price breaks above Swing High)
Short Entry: Close price breaks below the 20-period low AND structure trend is bearish (price breaks below Swing Low)
Position Scaling
Long positions: Add when price rises 0.5 ATR or more
Short positions: Add when price falls 0.5 ATR or more
Maximum 2 units including initial entry
Exit Conditions
Long Exit: Triggers when short entry signal appears (price breaks 20-period low + structure turns bearish)
Short Exit: Triggers when long entry signal appears (price breaks 20-period high + structure turns bullish)
Default Parameters
Channel Settings
Entry Channel Period: 20 (Donchian Channel breakout period)
Exit Channel Period: 10 (reserved parameter)
ATR Settings
ATR Period: 20
Stop Loss ATR Multiplier: 2.0
Add Position ATR Multiplier: 0.5
Structure Filter
Swing Length: 300 (Swing High/Low calculation period)
Structure Timeframe: 3 minutes
Adjust these based on your trading timeframe and asset volatility
Position Management
Maximum Units: 2 (including initial entry)
Capital Per Unit: 5000 USD
Visualization Features
Background Colors
Light Green: Bullish market structure
Light Red: Bearish market structure
Dark Green: Long position entry
Dark Red: Short position entry
Optional Display Elements (Default: OFF)
Entry and exit channel lines
Structure high/low reference lines
ATR stop-loss indicator
Next position add level
Entry/exit labels
Alert Message Format
The strategy sends notifications with the following format:
Entry: "5m Long EP:90450.50"
Add Position: "15m Add Long 2/2 EP:91000.25"
Exit: "5m Close Long Reverse Signal"
Where the first part shows your current chart timeframe and EP indicates Entry Price
Backtest Settings
Capital Allocation
Initial Capital: 10,000 USD
Per Entry: 5,000 USD (split into 2 potential entries)
Leverage: 0x (spot trading only)
Trading Costs
Commission: 0.06% (Binance spot VIP0 rate)
Slippage: 0 (adjust based on your experience)
Best Use Cases
Ideal Scenarios
Trending markets with clear directional movement
Moderate to high volatility assets
Timeframes from 1-minute to 4-hour charts
Best suited for major cryptocurrencies with good liquidity
Not Recommended For
Highly volatile choppy/ranging markets
Low liquidity small-cap coins
Extreme market conditions or black swan events
Usage Recommendations
Timeframe Guidelines
1-5 minute charts: Use for scalping, consider Swing Length 100-160
15-30 minute charts: Good for short-term trading, Swing Length 50-100
1-4 hour charts: Suitable for swing trading, Swing Length 20-50
Optimization Tips
Always backtest on historical data before live trading
Adjust swing length based on asset volatility and your timeframe
Different cryptocurrencies may require different parameter settings
Enable visualization options initially to understand entry/exit points
Monitor win rate and drawdown during backtesting
Technical Details
Built on Pine Script v6
No repainting - uses proper bar referencing with offset
Prevents lookahead bias with lookahead=off parameter
Strategy mode with accurate commission and slippage modeling
Multi-timeframe security function for structure analysis
Proper position state tracking to avoid duplicate signals
Risk Disclaimer
This strategy is provided for educational and research purposes only. Past performance does not guarantee future results. Backtesting results may differ from live trading due to slippage, execution delays, and changing market conditions. The strategy performs best in trending markets and may experience drawdowns during ranging conditions. Always practice proper risk management and never risk more than you can afford to lose. It is recommended to paper trade first and start with small position sizes when going live.
How to Use
Add the strategy to your TradingView chart
Select your desired timeframe (1m to 4h recommended)
Adjust parameters based on your risk tolerance and trading style
Review backtest results in the Strategy Tester tab
Set up alerts for automated notifications
Consider paper trading before risking real capital
Tags
Trend Following, Turtle Trading, Donchian Channel, Structure Breakout, ATR, Cryptocurrency, Spot Trading, Risk Management, Pyramiding, Multi-Timeframe Analysis
---
Strategy Name: Trend Following BTC
Version: v1.0
Pine Script Version: v6
Last Updated: December 2025

Scalping EMA9/15 This indicator is designed for high-accuracy intraday scalping based on a refined version of the popular EMA9–EMA15 trend-following technique.
It filters weak or premature entries by requiring a retest of the EMA zone before generating a Buy/Sell signal — drastically reducing false breakouts.

RSI Multi Levels kiawosch [TradingFinder] 7-14-42 Consolidation🔵 Introduction
The Relative Strength Index or RSI is a tool used to measure the speed and intensity of price movement, oscillating between zero and one hundred. It is commonly applied to identify strength or weakness in market momentum across different time intervals. Despite its simple formula and wide usage, the behavior of RSI within specific ranges often provides more precise information than traditional overbought and oversold levels.
The Multi RSI layout displays three RSI values with periods 7, 14 and 42. The seven period RSI plays the primary role in short term analysis. When this value enters predefined ranges, it shows highly consistent and interpretable behavior that can signal trend continuation, corrections or the start of a range structure. The other two values, RSI 14 and RSI 42, help reveal higher timeframe momentum and provide context for the depth and quality of price movement.
Three potential zones are defined, each representing a behavioral range. The position zones forms the basis for signal interpretation :
High Potential : 78 to 85 & 22 to 15
Mid Potential : 70 to 78 & 30 to 22
Low Potential : 58 to 62 & 42 to 38
These zones highlight areas where RSI reacts in specific ways to price movement. Entering the High Potential range usually aligns with new highs or lows in price and often precedes continuation after a correction. In contrast, reactions inside the Mid Potential range frequently appear during clean ranges or channel structures. This approach focuses on momentum quality and structural behavior rather than classic overbought and oversold thresholds.
In summary, the logic behind the signals follows three principles :
Trend continuation, When RSI 7 enters the High Potential zone and price prints a new high or low, continuation after a correction becomes the most likely outcome.
Reversal or slowdown, When RSI exits the High Potential zone while price is reaching a previous high or low, the probability of a short term reversal increases.
Range behavior, In clean ranges or channel structures, RSI 7 typically reacts inside the Mid Potential zone and produces consistent swing responses.
🔵 How to Use
This method is based on observing the repeating behavior of RSI within momentum zones and identifying moments when price continues after a shallow correction or, conversely, when signs of slowing and reversal appear. RSI 7 plays the main role since it gives the most sensitive response to short term price changes. Its entry into or exit from a potential zone, combined with the position of price relative to recent highs and lows, forms the core of the signal logic. RSI 14 and RSI 42 provide higher timeframe confirmation and help evaluate the broader strength or weakness behind each movement.
🟣 Trend continuation after entering the High Potential zone
When RSI 7 reaches the High Potential zone while price forms a new high or low, the probability of continuation becomes very high. The typical sequence includes a short correction in price and a retreat of RSI toward the Mid Potential zone. As long as price structure remains intact and RSI turns upward again, continuation becomes the most likely scenario. As shown in the charts, price often expands strongly after this type of correction and breaks the previous high.
🟣 Reversal or slowdown after exiting the High Potential zone
If RSI 7 enters the High Potential zone but then exits while price is interacting with a previous high or low, conditions for a short term reversal appear. This behavior is clear in the charts, where price hits a supply or demand area and RSI can no longer return to the upper zone. The drop in RSI reflects weakening momentum and, when accompanied by a confirming candle, increases the chance of a reversal or at least a temporary pause.
🟣 Strong reversal after hitting the Mid Potential zone during deeper corrections
Sometimes price enters a deeper corrective phase and RSI 7 moves into or through the Mid Potential zone. When this occurs near a previous low, it can mark the start of a significant reversal. The charts show this pattern clearly, where RSI turns upward while price reacts to support. If the other RSI values show relative alignment, the probability of a strong rebound increases. This signal is often seen after fast declines and can mark the beginning of a recovery wave.
🟣 Range structure and repetitive reactions inside the Mid Potential zone
When price enters a clean range or channel, the behavior of RSI 7 changes completely. In such conditions, RSI repeatedly reacts inside the Mid Potential zone. Each time price touches the upper or lower boundary of the range, RSI approaches the upper or lower part of this zone as well. The result is a sequence of predictable swing reactions, perfectly suitable for mean reversion strategies. Breakouts in these environments also tend to show higher failure rates.
🟣 Sharp reactions and fast reversals at extreme levels (RSI near 90 or below 10)
Although this approach is not based on classic overbought and oversold logic, extremely high or low RSI readings such as ninety often produce strong immediate reactions in price. These conditions usually occur after sudden spikes or emotional breakouts. As visible in the charts, RSI collapses quickly after reaching such extremes and price often reverses sharply. While not a core signal, these moments add meaningful context to momentum interpretation.
🔵 Settings
RSI Setting : This section allows enabling or disabling the three RSI values, adjusting their calculation length and customizing their colors. It is designed to help separate short, medium and longer term momentum visually on the chart.
Zones Setting : This section controls the display of momentum zones and the color applied to each area. Adjusting these colors or toggling them on and off helps the trader visually track the intensity and structure of momentum.
Levels Setting : This section allows editing the numeric boundaries of the levels or showing and hiding each one individually. These levels form the visual framework for interpreting RSI behavior within the defined momentum zones.
🔵 Conclusion
Examining RSI behavior across different momentum zones shows that entering these ranges creates relatively consistent patterns in price movement. Reaching the High Potential zone often corresponds to later stages of a trend, where price has the strength to continue after a brief correction and structure remains intact. In contrast, reactions within the Mid Potential zone occur more frequently when the market transitions into a range or a limited movement phase, where repetitive oscillations dominate.
Overall, observing RSI inside these zones helps distinguish between trending movement, corrective phases and range conditions with greater clarity. Entry or exit from each zone provides insight into the underlying strength or weakness of momentum and reveals where the market is positioned within its movement cycle. This perspective, based on momentum regions rather than traditional values alone, offers a more refined understanding of price behavior and highlights the likely direction of the next move.

Fractal Fade Pro IndicatorA revolutionary contrarian trading indicator that applies chaos theory, fractal mathematics, and market entropy to generate high-probability reverse signals. This indicator fades traditional technical signals, providing BUY signals when conventional indicators say SELL, and SELL signals when they say BUY.
Full Description:
Most traders follow the herd. QFCI does the opposite. It identifies when conventional technical analysis is about to fail by detecting mathematical patterns of exhaustion in market structure.
How It Works (Technical Overview):
The indicator combines three sophisticated mathematical approaches:
Fractal Dimension Analysis: Measures the "roughness" of price movements using fractal mathematics
Market Entropy Calculation: Quantifies the randomness and disorder in price returns using information theory
Phase Space Reconstruction: Analyzes price evolution in multi-dimensional state space from chaos theory
Signal Generation Process:
Step 1: Market Regime Detection
Chaotic Regime: High fractal complexity + rising entropy (avoid trading)
Trending Regime: Low fractal complexity + high phase space distance (fade breakouts)
Mean-Reverting Regime: Very low fractal complexity (fade extremes)
Step 2: Reverse Signal Logic
When traditional indicators would give:
BUY signal (breakout, oversold bounce, volatility spike) → QFCI shows SELL
SELL signal (breakdown, overbought rejection, volatility crash) → QFCI shows BUY
Step 3: Smart Signal Filtering
No consecutive same-direction signals
Adjustable minimum bars between signals
Multiple confirmation layers required
Unique Features:
1. Mathematical Innovation:
Original fractal dimension algorithm (not standard indicators)
Market entropy calculation from information theory
Phase space reconstruction from chaos theory
Multi-regime adaptive logic
2. Trading Psychology Advantage:
Contrarian by design - profits from market overreactions
Fades retail trader mistakes - enters when others are exiting
Reduces overtrading - strict signal frequency controls
3. Clean Visual Interface:
Only BUY/SELL labels - no chart clutter
Clear directional arrows - immediate signal recognition
Built-in alerts - never miss a trade
Recommended Settings:
Default (Balanced Approach):
Fractal Depth: 20
Entropy Period: 200
Min Bars Between Signals: 100
Aggressive Trading:
Fractal Depth: 10-15
Entropy Period: 100-150
Min Bars Between Signals: 50-75
Conservative Trading:
Fractal Depth: 30-40
Entropy Period: 300-400
Min Bars Between Signals: 150-200
Optimal Timeframes:
Primary: Daily, Weekly (best performance)
Secondary: 4-Hour, 12-Hour
Can work on: 1-Hour (with adjusted parameters)
How to Use:
For Beginners:
Apply indicator to chart
Use default settings
Wait for BUY/SELL labels
Enter on next candle open
Use 2:1 risk/reward ratio
Always use stop losses
For Advanced Traders:
Adjust parameters for your trading style
Combine with support/resistance levels
Use volume confirmation
Scale in/out of positions
Track performance by regime
Risk Management Guidelines:
Position Sizing:
Conservative: 1-2% risk per trade
Moderate: 2-3% risk per trade
Aggressive: 3-5% risk per trade (not recommended)
Stop Loss Placement:
BUY signals: Below recent swing low or -2x ATR
SELL signals: Above recent swing high or +2x ATR
Take Profit Targets:
Primary: 2x risk (minimum)
Secondary: Previous support/resistance
Tertiary: Trailing stops after 1.5x risk
IMPORTANT RISK DISCLOSURE
This indicator is for educational and informational purposes only. It is not financial advice. Past performance does not guarantee future results. Trading involves substantial risk of loss and is not suitable for every investor. The risk of loss in trading can be substantial. You should therefore carefully consider whether such trading is suitable for you in light of your financial condition.

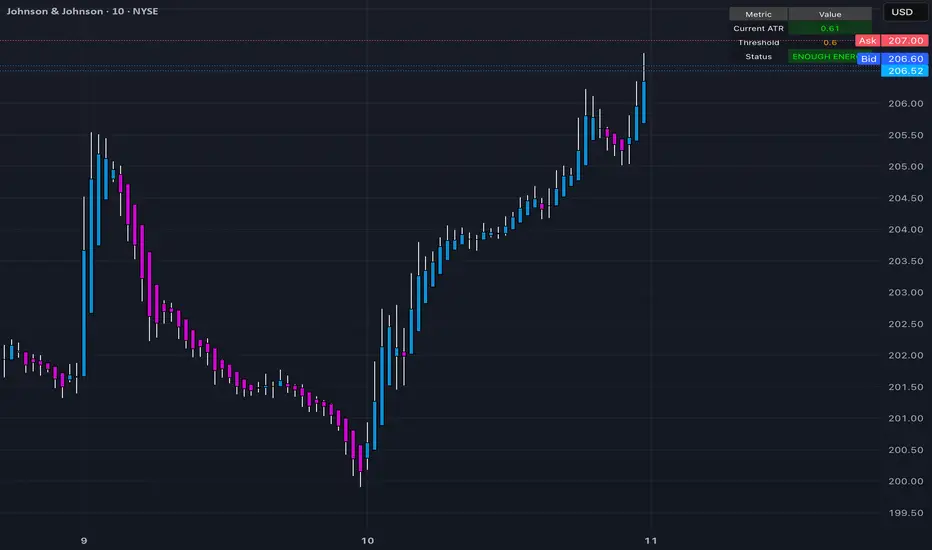
Trinity ATR Real Move DetectorTrinity ATR Real Move Detector
This ATR Energy Table indicator is one of the simplest yet most powerful filters you can have on a chart when trading short-dated or 0DTE options or swing trades on any timeframe from 1-minute up to 4-hour. Its entire job is to answer the single most important question in intraday and swing trading: “Does the underlying actually have enough short-term explosive energy right now to make a directional position worth the theta and the spread, or is this just pretty candles that will die in ten minutes?”
Most losing 0DTE and short-dated option trades happen because people buy or sell direction on a “nice-looking” breakout or pullback while the underlying is actually in low-energy grind mode. The premium decays faster than the move develops, and you lose even when you’re “right” on direction. This little table stops that from ever happening again.
Here’s what it does in plain English:
Every bar it measures two things:
- The current ATR on whatever timeframe you are using (1 min, 3 min, 5 min, 10 min, etc.). This tells you how big the average true range of the last 14 bars has been — in other words, how violently the stock or index is actually moving right now.
- The daily ATR (14-period on the daily chart). This is your benchmark for “normal” daily movement over the last two–three weeks.
It then multiplies the daily ATR by a small number (the multiplier you set) and compares the two. If the short-term ATR is bigger than that percentage of the daily ATR, the table turns bright green and says “ENOUGH ENERGY”. If not, it stays red and says “NOT ENOUGH”.
Why this works so well:
- Real explosive moves that carry for 0DTE and 1–3 DTE options almost always show a short-term ATR spike well above the recent daily average. Quiet grind moves never do.
- The comparison is completely adaptive — on a high-vol day the threshold automatically rises, on a low-vol day it automatically drops. You never have to guess if “2 points on SPY is big today”.
- It removes emotion completely. You simply wait for green before you even think about clicking buy or sell on an option.
Key settings and what to do with them:
- Energy Multiplier — this is the only number you ever touch. It is expressed as a decimal (0.15 = 15 % of the daily ATR). Lower = more signals, higher = stricter and higher win rate. The tooltip gives you the exact sweet-spot numbers for every popular timeframe (0.09 for 1-minute scalping, 0.13 for 3-minute, 0.14–0.16 for 5-minute, 0.15–0.19 for 10-minute, etc.). Just pick your timeframe once and type the number — done forever.
- ATR Length — leave it at 14. That’s the standard and works perfectly.
- Table Position — move the table to wherever you want on the chart (top-right, bottom-right, bottom-left, top-left).
- Table Size — make the text Tiny, Small, Normal or Large depending on how much screen space you have.
How this helps you make money and stop losing it:
- On most days you will see red 80–90 % of the time — that’s good! It is forcing you to sit on your hands instead of overtrading low-energy chop that eats premium.
- When it finally flips green you know institutions are actually pushing size right now — follow-through probability jumps from ~40 % to 65–75 % depending on the stock and timeframe.
- You stop buying calls on every green candle and puts on every red candle. You only strike when the market is genuinely “awake”.
- Over a week you take dramatically fewer trades, but your win rate and average winner size go way up — which is exactly how consistent intraday option profits are made.
In short, this tiny table is the closest thing to an “edge on/off switch” that exists for short-dated options. Red = preserve capital and go do something else. Green = pull the trigger with confidence. Use it religiously and you’ll immediately feel the difference in your P&L.
(5+15+60min+1D)EMA20+Y'SH/L+count简介: 这是一个专为 5分钟图表 (5min Chart) 日内交易者设计的综合辅助工具。它结合了多周期趋势均线、美股核心交易时段的时间周期计数以及关键流动性位置(前一日高低点)的智能突破监测。该脚本针对美股个股及 24/7 交易的 BTC/ETH 进行了优化,强制锁定纽约时间进行运算。
核心功能:
1. 多周期 EMA 监控系统 (MTF EMAs)
5min EMA20 (蓝色):日内短期趋势核心线(默认开启)。
60min EMA20 (绿色):小时级别趋势参考(默认开启)。
15min EMA20 (红色) & 1D EMA20 (橙色):可选开启,用于捕捉更大周期的支撑阻力。
特点:所有均线采用最细线宽,平滑显示,右上角表格实时展示当前价格。
2. 美股时段 Bar Count 计数器
时间锚定:以纽约时间 (New York Time) 09:30 开盘为起点(Bar 0)。
显示规则:仅在 K 线底部显示 偶数 序号 (0, 2, 4, 6 ...),直至第 82 根 K 线停止。
关键时间窗 (Time Pivots):
Bar 18 (约 NY 10:55) 和 Bar 40 (约 NY 12:45) 会被自动高亮。
字体变为 蓝色粗体,且对应 K 线实体变为蓝色,提示潜在的变盘或宏观流动性注入时刻。
3. 智能 PDH/PDL 射线 (Smart Rays)
精确锚点:前一日高点 (PDH) 和低点 (PDL) 的射线不是从开盘画起,而是从昨日形成高低点的具体时间点射出,精确还原价格行为。
自动阻断 (Breakout Logic):一旦当前价格触碰或突破该射线,射线将自动停止延伸,直观展示“阻力/支撑已失效”。
自动清理:每日自动清除旧线,仅保留当天的参考线,保持图表整洁。
4. 视觉优化
每日分割线:自动绘制灰色虚线分隔交易日。
图表限制:脚本仅在 5分钟图表上可见,切换周期自动隐藏,避免干扰大周期分析。
设置说明:
可在设置面板中自由开关各周期 EMA 的显示。
可开关底部的计数数字显示。
English Version (for TradingView Publishing)
Title: 5min Intraday Precision Toolkit: MTF EMAs + NY Session Count + Smart Rays
Introduction: This is a comprehensive auxiliary tool designed specifically for 5-minute chart intraday traders. It combines multi-timeframe trend EMAs, time cycle counting based on the US Session, and smart breakout monitoring for key liquidity levels (Previous Day High/Low). Optimized for US Equities and Crypto (BTC/ETH) using New York Time.
Key Features:
1. Multi-Timeframe EMA System
5min EMA20 (Blue): Core short-term intraday trend (On by default).
60min EMA20 (Green): Hourly trend reference (On by default).
15min EMA20 (Red) & 1D EMA20 (Orange): Optional overlays for higher timeframe support/resistance.
Visuals: All EMAs are rendered with fine lines for a clean look, accompanied by a top-right dashboard table.
2. NY Session Bar Count
Time Anchor: Starts counting from 09:30 New York Time (Bar 0).
Display Logic: Displays only EVEN numbers (0, 2, 4...) at the bottom of the bars, stopping at count 82.
Time Pivots:
Bar 18 (~10:55 NY) and Bar 40 (~12:45 NY) are highlighted.
Labels turn Bold Blue, and the specific candles are colored Blue to indicate potential reversal or liquidity injection times.
3. Smart PDH/PDL Rays
Precise Origin: Rays for Previous Day High (PDH) and Previous Day Low (PDL) originate from the exact timestamp they were created yesterday, not just the daily open.
Breakout Stop Logic: Rays automatically stop extending once price touches or breaks them, clearly indicating that the level has been tested.
Auto-Clean: Automatically removes old rays from previous days to keep the chart clean.
4. Visual Optimization
Daily Separators: Automatic vertical dotted lines marking new days.
Visibility: All elements are hidden on non-5m charts to prevent clutter.
Settings:
Toggle visibility for individual EMAs.
Toggle visibility for the bottom bar counter.

FANBLASTERFANBLASTER
Methodology & Rules (Live Trading Version)
Purpose
Catch the exact moment the market flips from chop into a high-conviction trending move using a clean, stacked Fib EMA ribbon + volatility + volume confirmation.
Core Idea
When the 5-8-13-21-34-55 EMA stack suddenly “fans out” in perfect order with significant separation, a real trend is being born. Most retail traders chase late – FANBLASTER alerts you on the very first bar the fan opens.
What Triggers a “FAN BLAST” Alert
Perfect EMA Alignment
Bullish: 5 > 8 > 13 > 21 > 34 > 55
Bearish: 5 < 8 < 13 < 21 < 34 < 55
(Has to flip from NOT aligned on the previous bar → aligned on this bar)
Significant Separation
Distance between EMA 5 and EMA 55 ≥ 1.3 × ATR(14)
(1.3 is the ES sweet spot – filters fake little wiggles)
Trend Strength Confirmation
ADX(14) ≥ 22
(Ensures the move isn’t just noise; ES trends explode while ADX is still climbing)
Volume Conviction
Current volume > 1.4 × 20-period EMA of volume
(Real moves have real participation)
When ALL FOUR conditions are true on the same bar → you get the green or red circle + phone alert.
How to Trade It (Live Rules)
Alert fires → look at the chart immediately
If price is pulling back to the 8 or 13 EMA in the direction of the fan → enter on touch or close above/below
Initial stop: opposite side of the fan (below the 55 for longs, above the 55 for shorts)
Target: 2–4 R minimum, trail with the 21 or 34 once in profit
No alert = stay flat. This is a “trend birth” sniper, not a scalping tool.
Best Instruments & Timeframes (2025)
ES & NQ futures
2 min, 5 min, 15 min (all work with the exact same settings)
Works on MES/MNQ too (same params)
Bottom Line
FANBLASTER sits silent 90 % of the day and only screams when the market is actually about to run 20–100+ points.
One alert = one high-probability trend. That’s it.
Lock it, load it, and let the phone do the hunting.
Good luck, stay disciplined, and stack those points.
— Your edge is now live.

Liquidity Heatmap [Eˣ]💧 Liquidity Heatmap - Free Indicator
Overview
The Liquidity Heatmap reveals where stop losses are clustered in the market - the hidden liquidity zones that smart money targets. This indicator automatically identifies Buy-Side Liquidity (BSL) above price and Sell-Side Liquidity (SSL) below price, showing you exactly where institutional traders are likely to hunt for stops before major moves.
━━━━━━━━━━━━━━━━━━━━━━━━━━━━
🎯 What This Indicator Does
Identifies Liquidity Zones:
• Buy-Side Liquidity (BSL) - Stop losses from SHORT positions clustered above price
• Sell-Side Liquidity (SSL) - Stop losses from LONG positions clustered below price
• Automatically clusters nearby levels into high-probability zones
• Shows liquidity strength (1-5+) - higher numbers = more stops = bigger target
• Removes swept liquidity in real-time as price takes out stops
Visual Display:
• 🔴 Red Zones Above Price = Buy-Side Liquidity (shorts' stops)
• 🟢 Green Zones Below Price = Sell-Side Liquidity (longs' stops)
• Thicker/Darker Zones = Higher liquidity concentration
• BSL/SSL Labels = Show exact strength count
• Triangle Markers = Liquidity sweep alerts (when price takes stops)
Smart Features:
• Auto-removes old liquidity (customizable lookback period)
• Clusters nearby levels to reduce noise
• Tracks liquidity strength and age
• Updates in real-time as new swing points form
• Alerts when major liquidity zones are swept
━━━━━━━━━━━━━━━━━━━━━━━━━━━━
📊 How To Use This Indicator
Understanding Liquidity Concepts
What is Liquidity?
Liquidity refers to clusters of stop loss orders sitting in the market. These stops represent:
• Long traders' stop losses (below support) = Sell-Side Liquidity
• Short traders' stop losses (above resistance) = Buy-Side Liquidity
Why Does This Matter?
• Institutions NEED liquidity to fill large orders
• Price often "sweeps" liquidity zones before reversing
• Major liquidity = major target for smart money
• Understanding liquidity = understanding market maker behavior
The Liquidity Cycle:
1. Retail traders place stops at obvious levels (swing highs/lows)
2. Smart money identifies these clusters
3. Price is pushed to sweep the stops (liquidity grab)
4. Institutions fill their orders with this liquidity
5. Price reverses in the opposite direction
━━━━━━━━━━━━━━━━━━━━━━━━━━━━
💡 Trading Strategies
Strategy 1: Liquidity Sweep Reversals
Best For: Swing trading, catching reversals
Timeframes: 15min, 1H, 4H, Daily
Entry Setup:
1. Identify strong Sell-Side Liquidity (SSL) zone below price
2. Wait for price to sweep down into the SSL zone
3. Look for rejection/reversal candle pattern (pin bar, engulfing)
4. Enter LONG after sweep and reversal confirmation
5. Stop loss: Below the swept liquidity zone
6. Target: Opposite liquidity zone or key resistance
Why It Works: Smart money sweeps stops to fill buy orders, then pushes price higher
Example:
• SSL zone at $45,000 with strength 3
• Price drops to $44,950, sweeps the SSL
• Strong bullish reversal candle forms
• Enter long at $45,100
• Target: BSL zone at $47,000
Strategy 2: Liquidity-to-Liquidity Runs
Best For: Day trading, scalping
Timeframes: 5min, 15min, 1H
Entry Setup:
1. Price sweeps Sell-Side Liquidity below and reverses up
2. Identify Buy-Side Liquidity zone above
3. Enter LONG targeting the BSL zone above
4. Exit near/at the BSL zone (don't wait for sweep)
5. Stop loss: Below recent swing low
Why It Works: Price moves from liquidity pool to liquidity pool
Variation - Reverse for Shorts:
• BSL sweep above → Look for SSL zone below
• Enter short targeting lower liquidity
Strategy 3: Liquidity Avoidance (Stop Placement)
Best For: Improving win rate on existing strategies
Timeframes: All
Rules:
1. NEVER place stops exactly at obvious liquidity zones
2. Place stops beyond the liquidity zone with buffer
3. Or place stops before the liquidity zone (tighter, riskier)
4. Monitor liquidity strength - avoid zones with strength 3+
Why It Works: Market makers hunt obvious stop clusters
Example:
• Trading long, swing low at $100 (SSL zone, strength 4)
• Bad: Stop at $99.50 (will get swept)
• Better: Stop at $98.50 (beyond the liquidity)
• Alternative: Stop at $100.50 (tighter, before sweep zone)
Strategy 4: Confluence Trading
Best For: High probability setups
Timeframes: 1H, 4H, Daily
Entry Setup:
1. Find liquidity zone that aligns with:
• Major support/resistance level
• Fibonacci retracement (0.618, 0.786)
• Trendline
• Round psychological number ($50,000, $2,000, etc)
2. Wait for sweep of this high-confluence zone
3. Enter on reversal with multiple confirmations
4. Larger position size justified by confluence
Why It Works: Multiple factors = institutional interest = higher probability
━━━━━━━━━━━━━━━━━━━━━━━━━━━━
⚙️ Settings Explained
Core Settings
Swing Detection Length (Default: 10)
• Number of bars left/right to identify swing highs and lows
• Lower values (5-8): More sensitive, more liquidity zones, more noise
• Higher values (12-20): Less sensitive, only major swings, cleaner chart
• Recommended: 8-10 for intraday, 10-15 for swing trading
Liquidity Lookback Bars (Default: 100)
• How many historical bars to track liquidity zones
• Lower values (50-75): Shows only recent liquidity
• Higher values (100-200): Shows longer-term liquidity clusters
• Zones older than this are automatically removed
• Recommended: 100-150 for most timeframes
Zone Proximity % (Default: 0.5)
• Percentage threshold to group nearby levels into single zone
• Lower values (0.2-0.4): Keeps levels separate, more zones
• Higher values (0.6-1.0): Aggressive clustering, fewer zones
• Recommended: 0.4-0.6 for crypto, 0.3-0.5 for forex, 0.5-0.8 for stocks
Visualization Settings
Show Buy-Side Liquidity
• Toggle ON/OFF red zones above price
• Turn OFF if only interested in downside liquidity
Show Sell-Side Liquidity
• Toggle ON/OFF green zones below price
• Turn OFF if only interested in upside liquidity
Show Liquidity Labels
• Toggle BSL/SSL labels with strength numbers
• Turn OFF for cleaner chart appearance
• Keep ON to see exact liquidity strength
Display Style
• Boxes: Filled rectangular zones (best for visualizing strength)
• Lines: Horizontal dashed lines (minimal, clean look)
• Both: Boxes + Lines (maximum visibility)
Color Intensity
• Low: 85% transparency (subtle, less distracting)
• Medium: 75% transparency (balanced visibility)
• High: 65% transparency (bold, maximum visibility)
━━━━━━━━━━━━━━━━━━━━━━━━━━━━
📱 Info Panel Guide
Located in the top-right corner, the info panel provides real-time liquidity statistics:
Buy-Side Zones
• Count of active BSL zones above current price
• Higher number = More upside targets for price
Sell-Side Zones
• Count of active SSL zones below current price
• Higher number = More downside targets for price
Total Zones
• Combined count of all active liquidity
• Useful for gauging overall market structure
Nearest BSL
• Distance in % to closest Buy-Side Liquidity above
• Example: +2.5% means BSL is 2.5% above current price
• Quick reference for next upside target
Nearest SSL
• Distance in % to closest Sell-Side Liquidity below
• Example: -1.8% means SSL is 1.8% below current price
• Quick reference for next downside target
Liquidity Bias
• ⬆️ Bullish : More BSL than SSL (upside targets dominate)
• ⬇️ Bearish : More SSL than BSL (downside targets dominate)
• ↔️ Balanced: Equal liquidity on both sides (range-bound)
━━━━━━━━━━━━━━━━━━━━━━━━━━━━
🎓 Understanding Liquidity Strength
What Do The Numbers Mean?
Strength 1 : Single swing point
• Light liquidity, minor target
• Can be ignored in trending markets
• Useful in ranging/choppy conditions
Strength 2-3 : Moderate liquidity cluster
• Multiple nearby swing points merged
• Decent target for intraday moves
• Watch for potential sweeps
Strength 4-5 : Strong liquidity cluster
• Major cluster of stops
• High-probability target for institutions
• Expect reactions when swept
Strength 6+ : Extreme liquidity pool
• Massive stop cluster (rare)
• Critical zone - high probability of sweep
• Often marks major support/resistance
• Ideal for confluence setups
━━━━━━━━━━━━━━━━━━━━━━━━━━━━
📱 Alert Setup
This indicator includes 2 powerful alert types:
1. Buy-Side Liquidity Sweep
• Triggers when price sweeps BSL zone above
• Shows potential bullish reversal opportunity
• Often precedes upward continuation after sweep
2. Sell-Side Liquidity Sweep
• Triggers when price sweeps SSL zone below
• Shows potential bearish reversal opportunity
• Often precedes downward continuation after sweep
To Set Up Alerts:
1. Click the "Alert" button (clock icon) in TradingView
2. Condition: Select "Liquidity Heatmap"
3. Choose alert type: BSL Sweep or SSL Sweep
4. Configure notification method (push, email, webhook)
5. Click "Create"
Pro Tip: Set alerts for both BSL and SSL sweeps to catch opportunities in both directions
━━━━━━━━━━━━━━━━━━━━━━━━━━━━
💎 Pro Tips & Best Practices
✅ DO:
• Wait for confirmation - Don't enter immediately on sweep, wait for reversal pattern
• Combine with trend - SSL sweeps in uptrends = higher probability longs
• Check multiple timeframes - 1H liquidity + 4H liquidity = strongest zones
• Monitor strength - Focus on zones with strength 3+
• Use proper risk management - Liquidity sweeps can go further than expected
• Watch for re-sweeps - Sometimes liquidity zones get swept multiple times
• Consider volume - High volume sweeps = stronger reversal potential
⚠️ DON'T:
• Don't fade strong trends - In strong trends, sweeps often continue rather than reverse
• Don't overtrade - Not every sweep is a tradeable setup
• Don't ignore context - Check broader market conditions and news
• Don't use alone - Combine with price action, support/resistance, and other analysis
• Don't place stops at liquidity - Your stops will be hunted
• Don't expect perfection - Some sweeps fail, some zones never get hit
🎯 Best Timeframes:
• Scalping: 5min, 15min (fast moves, frequent sweeps)
• Day Trading: 15min, 1H (balanced view)
• Swing Trading: 1H, 4H, Daily (major liquidity zones)
• Position Trading: 4H, Daily, Weekly (institutional liquidity)
🔥 Best Markets:
• Crypto (high volatility, frequent liquidity grabs)
• Forex (EUR/USD, GBP/USD - liquid pairs)
• Futures (ES, NQ, CL - high liquidity contracts)
• Stocks (large caps with high volume)
⏰ Best Times:
• Market opens (high volatility = liquidity hunting)
• Before/after major news events
• Session overlaps (London/NY for forex)
• First hour and last hour of trading
━━━━━━━━━━━━━━━━━━━━━━━━━━━━
🚀 What Makes This Different?
Unlike basic pivot indicators, the Liquidity Heatmap:
• Institutional Perspective - Shows where smart money hunts stops
• Dynamic Clustering - Automatically groups nearby levels for clarity
• Strength Tracking - Not just where, but HOW MUCH liquidity exists
• Auto-Cleanup - Removes swept and old liquidity automatically
• Visual Clarity - Instant understanding of market structure
• Actionable - Clear targets and reversal zones for trading
• Real-Time Updates - Adapts as market structure evolves
Based On Professional Concepts:
• Order flow analysis
• Market maker behavior
• Institutional trading techniques
• Liquidity engineering principles
━━━━━━━━━━━━━━━━━━━━━━━━━━━━
📈 Common Liquidity Patterns
Pattern 1: The Double Sweep
• Price sweeps SSL below, reverses up
• Price sweeps BSL above, reverses down
• Back to original range
• Trading: Fade the second sweep for mean reversion
Pattern 2: The Cascade
• Multiple SSL zones stacked below
• Price sweeps first zone, continues to next
• Chain reaction of stop losses triggering
• Trading: Ride the momentum to lowest zone
Pattern 3: The Fake-Out
• Price approaches liquidity but doesn't quite sweep
• Reverses before hitting the zone
• "Scared money" didn't wait for full sweep
• Trading: Wait for actual sweep, don't anticipate
Pattern 4: The Absorption
• Price sweeps major liquidity zone (strength 5+)
• No reversal, just consolidation
• Institutions absorbed all liquidity
• Trading: Wait for breakout direction, likely continuation
━━━━━━━━━━━━━━━━━━━━━━━━━━━━
📈 Upgrade Your Trading Arsenal
This free indicator gives you institutional-level liquidity analysis. Want more?
🔥 Check out my premium scripts for:
• Automated entry signals with liquidity confirmation
• Multi-timeframe liquidity analysis
• Advanced stop loss management that avoids liquidity zones
• Backtested strategies with performance tracking
• Custom alerts for high-probability setups
• And much more...
👉 Visit my profile to see all available tools!
━━━━━━━━━━━━━━━━━━━━━━━━━━━━
📝 Important Notes
• Liquidity analysis is one piece of the puzzle - use with other analysis methods
• Not all liquidity zones get swept - some remain untouched
• Market conditions change - adapt your strategy accordingly
• Always use proper position sizing and risk management
• Liquidity sweeps can be violent - use appropriate stop losses
• Practice on demo accounts before trading with real capital
• Past liquidity patterns don't guarantee future price action
Disclaimer: This indicator is for educational purposes. Trading involves risk. Always do your own research and never risk more than you can afford to lose.
━━━━━━━━━━━━━━━━━━━━━━━━━━━━
🙏 Support This Work
If you find this indicator valuable:
• ⭐ Give it a thumbs up
• 💬 Share your best liquidity sweep trades in the comments
• 🔔 Follow for more free professional-grade tools
• 🚀 Share with traders who need to understand liquidity
Got questions? Drop a comment and I'll help you master liquidity trading!
━━━━━━━━━━━━━━━━━━━━━━━━━━━━
Developed with ❤️ for traders who want to think like institutions
━━━━━━━━━━━━━━━━━━━━━━━━━━━━
Version History
• v1.0 - Initial release with dynamic liquidity detection and clustering

AKP Momentum TableThe table give at one glance the RSI,ADX and Relative Strength values on the 15 min,125 min, Daily,Weekly and Monthly timeframes to help identify the stocks with strong momentum securities. The Table is movable at various parts of the screen from a drop down menu and the values of RSI,ADX and RS period can also be changes.Enjoy!

Trinity Extreme Rope Trend [SamRecio]Original work and credit to Sam and you can find him here (www.tradingview.com) and his script available from
Why change... just some small tweaks to enhance and here is the summary of Changes vs the Original Script...
- Rope smoothing algorithm kept 100% identical (same brilliant “pull-only-when-exceeded-ATR” logic)
- Direction logic unchanged (still instantly resets on price crossing the rope)
- Old linebr + fill method completely replaced with clean box.new() consolidation zones
- Added “BR” breakout arrows (cyan triangle up for bullish break, magenta triangle down for bearish break)
- Arrows fire only on the exact breakout bar — zero repaint, zero lag
- Added subtle yellow background tint while in consolidation
- Full alertconditions + optional popup/sound on every BR break
- Auto-finalizes and cleans boxes properly, no chart clutter
Primary rule: only take trades on the BR arrow in the direction of the higher-timeframe trend.
Typical high-probability setups
- Wait for yellow rope + box → price consolidates
- BR arrow appears and candle closes outside the box → enter immediately
- Stop-loss just inside the box (opposite side)
- Target: next major liquidity pool, previous swing high/low, or 3–5R
Suggested Settings for Different Styles/Timeframes
Scalping (1 m – 5 m)
ATR Length: 10–12
ATR Multiplier: 1.0–1.3
→ tighter rope = faster signals, perfect for killing 1-minute London/NY open raids
Intraday aggression (5 m – 15 m)
ATR Length: 14 (default)
ATR Multiplier: 1.5–1.8
→ this is the sweet spot most funded traders use right now
Swing / position trading (1 H – 4 H)
ATR Length: 20–30
ATR Multiplier: 2.0–2.5
→ wider rope filters out noise, only catches the real macro moves
Daily / weekly bias filter
ATR Length: 50
ATR Multiplier: 3.0–4.0
→ use only the rope color (ignore boxes) to determine weekly bias — cyan = only longs all week, magenta = only shorts
That’s it. Drop the script, choose one of the above settings based on your style, turn on alerts, and hope you enjoy what is a wonderful script.

猛の掟・本物っぽいTradingViewスクリーナー 完全版//@version=5
indicator("猛の掟・本物っぽいTradingViewスクリーナー 完全版", overlay=false, max_labels_count=500, max_lines_count=500)
// =============================
// 入力パラメータ
// =============================
emaLenShort = input.int(5, "短期EMA", minval=1)
emaLenMid = input.int(13, "中期EMA", minval=1)
emaLenLong = input.int(26, "長期EMA", minval=1)
macdFastLen = input.int(12, "MACD Fast", minval=1)
macdSlowLen = input.int(26, "MACD Slow", minval=1)
macdSignalLen = input.int(9, "MACD Signal", minval=1)
macdZeroTh = input.float(0.2, "MACDゼロライン近辺とみなす許容値", step=0.05)
volMaLen = input.int(5, "出来高平均日数", minval=1)
volMinRatio = input.float(1.3, "出来高倍率(初動判定しきい値)", step=0.1)
volStrongRatio = input.float(1.5, "出来高倍率(本物/三点シグナル用)", step=0.1)
highLookback = input.int(60, "直近高値の参照本数", minval=10)
pullbackMin = input.float(5.0, "押し目最小 ", step=0.5)
pullbackMax = input.float(15.0, "押し目最大 ", step=0.5)
breakLookback = input.int(15, "レジブレ後とみなす本数", minval=1)
wickBodyMult = input.float(2.0, "ピンバー:下ヒゲが実体の何倍以上か", step=0.5)
// 表示設定
showPanel = input.bool(true, "下パネルにスコアを表示する")
showTable = input.bool(true, "右上に8条件チェック表を表示する")
// =============================
// 基本指標計算
// =============================
emaShort = ta.ema(close, emaLenShort)
emaMid = ta.ema(close, emaLenMid)
emaLong = ta.ema(close, emaLenLong)
= ta.macd(close, macdFastLen, macdSlowLen, macdSignalLen)
volMa = ta.sma(volume, volMaLen)
volRatio = volMa > 0 ? volume / volMa : 0.0
recentHigh = ta.highest(high, highLookback)
prevHigh = ta.highest(high , highLookback)
pullbackPct = recentHigh > 0 ? (recentHigh - close) / recentHigh * 100.0 : 0.0
// ローソク足要素
body = math.abs(close - open)
upperWick = high - math.max(open, close)
lowerWick = math.min(open, close) - low
// =============================
// A:トレンド条件
// =============================
emaUp = emaShort > emaShort and emaMid > emaMid and emaLong > emaLong
goldenOrder = emaShort > emaMid and emaMid > emaLong
aboveEma2 = close > emaLong and close > emaLong
trendOK = emaUp and goldenOrder and aboveEma2
// =============================
// B:MACD条件
// =============================
macdGC = ta.crossover(macdLine, macdSignal)
macdNearZero = math.abs(macdLine) <= macdZeroTh
macdUp = macdLine > macdLine
macdOK = macdGC and macdNearZero and macdUp
// =============================
// C:出来高条件
// =============================
volInitOK = volRatio >= volMinRatio // 8条件用
volStrongOK = volRatio >= volStrongRatio // 三点シグナル用
volumeOK = volInitOK
// =============================
// D:ローソク足パターン
// =============================
isBullPinbar = lowerWick > wickBodyMult * body and lowerWick > upperWick and close >= open
isBullEngulf = close > open and open < close and close > open
isBigBullCross = close > emaShort and close > emaMid and open < emaShort and open < emaMid and close > open
candleOK = isBullPinbar or isBullEngulf or isBigBullCross
// =============================
// E:価格帯(押し目&レジブレ)
// =============================
pullbackOK = pullbackPct >= pullbackMin and pullbackPct <= pullbackMax
isBreakout = close > prevHigh and close <= prevHigh
barsSinceBreak = ta.barssince(isBreakout)
afterBreakZone = barsSinceBreak >= 0 and barsSinceBreak <= breakLookback
afterBreakPullbackOK = afterBreakZone and pullbackOK and close > emaShort
priceOK = pullbackOK and afterBreakPullbackOK
// =============================
// 8条件の統合
// =============================
allRulesOK = trendOK and macdOK and volumeOK and candleOK and priceOK
// =============================
// 最終三点シグナル
// =============================
longLowerWick = lowerWick > wickBodyMult * body and lowerWick > upperWick
macdGCAboveZero = ta.crossover(macdLine, macdSignal) and macdLine > 0
volumeSpike = volStrongOK
finalThreeSignal = longLowerWick and macdGCAboveZero and volumeSpike
buyConfirmed = allRulesOK and finalThreeSignal
// =====================================================
// スクリーナー用スコア(0=なし, 1=猛, 2=確)
// =====================================================
score = buyConfirmed ? 2 : (allRulesOK ? 1 : 0)
// 色分け(1行で安全な書き方)
col = score == 2 ? color.new(color.yellow, 0) : score == 1 ? color.new(color.lime, 0) : color.new(color.gray, 80)
// -----------------------------------------------------
// ① 視覚用:下パネルのカラム表示
// -----------------------------------------------------
plot(showPanel ? score : na,
title = "猛スコア(0=なし,1=猛,2=確)",
style = plot.style_columns,
color = col,
linewidth = 2)
hline(0, "なし", color=color.new(color.gray, 80))
hline(1, "猛", color=color.new(color.lime, 60))
hline(2, "確", color=color.new(color.yellow, 60))
// -----------------------------------------------------
// ② Data Window 用出力(スクリーナー風)
// -----------------------------------------------------
plot(score, title="Score_0なし1猛2確", color=color.new(color.white, 100), display=display.data_window)
plot(allRulesOK ? 1 : 0, title="A_Trend_OK", color=color.new(color.white, 100), display=display.data_window)
plot(macdOK ? 1 : 0, title="B_MACD_OK", color=color.new(color.white, 100), display=display.data_window)
plot(volumeOK ? 1 : 0, title="C_Volume_OK", color=color.new(color.white, 100), display=display.data_window)
plot(candleOK ? 1 : 0, title="D_Candle_OK", color=color.new(color.white, 100), display=display.data_window)
plot(priceOK ? 1 : 0, title="E_Price_OK", color=color.new(color.white, 100), display=display.data_window)
plot(longLowerWick ? 1 : 0, title="F_Pin下ヒゲ_OK", color=color.new(color.white, 100), display=display.data_window)
plot(macdGCAboveZero ? 1 : 0, title="G_MACDゼロ上", color=color.new(color.white, 100), display=display.data_window)
plot(volumeSpike ? 1 : 0, title="H_出来高1.5倍", color=color.new(color.white, 100), display=display.data_window)
// -----------------------------------------------------
// ③ 右上に「8条件チェック表」を表示(最終バーのみ)
// -----------------------------------------------------
var table info = table.new(position.top_right, 2, 9,
border_width = 1,
border_color = color.new(color.white, 60))
// 1行分の表示用ヘルパー
fRow(string label, bool cond, int row) =>
color bg = cond ? color.new(color.lime, 70) : color.new(color.red, 80)
string txt = cond ? "達成" : "未達"
// 左列:条件名
table.cell(info, 0, row, label, text_color = color.white, bgcolor = color.new(color.black, 0))
// 右列:結果(達成 / 未達)
table.cell(info, 1, row, txt, text_color = color.white, bgcolor = bg)
if barstate.islast and showTable
// ヘッダー(2列とも黒背景)
table.cell(info, 0, 0, "猛の掟 8条件チェック", text_color = color.white, bgcolor = color.new(color.black, 0))
table.cell(info, 1, 0, "", text_color = color.white, bgcolor = color.new(color.black, 0))
fRow("A: トレンド", trendOK, 1)
fRow("B: MACD", macdOK, 2)
fRow("C: 出来高", volumeOK, 3)
fRow("D: ローソク", candleOK, 4)
fRow("E: 押し目/レジブレ", priceOK, 5)
fRow("三点: ヒゲ", longLowerWick, 6)
fRow("三点: MACDゼロ上", macdGCAboveZero,7)
fRow("三点: 出来高1.5倍", volumeSpike, 8)

Vib ORB Range (Free)Vib ORB Range (Free) plots the Opening Range High and Low for the session based on a user-defined start time and duration.
This tool is designed for traders who want a clean, no-noise display of the ORB zone without extra indicators or automation.
Features:
Customizable Opening Range start time
Customizable Opening Range duration
Automatically resets daily
Plots ORB High, ORB Low, and optional ORB Midline
Shaded range zone for improved clarity
Works on all timeframes and markets
How to Use:
Set the ORB start time (default 9:30 New York)
Set the ORB duration (default 15 minutes)
The indicator will draw the ORB zone once the range completes
Use the outlines or shaded zone to visually identify potential breakout areas
This free tool is intended as a simple, reliable ORB visualizer without alerts, filters, or strategy logic.

Multi SMAOverlay indicator that displays a complete set of Simple Moving Averages in a single script: SMA 5, 10, 15, 20, 25, 30, 35, 40, 45, 50, 100, and 200.
It includes a selectable source (close, hl2, etc.) and two toggles to quickly show/hide short-term SMAs (5–50) and long-term SMAs (100–200). Ideal for analyzing trend direction, moving average alignment, and dynamic support/resistance zones directly on the price chart.

ICT Order Block Identifier [Eˣ]📦 Order Block Identifier
Overview
The Order Block Identifier automatically detects and displays institutional order blocks on your charts - zones where banks, hedge funds, and market makers place their orders. This indicator helps identify where institutions are likely to defend their positions and where price often finds support or resistance, based on ICT (Inner Circle Trader) concepts.
━━━━━━━━━━━━━━━━━━━━━━━━━━━━
🎯 What This Indicator Does
Detects Order Blocks:
• 🟢 Bullish Order Blocks (OB+) - Last bearish candle before strong bullish move
• 🔴 Bearish Order Blocks (OB-) - Last bullish candle before strong bearish move
• Automatically identifies institutional buying/selling zones
• Tracks up to 30 order blocks simultaneously
• Works on all timeframes and instruments
Smart Features:
• Auto-Timeframe Adjustment - Optimizes detection for 1min to Weekly charts
• Active Block Highlighting - Shows which OB price is approaching
• Touch Tracking - Knows when blocks are tested
• ATR-Based Detection - Adapts to each instrument's volatility
• Strength Filtering - Choose Low/Medium/High to control sensitivity
━━━━━━━━━━━━━━━━━━━━━━━━━━━━
📚 Understanding Order Blocks
What Are Order Blocks?
Order blocks are the "footprints" left behind by institutional traders (banks, hedge funds, market makers) when they enter large positions. Because institutions can't fill massive orders at once without moving the market, they:
1. Place orders gradually over time
2. Leave zones where their buy/sell orders are concentrated
3. Defend these zones when price returns
4. Create reliable support and resistance levels
The ICT Concept:
Developed by Michael Huddleston (Inner Circle Trader), order block theory states that:
• The last opposite-colored candle before a strong move contains institutional orders
• Price often returns to test these zones before continuing
• These zones act as strong support (bullish OB) or resistance (bearish OB)
• Smart money defends their positions at these levels
Why Order Blocks Work:
• Unfilled Orders: Institutions may still have pending orders in the block
• Position Defense: They protect their entries by adding to positions
• Stop Placement: Retail stops cluster near these zones (liquidity for institutions)
• Market Structure: Price respects these levels due to order flow dynamics
━━━━━━━━━━━━━━━━━━━━━━━━━━━━
🟢 Bullish Order Blocks Explained
How They Form:
1. Price is consolidating or declining
2. Institutions begin accumulating (buying)
3. A strong bullish move erupts
4. The last bearish candle before this move = Bullish Order Block
5. This candle represents where institutions were buying aggressively
Why The Last Bearish Candle?
• Institutions absorbed all selling pressure at this level
• Their buy orders filled as price was declining
• When price returns, they defend this zone with more buying
• It becomes a demand zone / support level
Trading Bullish Order Blocks:
Setup:
• Wait for price to retrace back to bullish OB (green box)
• Look for rejection/reversal pattern (pin bar, engulfing, etc.)
• Enter long when price bounces from the OB zone
• Stop loss: Below the order block
• Target: Recent high or opposite order block
Best Scenarios:
• OB aligns with other support (trendline, fibonacci, round number)
• First touch of OB (unmitigated) has highest probability
• Occurs during high-volume sessions (London/NY)
• Trend is bullish on higher timeframe
Example Trade:
• Bullish OB forms at $50,000 (last red candle before rally)
• Price rallies to $52,000 then retraces
• Price drops back to $50,100 (touching OB)
• Bullish pin bar forms on the OB
• Enter long at $50,200, stop at $49,800
• Target: $52,000+ (previous high)
━━━━━━━━━━━━━━━━━━━━━━━━━━━━
🔴 Bearish Order Blocks Explained
How They Form:
1. Price is consolidating or rising
2. Institutions begin distributing (selling)
3. A strong bearish move erupts
4. The last bullish candle before this move = Bearish Order Block
5. This candle represents where institutions were selling aggressively
Why The Last Bullish Candle?
• Institutions absorbed all buying pressure at this level
• Their sell orders filled as price was rising
• When price returns, they defend this zone with more selling
• It becomes a supply zone / resistance level
Trading Bearish Order Blocks:
Setup:
• Wait for price to retrace back to bearish OB (red box)
• Look for rejection/reversal pattern (shooting star, bearish engulfing)
• Enter short when price rejects from the OB zone
• Stop loss: Above the order block
• Target: Recent low or opposite order block
Best Scenarios:
• OB aligns with other resistance (trendline, fibonacci, round number)
• First touch of OB (unmitigated) has highest probability
• Occurs during high-volume sessions (London/NY)
• Trend is bearish on higher timeframe
Example Trade:
• Bearish OB forms at $48,000 (last green candle before drop)
• Price drops to $46,000 then retraces
• Price rallies back to $47,900 (touching OB)
• Bearish engulfing forms at the OB
• Enter short at $47,800, stop at $48,200
• Target: $46,000- (previous low)
━━━━━━━━━━━━━━━━━━━━━━━━━━━━
📊 How To Use This Indicator
Strategy 1: Order Block Retest (Classic)
Best For: Swing trading, capturing reversals
Timeframes: 15min, 1H, 4H, Daily
Win Rate: 60-70% (first touch)
Entry Rules:
1. Identify unmitigated order block (bright color, not gray)
2. Wait for price to return to the OB zone
3. Look for price action confirmation:
• Bullish OB: Pin bar, bullish engulfing, hammer
• Bearish OB: Shooting star, bearish engulfing, doji
4. Enter in the direction of the OB
5. Stop loss: Beyond the opposite side of OB (20-30 pips)
6. Target: 2-3R or opposite OB
Example:
• Bullish OB at $100-$102
• Price drops to $101.50 (enters OB)
• Bullish pin bar forms with low at $100.80
• Enter long at $102 (OB high), stop at $99.50
• Risk: $2.50, Target: $107.50 (3R)
Strategy 2: Break & Retest
Best For: Trend trading, breakout confirmation
Timeframes: 5min, 15min, 1H
Win Rate: 65-75%
Entry Rules:
1. Price breaks through an order block
2. Wait for pullback to the broken OB
3. The OB now acts as support (if broken up) or resistance (if broken down)
4. Enter when price respects the flipped OB
5. Stop: Inside the OB zone
6. Target: Next OB or structure level
Why It Works: Broken OBs flip polarity - support becomes resistance and vice versa
Strategy 3: Multi-Timeframe Confirmation
Best For: High-probability setups
Timeframes: Combine 1H + 4H or 15min + 1H
Win Rate: 70-80%
Entry Rules:
1. Identify order block on higher timeframe (4H or Daily)
2. Switch to lower timeframe (1H or 15min)
3. Wait for lower TF order block to form within higher TF OB
4. Trade the lower TF OB in direction of higher TF OB
5. Stop: Below lower TF OB
6. Target: Edge of higher TF OB or beyond
Why It Works: Alignment across timeframes = institutional consensus
Strategy 4: Order Block to Order Block
Best For: Range trading, swing entries
Timeframes: 1H, 4H
Win Rate: 55-65%
Entry Rules:
1. Identify both bullish OB below and bearish OB above
2. Price is ranging between these OBs
3. Enter long at bullish OB, target bearish OB
4. Enter short at bearish OB, target bullish OB
5. Stop: Beyond the trading OB
6. Exit at opposite OB
Why It Works: Price moves from one institutional zone to another
Strategy 5: Mitigation Fade
Best For: Aggressive scalping
Timeframes: 5min, 15min
Win Rate: 50-60% (higher risk)
Entry Rules:
1. Price approaches an order block
2. Instead of bouncing, price breaks through (mitigates it)
3. Enter immediately in direction of breakout
4. Stop: Back inside the mitigated OB
5. Quick target: 1-1.5R
Why It Works: When OB fails, it often leads to strong continuation
━━━━━━━━━━━━━━━━━━━━━━━━━━━━
⚙️ Settings Explained
Core Settings
Auto-Adjust for Timeframe (Default: ON)
• Automatically optimizes detection for current chart timeframe
• 1min: 3 bars lookback
• 5min: 4 bars lookback
• 15min: 5 bars lookback
• 1H: 6 bars lookback
• 4H: 8 bars lookback
• Daily+: 10-12 bars lookback
• Recommended: Keep ON for best results
Manual Detection Length (Default: 5)
• Only used when Auto-Adjust is OFF
• Number of bars to look back for the "last opposite candle"
• Lower (2-4): More sensitive, more blocks, more noise
• Higher (6-10): Less sensitive, fewer blocks, higher quality
• Recommended: Use Auto-Adjust instead
Display Settings
Show Bullish/Bearish Order Blocks
• Toggle each type on/off independently
• Customize colors for each OB type
• Tip: Match colors to your chart theme
Max Order Blocks to Display (Default: 10)
• Limits how many OBs are shown at once
• Lower (5-8): Cleaner chart, only recent blocks
• Higher (15-30): More historical context
• Recommended: 8-12 for most trading
Show Order Block Labels (Default: ON)
• Displays "OB+" and "OB-" text on blocks
• Shows 🎯 on active (nearest) block
• Turn OFF for minimal chart appearance
• Recommended: Keep ON for clarity
Extend Blocks (bars) (Default: 50)
• How far to extend OB boxes to the right
• Lower (20-30): Shorter boxes, less clutter
• Higher (100+): Longer boxes, easier to see
• Blocks auto-extend until mitigated or limit reached
• Recommended: 40-60 bars
Filters
Block Strength Filter (Default: Medium)
• Controls how strong a move must be to create an OB
• Low: 0.5x ATR move required - Many blocks, more noise
• Medium: 1x ATR move required - Balanced quality/quantity
• High: 1.5x ATR move required - Only strongest institutional moves
• Recommended for beginners: High
• Recommended for experienced: Medium
• Recommended for scalpers: Low
Min Block Size % (Default: 0.1)
• Minimum size of OB as percentage of price
• Filters out tiny, insignificant blocks
• Crypto: 0.1-0.3%
• Forex: 0.05-0.15%
• Stocks: 0.1-0.5%
• Adjust based on instrument volatility
Advanced Settings
Show Mitigated Blocks (Default: OFF)
• When ON: Shows gray boxes for "used" order blocks
• When OFF: Blocks disappear after mitigation
• Use ON: For learning and analysis
• Use OFF: For clean, active trading
Highlight Active Block (Default: ON)
• Highlights the nearest order block to current price
• Active block shown with 🎯 emoji and brighter color
• Helps focus on most relevant trading opportunity
• Recommended: Keep ON
━━━━━━━━━━━━━━━━━━━━━━━━━━━━
📱 Info Panel Guide
Bullish OB Count
• Number of active (unmitigated) bullish order blocks
• Higher number = More support zones below price
• Multiple bullish OBs = Strong demand structure
Bearish OB Count
• Number of active (unmitigated) bearish order blocks
• Higher number = More resistance zones above price
• Multiple bearish OBs = Strong supply structure
Bias Indicator
• ⬆ Bullish: More bullish OBs than bearish (demand > supply)
• ⬇ Bearish: More bearish OBs than bullish (supply > demand)
• ↔ Neutral: Equal OBs on both sides
• Trade in direction of bias for higher probability
Near Indicator
• Shows which OB price is closest to
• Displays distance as percentage
• Example: "Bull OB 0.85%" = Bullish OB is 0.85% below current price
• Watch for "Near" alerts to time entries
━━━━━━━━━━━━━━━━━━━━━━━━━━━━
📱 Alert Setup
This indicator includes 4 alert types:
1. Price Entering Bullish OB
• Fires when price touches a bullish order block
• Action: Watch for bounce/reversal pattern
• High-probability long setup developing
2. Price Entering Bearish OB
• Fires when price touches a bearish order block
• Action: Watch for rejection/reversal pattern
• High-probability short setup developing
3. New Bullish OB Detected
• Fires when a new bullish order block forms
• Action: Mark the zone for future retest
• New demand zone identified
4. New Bearish OB Detected
• Fires when a new bearish order block forms
• Action: Mark the zone for future retest
• New supply zone identified
To Set Up Alerts:
1. Click "Alert" button (clock icon)
2. Select "Order Block Identifier"
3. Choose your alert condition
4. Configure notification method
5. Click "Create"
Pro Tip: Set "Price Entering" alerts to catch trading opportunities in real-time
━━━━━━━━━━━━━━━━━━━━━━━━━━━━
💎 Pro Tips & Best Practices
✅ DO:
• First touch is best - Unmitigated OBs have highest win rate (60-70%)
• Wait for confirmation - Don't buy/sell just because price touched OB
• Use multiple timeframes - Higher TF OBs are stronger than lower TF
• Combine with structure - OB + trendline/support = high probability
• Trade with the bias - More bullish OBs = favor longs
• Respect mitigation - Once OB is mitigated, it's less reliable
• Use proper stop loss - Always place stops beyond the OB zone
• Consider session timing - OBs work best during London/NY sessions
⚠️ DON'T:
• Don't blindly buy/sell at OBs - Wait for confirmation
• Don't ignore mitigation - Gray blocks are much weaker
• Don't trade every OB - Quality over quantity
• Don't fight strong trends - OBs can be run through in strong momentum
• Don't use alone - Combine with price action, support/resistance
• Don't expect 100% win rate - Even best OBs fail sometimes (30-40% of time)
• Don't overtrade - Wait for A+ setups with confluence
🎯 Best Timeframes By Trading Style:
• Scalpers: 1min, 5min (quick OB touches)
• Day Traders: 5min, 15min, 1H (balanced view)
• Swing Traders: 1H, 4H, Daily (major institutional zones)
• Position Traders: 4H, Daily, Weekly (strongest OBs)
🔥 Best Instruments:
• Excellent: Forex major pairs (EUR/USD, GBP/USD), BTC, ETH, ES, NQ
• Good: Gold, Oil, Major indices, Large-cap stocks
• Moderate: Altcoins, small-cap stocks (more noise)
• Avoid: Very low liquidity instruments (OBs less reliable)
⏰ Best Times To Trade OBs:
• London Session (03:00-12:00 EST): Highest OB respect rate
• NY Session (08:00-17:00 EST): Strong OB reactions
• London-NY Overlap (08:00-12:00 EST): Best probability
• Asian Session: Lower probability, wait for London
━━━━━━━━━━━━━━━━━━━━━━━━━━━━
🎓 Advanced Order Block Concepts
Order Block Flips (Polarity Change)
When price breaks through an OB and closes beyond it:
• Bullish OB that's broken becomes bearish (support becomes resistance)
• Bearish OB that's broken becomes bullish (resistance becomes support)
• Trading: Watch for retest of broken OB from opposite side
Order Block Refinement
When multiple OBs form at similar level:
• Later OB "refines" or "replaces" the earlier one
• Use the most recent OB as the active zone
• Older OBs become less relevant
Order Block Clusters
Multiple OBs stacked close together:
• Creates a "super zone" of institutional interest
• Higher probability of reversal
• Wider zone for entries (more room for confirmation)
Fair Value Gaps + Order Blocks
When OB aligns with Fair Value Gap:
• Extremely high probability setup
• Price is drawn to fill the gap AND test the OB
• Double confluence = institutional magnet
Order Block Mitigation Types
• Full Mitigation: Price fully enters and closes inside OB
• Partial Mitigation: Price wicks into OB but closes outside
• False Mitigation: Quick touch then immediate rejection
• Partial/false mitigation = OB still somewhat valid
━━━━━━━━━━━━━━━━━━━━━━━━━━━━
📈 Common Order Block Patterns
Pattern 1: The Perfect Retest
• OB forms during strong move
• Price continues 100-200+ pips
• Price retraces back to OB
• Clean bounce with confirmation candle
• Highest probability pattern
Pattern 2: The Double Tap
• Price tests OB, bounces weakly
• Price tests same OB again
• Second test produces stronger reaction
• Second touch often better entry
Pattern 3: The Fake-Out
• Price breaks through OB
• Immediately reverses back
• "Stop hunt" or liquidity grab
• Enter after price reclaims OB
Pattern 4: The Ladder
• Multiple OBs stacked like stairs
• Price steps from one OB to next
• Each OB provides support/resistance
• Trade OB-to-OB movements
Pattern 5: The Failed OB
• Price crashes through OB without pause
• OB completely invalidated
• Often signals strong momentum
• Don't fight it, trade the breakout
━━━━━━━━━━━━━━━━━━━━━━━━━━━━
🚀 What Makes This Different?
Unlike basic support/resistance indicators, Order Block Identifier:
• ICT Methodology - Based on proven institutional concepts
• Auto-Timeframe Optimization - Works perfectly on all timeframes
• ATR-Based Detection - Adapts to each instrument's volatility
• Mitigation Tracking - Knows when blocks are no longer valid
• Active Block Highlighting - Shows most relevant opportunity
• Smart Filtering - Only shows high-quality institutional zones
• Visual Clarity - Clean, professional appearance
• Real-Time Updates - Blocks update as price action develops
Based On Professional Concepts:
• ICT Smart Money Concepts (SMC)
• Institutional order flow analysis
• Market maker behavior patterns
• Supply and demand zone theory
━━━━━━━━━━━━━━━━━━━━━━━━━━━━
🙏 If You Find This Helpful
• ⭐ Leave your feedback
• 💬 Share your experience in the comments
• 🔔 Follow for updates and new tools
Questions about Order Blocks? Feel free to ask in the comments.
━━━━━━━━━━━━━━━━━━━━━━━━━━━━
Version History
• v1.0 - Initial release with auto-timeframe detection and ATR-based strength filtering

Session Sweep System – WarRoomXYZ V1WarRoom Session Sweep System v1 is a open-source institutional trading framework built to identify liquidity behavior across Asia, London, and New York sessions.
It combines session-based liquidity mapping, sweep detection, daily expansion modeling, and trend confirmation into a unified, timing-driven system optimized for XAUUSD, FX pairs, indices, and any instrument with session-dependent volatility.
This tool does not attempt to predict direction with arbitrary oscillators.
Instead, it focuses on the underlying market mechanisms that drive price:
liquidity, timing, expansion, and trend alignment.
Below is a detailed explanation of what the script does, how its components work, and how traders can use it effectively.
🔹 1. Session Liquidity Mapping
The script automatically identifies the Asia (00:00–06:00 GMT), London (07:00–12:00 GMT), and New York (13:00–17:00 GMT) sessions and builds real-time session ranges.
Each session creates a liquidity pool.
Trading institutions frequently sweep the high or low of one session before delivering the real move in the next session.
This script captures that behavior by:
►Drawing session range boxes
►Tracking previous session highs/lows
►Highlighting high-probability sweep locations
These ranges are essential reference points for timing entries and exits.
🔹 2. Liquidity Sweep Detection (Buy & Sell Sweeps)
The indicator identifies when price runs a previous session high/low and rejects back inside the range, which is commonly interpreted as a liquidity sweep.
The following sweep types are monitored:
►London sweeping Asia
►New York sweeping London
►Asia sweeping New York
►Daily sweep of PDH/PDL
Sweeps signal that liquidity has been collected and that a potential reversal or continuation is likely.
These are marked clearly on the chart for real-time decision-making.
🔹 3. Killzone Timing Model (GMT Time)
Market manipulation and expansion often occur during specific time windows.
The script highlights these institutional killzones:
►London Killzone: 07:00–10:00 GMT
►New York Killzone: 13:30–15:30 GMT
►NY PM Session: 19:00–21:00 GMT
Sweeps occurring inside these windows carry a significantly higher probability.
The timing layer helps filter out low-quality setups.
🔹 4. Daily Range & ADR Expansion Engine
A dedicated panel displays:
►Current day range
►ADR (Average Daily Range)
►Expansion stage (Early / Developed / Extended)
►PDH/PDL swept or intact
►Overall session bias
This allows traders to understand whether the daily move is likely to continue or reverse.
For example:
►Early expansion → trend continuation likely
►Extended expansion → reversal setups become more probable
This is useful for intraday targets and risk management.
🔹 5. MA Cloud Trend Model (Fast/Slow Structure)
To align liquidity behavior with directional conviction, the script includes a configurable MA engine:
►Fast & slow MA
►MA cloud
►Slope-based trend coloring
►Trend background
►MA cross alerts
The cloud provides trend confirmation without relying on oscillators.
Trades are higher quality when the sweep direction aligns with the MA trend.
🔹 6. How the Components Work Together
The script integrates several institutional concepts into one coherent model:
►Sessions define liquidity pools
►Sweeps identify stop-hunts and reversals
►Killzones define optimal timing
►MA Cloud confirms directional bias
►ADR engine indicates expansion potential
This creates a structured framework:
Sweep → Timing → Trend → Expansion → Execution
Each component strengthens the others, forming a robust decision-making model.
🔹 7. How to Use the Indicator (Practical Guide)
✔ Look for a sweep of a previous session level
When price runs a session high/low and closes back inside, liquidity has likely been collected.
✔ Confirm timing
Sweeps inside London or NY killzones tend to produce the strongest moves.
✔ Confirm trend
Use MA cloud direction and slope:
►Cloud green → long setups preferred
►Cloud red → short setups preferred
✔ Check ADR panel
If the day has already expanded significantly, reversal setups are more likely.
If expansion is still early, continuation setups are favored.
✔ Plan your trade
Common targets include:
►Opposite side of session range
►ADR High/Low
►PDH/PDL
Stops are typically placed beyond the sweep wick.
This creates a repeatable, rule-based approach to intraday liquidity trading.
🔹 8. Why This Script Is Original
This is not a mashup of existing open-source indicators.
It introduces:
►A custom session-linked liquidity sweep engine
►A structured daily expansion model
►Integrated killzone timing aligned with GMT
►A unified bias panel merging sweeps, ADR, and session manipulation
►A trend confirmation layer designed around session behavior
While it uses known institutional concepts, their integration, execution, and timing framework are unique, purpose-built, and not directly found in open-source scripts.
🔹 9. Suitable Markets
This indicator works best on:
►XAUUSD
►Major FX pairs
►US indices
►Synthetic markets with session cycles
Ideal timeframes: 1m, 5m, 15m, 30m
🔹 10. Limitations / Notes
This is an analytical tool, not a buy/sell signal generator
All sweeps are confirmed at candle close (non-repaint)
The tool assumes GMT session windows unless chart time differs
Users must practice risk management and entry triggers manually
Disclaimer
This script is provided for informational and educational purposes only. It does not provide financial, investment, or trading advice, and it does not guarantee profits or future performance. All decisions made based on this script are solely the responsibility of the user.
This script does not execute trades, manage risk, or replace the need for trader discretion. Market behavior can change quickly, and past behavior detected by the script does not ensure similar future outcomes.
Users should test the script on demo or simulation environments before applying it to live markets and must maintain full responsibility for their own risk management, position sizing, and trade execution.
Trading involves risk, and losses can exceed deposits. By using this script, you acknowledge that you understand and accept all associated risks.

VWAP-Anchored MACD [BOSWaves]VWAP-Anchored MACD - Volume-Weighted Momentum Mapping With Zero-Line Filtering
Overview
The VWAP-Anchored MACD delivers a refined momentum model built on volume-weighted price rather than raw closes, giving you a more grounded view of trend strength during sessions, weeks, or months.
Instead of tracking two EMAs of price like a standard MACD, this tool reconstructs the MACD engine using anchored VWAP as the core input. The result is a momentum structure that reacts to real liquidity flow, filters out weak crossovers near the zero line, and visualizes acceleration shifts with clear, high-contrast gradients.
This indicator acts as a precise momentum map that adapts in real time. You see how weighted price is accelerating, where valid crossovers form, and when trend conviction is strong enough to justify execution.
It uses gradient line coloring to show bullish or bearish momentum, histogram shading to highlight energy shifts, cross dots to mark valid crossovers, optional buy/sell diamonds for execution cues, and candle coloring to display trend strength at a glance.
Theoretical Foundation
Traditional MACD compares the difference between two exponential moving averages of price.
This variant replaces price with anchored VWAP, making the calculation sensitive to actual traded volume across your chosen period (Session, Week, or Month).
Three principles drive the logic:
Anchored VWAP Momentum : Price is weighted by volume and aggregated across the selected anchor. The fast and slow VWAP-EMAs then expose how liquidity-corrected momentum is expanding or contracting.
Zero-Line Distance Filtering : Crossover signals that occur too close to the zero line are removed. This eliminates the common MACD problem of generating weak, directionless signals in choppy phases.
Directional Visualization : MACD line, signal line, histogram, candle colors, and optional diamond markers all react to shifts in VWAP-momentum, giving you a clean structural read on market pressure.
Anchoring VWAP to session, weekly, or monthly resets creates a systematic framework for tracking how capital flow is driving momentum throughout each trading cycle.
How It Works
The core engine processes momentum through several mapped layers:
VWAP Aggregation : Price × volume is accumulated until the anchor resets. This creates a continuous, liquidity-corrected VWAP curve.
MACD Construction : Fast and slow VWAP-EMAs define the MACD line, while a smoothed signal line identifies edges where momentum shifts.
Zero-Line Distance Filter : MACD and signal must both exceed a threshold distance from zero for a crossover to count as valid. This prevents fake crossovers during compression.
Visual Momentum Layers : It uses gradient line coloring to show bullish or bearish momentum, histogram shading to highlight energy shifts, cross dots to mark valid crossovers, optional buy/sell diamonds for execution cues, and candle coloring to display trend strength at a glance.
This layered structure ensures you always know whether momentum is strengthening, fading, or transitioning.
Interpretation
You get a clean, structural understanding of VWAP-based momentum:
Bullish Phases : MACD > Signal, histogram expands, candles turn bullish, and crossovers occur above the threshold.
Bearish Phases : MACD < Signal, histogram drives lower, candles shift bearish, and downward crossovers trigger below the threshold.
Neutral/Compression : Both lines remain near the zero boundary, histogram flattens, and signals are suppressed to avoid noise.
This creates a more disciplined version of MACD momentum reading - less noise, more conviction, and better alignment with liquidity.
Strategy Integration
Trend Continuation : Use VWAP-MACD crossovers that occur far from the zero line as higher-conviction entries.
Zero-Line Rejection : Watch for histogram contractions near zero to anticipate flattening momentum and potential reversal setups.
Session/Week/Month Anchors : Session anchor works best for intraday flows. Weekly or monthly anchor structures create cleaner macro momentum reads for swing trading.
Signal-Only Execution : Optional buy/sell diamonds give you direct points to trigger trades without overanalyzing the chart.
This indicator slots cleanly into any momentum-following system and offers higher signal quality than classic MACD variants due to the volume-weighted core.
Technical Implementation Details
VWAP Reset Logic : Session (D), Week (W), or Month (M)
Dynamic Fast/Slow VWAP EMAs : Fully configurable lengths, smoothing and anchor settings
MACD/Signal Line Framework : Traditional structure with volume-anchored input
Zero-Line Filtering : Adjustable threshold for structural confirmation
Dual Visualization Layers : MACD body + histogram + crosses + candle coloring
Optimized Performance : Lightweight, fast rendering across all timeframes
Optimal Application Parameters
Timeframes:
1- 15 min : Short-term momentum scalping and rapid trend shifts
30- 240 min : Balanced momentum mapping with clear structural filtering
Daily : Macro VWAP regime identification
Suggested Configuration:
Fast Length : 12
Slow Length : 26
Signal Length : 9
Zero Threshold : 200 - 500 depending on asset range
These suggested parameters should be used as a baseline; their effectiveness depends on the asset volatility, liquidity, and preferred entry frequency, so fine-tuning is expected for optimal performance.
Performance Characteristics
High Effectiveness:
Assets with strong intraday or session-based volume cycles
Markets where volume-weighted momentum leads price swings
Trend environments with strong acceleration
Reduced Effectiveness:
Ultra-choppy markets hugging the VWAP axis
Sessions with abnormally low volume
Ranges where MACD naturally compresses
Disclaimer
The VWAP-Anchored MACD is a structural momentum tool designed to enhance directional clarity - not a guaranteed predictor. Performance depends on market regime, volatility, and disciplined execution. Use it alongside broader trend, volume, and structural analysis for optimal results.

window//@version=5
indicator("Smart Money Time Windows (GMT+3:30)", overlay=true)
// ✅ Window 1 — 08:30 to 09:05 Tehran Time
w1 = time(timeframe.period, "0830-0905", "Asia/Tehran")
// ✅ Window 2 — 13:50 to 14:40 Tehran Time
w2 = time(timeframe.period, "1350-1440", "Asia/Tehran")
// ✅ Window 3 — 17:15 to 18:00 Tehran Time
w3 = time(timeframe.period, "1715-1800", "Asia/Tehran")
bgcolor(not na(w1) ? color.new(color.blue, 85) : na)
bgcolor(not na(w2) ? color.new(color.orange, 85) : na)
bgcolor(not na(w3) ? color.new(color.purple, 85) : na)

Dual Session Range Boxes with FIB Lines█ OVERVIEW
The Dual Session Range Boxes with FIB Lines indicator is a powerful tool for identifying and visualizing Range Breakout or Inside Boxes Strategy setups with dual session tracking, customizable Fibonacci extensions, and trade zone levels. Perfect for traders who focus on session-based strategies across multiple markets.
█ FEATURES
◆ DUAL SESSION RANGES
- Range 1: Defines the Range (ORB) based on a specific time window
- Range 2: Extends the Range levels throughout a second session for trade management
- Both ranges can be independently configured with preset sessions or custom times
◆ SESSION PRESETS
- Tokyo Session (00:00 - 09:00)
- London Session (08:00 - 17:00)
- New York Session (14:00 - 21:00)
- Pre Market Session (10:00 - 15:30)
- Custom Time: Define your own session windows
◆ FIBONACCI EXTENSION LEVELS
- Automatically calculated from Range 1 High/Low
- Buy Side Levels: Projected above the range (green)
- Sell Side Levels: Projected below the range (red)
- 10 customizable Fib levels with individual on/off toggles:
- 23.6%, 38.2%, 50%, 61.8%, 78.6%, 100%, 127.2%, 161.8%, 200%, 261.8%
- Special color highlighting for key levels (50%, 100%, 200%)
- All percentage values are fully editable
◆ INSIDE TRADE ZONES
- Two horizontal lines drawn inside the Range 1 box
- Configurable percentage from High/Low (default: 10%)
- Helps identify premium/discount zones within the range
◆ LABELS & DISPLAY OPTIONS
- Show/hide price values on labels
- Show/hide percentage values on labels
- Adjustable label size (Tiny, Small, Normal, Large, Huge)
- Configurable label offset (distance above lines)
- Multiple rounding options for price display:
- 0.25 (quarter points - ideal for indices)
- 0.1 (tenth points)
- 0.01 (two decimals)
◆ STYLE CUSTOMIZATION
- Independent fill and border colors for both ranges
- Adjustable border width (1-5)
- Line style options: Solid, Dashed, Dotted
- Separate color settings for:
- Buy side Fibonacci levels
- Sell side Fibonacci levels
- Trade zone lines
- Special levels (50%, 100%, 200%)
◆ HISTORICAL DATA CONTROL
- Toggle to show/hide historical sessions
- Current session always remains visible
- Clean chart view when analyzing only the active session
█ HOW TO USE
1. Set your timezone in General settings
2. Configure Range 1 to capture your desired Opening Range period
3. Configure Range 2 to define how long levels should extend
4. Adjust Fibonacci levels based on your trading strategy
5. Use Trade Zones to identify key areas within the range
6. Toggle historical data on/off based on your analysis needs
█ USE CASES
- Opening Range Breakout (ORB) strategies
- Session-based trading (London, New York, Tokyo, Pre-Market)
- Fibonacci extension targets for breakout trades
- Identifying support/resistance from session ranges
- Multi-session analysis and confluence zones
█ NOTES
- Indicator works on timeframes lower than Daily
- All times are based on the selected timezone setting
- Range 2 only activates after Range 1 completes
- Fibonacci levels extend from Range 1 start to Range 2 end
Let me know if you like to have any enhancements.
Leave a like if you like it!

猛の掟・初動完成版//@version=5
indicator("猛の掟・初動スクリーナー_完成版", overlay=true)
// =============================
// 入力パラメータ
// =============================
emaLenShort = input.int(5, "短期EMA", minval=1)
emaLenMid = input.int(13, "中期EMA", minval=1)
emaLenLong = input.int(26, "長期EMA", minval=1)
macdFastLen = input.int(12, "MACD Fast", minval=1)
macdSlowLen = input.int(26, "MACD Slow", minval=1)
macdSignalLen = input.int(9, "MACD Signal", minval=1)
macdZeroTh = input.float(0.2, "MACDゼロライン近辺とみなす許容値", step=0.05)
volMaLen = input.int(5, "出来高平均日数", minval=1)
volMinRatio = input.float(1.3, "出来高倍率(初動判定しきい値)", step=0.1)
volStrongRatio = input.float(1.5, "出来高倍率(本物/三点シグナル用)", step=0.1)
highLookback = input.int(60, "直近高値の参照本数", minval=10)
pullbackMin = input.float(5.0, "押し目最小 ", step=0.5)
pullbackMax = input.float(15.0, "押し目最大 ", step=0.5)
breakLookback = input.int(15, "レジブレ後とみなす本数", minval=1)
wickBodyMult = input.float(2.0, "ピンバー:下ヒゲが実体の何倍以上か", step=0.5)
// ★ シグナル表示 ON/OFF
showMou = input.bool(true, "猛シグナルを表示")
showKaku = input.bool(true, "確シグナルを表示")
// =============================
// 基本指標計算
// =============================
emaShort = ta.ema(close, emaLenShort)
emaMid = ta.ema(close, emaLenMid)
emaLong = ta.ema(close, emaLenLong)
= ta.macd(close, macdFastLen, macdSlowLen, macdSignalLen)
volMa = ta.sma(volume, volMaLen)
volRatio = volMa > 0 ? volume / volMa : 0.0
recentHigh = ta.highest(high, highLookback)
prevHigh = ta.highest(high , highLookback)
pullbackPct = recentHigh > 0 ? (recentHigh - close) / recentHigh * 100.0 : 0.0
// ローソク足
body = math.abs(close - open)
upperWick = high - math.max(open, close)
lowerWick = math.min(open, close) - low
// =============================
// A:トレンド条件
// =============================
emaUp = emaShort > emaShort and emaMid > emaMid and emaLong > emaLong
goldenOrder = emaShort > emaMid and emaMid > emaLong
aboveEma2 = close > emaLong and close > emaLong
trendOK = emaUp and goldenOrder and aboveEma2
// =============================
// B:MACD条件
// =============================
macdGC = ta.crossover(macdLine, macdSignal)
macdNearZero = math.abs(macdLine) <= macdZeroTh
macdUp = macdLine > macdLine
macdOK = macdGC and macdNearZero and macdUp
// =============================
// C:出来高条件
// =============================
volInitOK = volRatio >= volMinRatio // 8条件用
volStrongOK = volRatio >= volStrongRatio // 三点シグナル用
volumeOK = volInitOK
// =============================
// D:ローソク足パターン
// =============================
isBullPinbar = lowerWick > wickBodyMult * body and lowerWick > upperWick and close >= open
isBullEngulf = close > open and open < close and close > open
isBigBullCross = close > emaShort and close > emaMid and open < emaShort and open < emaMid and close > open
candleOK = isBullPinbar or isBullEngulf or isBigBullCross
// =============================
// E:価格帯(押し目&レジブレ)
// =============================
pullbackOK = pullbackPct >= pullbackMin and pullbackPct <= pullbackMax
isBreakout = close > prevHigh and close <= prevHigh
barsSinceBreak = ta.barssince(isBreakout)
afterBreakZone = barsSinceBreak >= 0 and barsSinceBreak <= breakLookback
afterBreakPullbackOK = afterBreakZone and pullbackOK and close > emaShort
priceOK = pullbackOK and afterBreakPullbackOK
// =============================
// 8条件の統合
// =============================
allRulesOK = trendOK and macdOK and volumeOK and candleOK and priceOK
// =============================
// 最終三点シグナル
// =============================
longLowerWick = lowerWick > wickBodyMult * body and lowerWick > upperWick
macdGCAboveZero = ta.crossover(macdLine, macdSignal) and macdLine > 0
volumeSpike = volStrongOK
finalThreeSignal = longLowerWick and macdGCAboveZero and volumeSpike
buyConfirmed = allRulesOK and finalThreeSignal
// =============================
// 描画
// =============================
plot(emaShort, color=color.new(color.yellow, 0), title="EMA 短期(5)")
plot(emaMid, color=color.new(color.orange, 0), title="EMA 中期(13)")
plot(emaLong, color=color.new(color.blue, 0), title="EMA 長期(26)")
// シグナル表示(ON/OFF付き)
plotshape(showMou and allRulesOK, title="猛の掟 8条件クリア候補", location=location.belowbar, color=color.new(color.lime, 0), text="猛")
plotshape(showKaku and buyConfirmed, title="猛の掟 最終三点シグナル確定", location=location.belowbar, color=color.new(color.yellow, 0), text="確")
// =============================
// アラート条件
// =============================
alertcondition(allRulesOK, title="猛の掟 8条件クリア候補", message="猛の掟 8条件クリア候補シグナル発生")
alertcondition(buyConfirmed, title="猛の掟 最終三点シグナル確定", message="猛の掟 最終三点シグナル=買い確定")

猛の掟・初動スクリーナー_完成版//@version=5
indicator("猛の掟・初動スクリーナー_完成版", overlay=true)
// =============================
// 入力パラメータ
// =============================
emaLenShort = input.int(5, "短期EMA", minval=1)
emaLenMid = input.int(13, "中期EMA", minval=1)
emaLenLong = input.int(26, "長期EMA", minval=1)
macdFastLen = input.int(12, "MACD Fast", minval=1)
macdSlowLen = input.int(26, "MACD Slow", minval=1)
macdSignalLen = input.int(9, "MACD Signal", minval=1)
macdZeroTh = input.float(0.2, "MACDゼロライン近辺とみなす許容値", step=0.05)
volMaLen = input.int(5, "出来高平均日数", minval=1)
volMinRatio = input.float(1.3, "出来高倍率(初動判定しきい値)", step=0.1)
volStrongRatio = input.float(1.5, "出来高倍率(本物/三点シグナル用)", step=0.1)
highLookback = input.int(60, "直近高値の参照本数", minval=10)
pullbackMin = input.float(5.0, "押し目最小 ", step=0.5)
pullbackMax = input.float(15.0, "押し目最大 ", step=0.5)
breakLookback = input.int(15, "レジブレ後とみなす本数", minval=1)
wickBodyMult = input.float(2.0, "ピンバー:下ヒゲが実体の何倍以上か", step=0.5)
// ★ シグナル表示 ON/OFF
showMou = input.bool(true, "猛シグナルを表示")
showKaku = input.bool(true, "確シグナルを表示")
// =============================
// 基本指標計算
// =============================
emaShort = ta.ema(close, emaLenShort)
emaMid = ta.ema(close, emaLenMid)
emaLong = ta.ema(close, emaLenLong)
= ta.macd(close, macdFastLen, macdSlowLen, macdSignalLen)
volMa = ta.sma(volume, volMaLen)
volRatio = volMa > 0 ? volume / volMa : 0.0
recentHigh = ta.highest(high, highLookback)
prevHigh = ta.highest(high , highLookback)
pullbackPct = recentHigh > 0 ? (recentHigh - close) / recentHigh * 100.0 : 0.0
// ローソク足
body = math.abs(close - open)
upperWick = high - math.max(open, close)
lowerWick = math.min(open, close) - low
// =============================
// A:トレンド条件
// =============================
emaUp = emaShort > emaShort and emaMid > emaMid and emaLong > emaLong
goldenOrder = emaShort > emaMid and emaMid > emaLong
aboveEma2 = close > emaLong and close > emaLong
trendOK = emaUp and goldenOrder and aboveEma2
// =============================
// B:MACD条件
// =============================
macdGC = ta.crossover(macdLine, macdSignal)
macdNearZero = math.abs(macdLine) <= macdZeroTh
macdUp = macdLine > macdLine
macdOK = macdGC and macdNearZero and macdUp
// =============================
// C:出来高条件
// =============================
volInitOK = volRatio >= volMinRatio // 8条件用
volStrongOK = volRatio >= volStrongRatio // 三点シグナル用
volumeOK = volInitOK
// =============================
// D:ローソク足パターン
// =============================
isBullPinbar = lowerWick > wickBodyMult * body and lowerWick > upperWick and close >= open
isBullEngulf = close > open and open < close and close > open
isBigBullCross = close > emaShort and close > emaMid and open < emaShort and open < emaMid and close > open
candleOK = isBullPinbar or isBullEngulf or isBigBullCross
// =============================
// E:価格帯(押し目&レジブレ)
// =============================
pullbackOK = pullbackPct >= pullbackMin and pullbackPct <= pullbackMax
isBreakout = close > prevHigh and close <= prevHigh
barsSinceBreak = ta.barssince(isBreakout)
afterBreakZone = barsSinceBreak >= 0 and barsSinceBreak <= breakLookback
afterBreakPullbackOK = afterBreakZone and pullbackOK and close > emaShort
priceOK = pullbackOK and afterBreakPullbackOK
// =============================
// 8条件の統合
// =============================
allRulesOK = trendOK and macdOK and volumeOK and candleOK and priceOK
// =============================
// 最終三点シグナル
// =============================
longLowerWick = lowerWick > wickBodyMult * body and lowerWick > upperWick
macdGCAboveZero = ta.crossover(macdLine, macdSignal) and macdLine > 0
volumeSpike = volStrongOK
finalThreeSignal = longLowerWick and macdGCAboveZero and volumeSpike
buyConfirmed = allRulesOK and finalThreeSignal
// =============================
// 描画
// =============================
plot(emaShort, color=color.new(color.yellow, 0), title="EMA 短期(5)")
plot(emaMid, color=color.new(color.orange, 0), title="EMA 中期(13)")
plot(emaLong, color=color.new(color.blue, 0), title="EMA 長期(26)")
// シグナル表示(ON/OFF付き)
plotshape(showMou and allRulesOK, title="猛の掟 8条件クリア候補", location=location.belowbar, color=color.new(color.lime, 0), text="猛")
plotshape(showKaku and buyConfirmed, title="猛の掟 最終三点シグナル確定", location=location.belowbar, color=color.new(color.yellow, 0), text="確")
// =============================
// アラート条件
// =============================
alertcondition(allRulesOK, title="猛の掟 8条件クリア候補", message="猛の掟 8条件クリア候補シグナル発生")
alertcondition(buyConfirmed, title="猛の掟 最終三点シグナル確定", message="猛の掟 最終三点シグナル=買い確定")

specific breakout FiFTOStrategy Description: 10:14 Breakout Only
Overview This is a time-based intraday trading strategy designed to capture momentum bursts that occur specifically after the 10:14 AM candle closes. It operates on the logic that if price breaks the high of this specific candle within a short window, a trend continuation is likely.
Core Logic & Rules
The Setup Candle (10:14 AM)
The strategy waits specifically for the minute candle at 10:14 to complete.
Once this candle closes, the strategy records its High price.
Defining the Entry Level
It calculates a trigger price by taking the 10:14 High and adding a user-defined Buffer (e.g., +1 point).
Formula: Entry Level = 10:14 High + Buffer
The "Active Window" (Expiry)
The trade setup does not remain open all day. It has a strict time limit.
By default, the setup is valid from 10:15 to 10:20.
If the price does not break the Entry Level by the expiry time (default 10:20), the setup is cancelled and no trade is taken for the day.
Entry Trigger
If a candle closes above the Entry Level while the window is open, a Long (Buy) position is opened immediately.
Exits (Risk Management)
Stop Loss: A fixed number of points below the entry price.
Target: A fixed number of points above the entry price.
Visual & Automation Features
Visual Boxes: Upon entry, the strategy draws a "Long Position" style visual on the chart. A green box highlights the profit zone, and a red box highlights the loss zone. These boxes extend automatically until the trade closes.
JSON Alerts: The strategy is pre-configured to send data-rich alerts for automation (e.g., Telegram bots).
Entry Alert: Includes Symbol, Entry Price, SL, and TP.
Exit Alerts: Specific messages for "Target Hit" or "SL Hit".
Summary of User Inputs
Entry Buffer: Extra points added to the high to filter false breaks.
Fixed Stop Loss: Risk per trade in points.
Fixed Target: Reward per trade in points.
Expiry Minute: The minute (10:xx) at which the setup becomes invalid if not triggered.

MeanReversion_tradeALERTOverview The Apex Reversal Predictor v2.5 is a specialized mean reversion strategy designed for scalping high-volatility assets like NQ (Nasdaq), ES (S&P 500), and Crypto. While most indicators chase breakouts, this system hunts for "Liquidity Sweeps"—moments where the market briefly breaks a key level to trap retail traders before snapping back to the true value (VWAP).
This is not just a signal indicator; it is a full Trade Manager that calculates your Entry, Stop Loss, and Take Profit levels automatically based on volatility (ATR).
The Logic: Why This Works Markets act like a rubber band. They can only stretch so far from their average price before snapping back. This script combines three layers of logic to identify these snap-back points:
The Stretch (Sigma Score): Measures how far price is from the VWAP relative to ATR. If the score > 2.0, the "rubber band" is overextended.
The Trap (Liquidity Sweep): Identifies Pivot Highs/Lows. It waits for price to break a pivot (luring in breakout traders) and then immediately reverse (trapping them).
The Exhaustion (RSI): Confirms that momentum is Overbought/Oversold to prevent trading against a strong trend.
Key Features
Dynamic Lines: Automatically draws Blue (Entry), Red (SL), and Green (TP) lines on the chart for active trades.
Smart Targets: Two modes for taking profit:
Mean Reversion: Targets the VWAP line (High Win Rate).
Fixed Ratio: Targets a specific Risk:Reward (e.g., 1:2).
Live Dashboard: Tracks Win Rate, Net Points, and the live "Stretch Score" in the bottom right corner.
Alert Ready: Formatted JSON alerts for easy integration with Discord or trading bots.
How & When to Use (User Guide)
1. Best Timeframes
5-Minute (5m): Best for NQ and volatile stocks (TSLA, NVDA). Filters out 1-minute noise but catches the intraday reversals.
15-Minute (15m): Best for Forex or slower-moving indices (ES).
2. The Setup Checklist Before taking a trade, look at the Dashboard in the bottom right:
Step 1: Check the "Stretch (Sigma)". Is it Orange or Red? This means price is extended and ripe for a reversal. If it's Green, the market is calm—be careful.
Step 2: Wait for the Signal.
"Apex BUY" (Green Label): Price swept a low and closed green.
"Apex SELL" (Red Label): Price swept a high and closed red.
Step 3: Execute. Enter at the close of the signal candle. Set your stop loss at the Red Line provided by the script.
3. Warning / When NOT to Use
Strong Trending Days: If the market is trending heavily (e.g., creating higher highs all day without looking back), do not fight the trend.
News Events: Avoid using this during CPI, FOMC, or NFP releases. The "rubber band" logic breaks during news because volatility expands indefinitely.
