RSC Trend Trading Strategy v1.0Ready Set Crypto Trend Trading Back-testing Strategy v1.0
This is a backtesting strategy for those who are familiar with Doc Severson's (Ready Set Crypto) Trend Trading Class offered at Ready Set Crypto . It is published with permission.
I highly recommend that you attend the class to understand this strategy and use this to your advantage. There is way more than just some indicators to utilise this trading strategy successfully.
Please also see the matching indicator for this strategy: Ready Set Crypto Trend Trading Indicator .
Buy and Sell Calls are based on the following:
An Upper Donchian Channel of 20 days (default) or more, used to indicate buy signals
A Lower Donchian Channel of 10 days (default) or more, used to indicate exit signals
A 50 day Simple Moving Average (for entry filtering)
A 200 day Simple Moving Average (for entry filtering)
How to do back-testing with this:
Once you add this strategy to your chart, go to the " Strategy Tester " section at the bottom of the screen to see it's performance.
You will need to configure the strategy (just like you'd configure any indicator) to tailor it to your specific scenarios.
Note following:
TradingView does not support BTC, ETH, etc as currencies, so BTC and other trading pairs are not available for back-testing; You will have to use USD pairs
The backtesting will apply to your chart's time frame (candle times) - use daily time candles as the starting point
You will need to tailor the " Input " and " Properties " options (click on the little gear icon) to adjust to suit your needs/scenarios
The default settings are as follows:
Backtest the current chart/ticker for the period of 2016 to 2020,
With a single position of US$1000 and a 0.1% commission (no pyramiding, i.e. multiple buy entries),
By entering a single position (buy) when the price is above SMA 50 and 200 and a candle high touches DC 20,
And exiting the position when a candle low touches DC 10.
Look under the " Strategy Tester " pane for the back-testing overview, performance and list of trades. Or if you are looking at the Published Idea , the back-testing results are displayed at the bottom of the page.
Please like, Share and Comment, if you like this indicator.
Warning
The Buy and Sell calls are meaningless and must not be auctioned without a thorough understanding of this trading strategy and the full consideration of the entry and exit conditions.
Please use this indicator at your own risk. The publisher does not accept any responsibility for its performance or any implications.
Tìm kiếm tập lệnh với "backtest"

Intellitrader - Buy Random BACKTESTERI created a little backtester that it combines some of what we need to backtest to finetune a good strategy for Intellitrader.
RSI
STOCH
STOCHRSI
CCI
Price Change

[Bybit BTCUSD.P] 7Years Backtest Results. 2,609% +Non-Repainting📊 I. Strategy Overview: Trust Backed by Numbers
The ADX Sniper v12 strategy has been rigorously tested over 7 years, from November 14, 2018 to November 8, 2025, spanning every major cycle of the Bitcoin
BTCUSD.P futures market. This strategy successfully balances two often-conflicting goals: maximizing profitability while minimizing volatility, all supported by objective performance data.
This strategy has been validated across all Bitcoin (BTCUSD.P) futures market cycles over a 7-year period.
■ Visual Proof: Bar Replay Simulation
The chart above demonstrates actual entry and exit points captured via TradingView's Bar Replay feature. The green rectangle highlights the core profitable trading zone, showing where the strategy successfully captured sustained uptrends. This visual evidence confirms:
Confirmed buy/sell signals with exact execution prices (marked in red and blue)
No repainting or signal distortion after candle close
Consistent performance across multiple market cycles within the highlighted zone
💰 Core Performance Metrics:
Cumulative Return: 2,609.14% (compounded growth over 7 years)
Maximum Drawdown (MDD): 6.999% (preserving over 93% of capital)
Average Profit/Loss Ratio: 8.003 (industry-leading risk-reward efficiency)
Total Trades: 24 (focused exclusively on high-conviction opportunities)
Sortino Ratio: 11.486 (mathematically proving robustness and stability)
✅ This strategy has been validated across all Bitcoin BTCUSD.P futures market cycles over a 7-year period.
📊 I. 전략 개요: 숫자로 입증된 신뢰
ADX Sniper v12 전략은 2018년 11월 14일부터 2025년 11월 8일까지 약 7년간 비트코인 (BTCUSD.P) 선물 시장의 모든 주요 사이클을 거치며 엄격하게 검증되었습니다. 수익성 극대화와 변동성 최소화라는 상충되는 목표를 동시에 달성한 이 전략의 핵심 성과 지표를 객관적 데이터를 통해 확인하실 수 있습니다.
본 전략은 7년간의 모든 비트코인 (BTCUSD.P) 선물 시장 사이클에서 검증되었습니다.
■ 시각적 증명: 바 리플레이 시뮬레이션
위 차트는 TradingView의 바 리플레이 기능으로 포착된 실제 진입 및 청산 시점을 보여줍니다. 녹색 네모는 핵심 수익 구간을 표시하며, 전략이 지속적인 상승 추세를 성공적으로 포착한 영역을 나타냅니다. 본 시각 자료는 다음을 입증합니다:
정확한 체결 가격이 표기된 확정된 매수/매도 신호 (빨강색과 파랑색으로 표시)
캔들 종가 후 신호 왜곡이나 리페인팅 없음
강조 표시된 구간 내 여러 시장 사이클에 걸친 일관된 성과
💰 핵심 성과 지표:
누적 수익률: 2,609.14% (7년간 복리 성장 입증)
최대 낙폭 (MDD): 6.999% (7년간 자본의 93% 이상 보존)
평균 손익비: 8.003 (업계 최고 수준의 위험-보상 효율성)
총 거래 횟수: 24회 (고확신 기회에만 집중)
소르티노 비율: 11.486 (전략의 견고성과 안정성을 수학적으로 입증)
✅ 본 전략은 7년간의 모든 비트코인 (BTCUSD.P) 선물 시장 사이클에서 검증되었습니다.
🛡️ II. Core Philosophy: Cut Losses Short, Let Profits Run
Why MDD Stays Below 7% in a Volatile Market
The crypto futures market typically experiences daily volatility exceeding 10%, with most strategies enduring drawdowns between 30% and 50%. In stark contrast, this strategy has never exceeded a 7% account loss over seven years. This exceptional low MDD is achieved through deliberate design mechanisms, not luck:
🎯 Entry Filtering: The 'ADX Pop-up Filter' is the core component. It enables the strategy to strictly avoid trading when market conditions indicate major reversals or consolidation phases, thereby minimizing exposure to high-risk zones.
🏛️ Capital Preservation Priority: The strategy prioritizes investor psychological stability and capital preservation over pursuing maximum potential returns.
The Power of an 8.003 Profit Factor
The Profit Factor measures the ratio of total profitable trades to total losing trades. It's the most critical metric for assessing risk-adjusted returns.
A Profit Factor of 8.003 means that for every dollar lost, the strategy earns an average of eight dollars. This demonstrates the efficiency of a true trend-following strategy:
Cutting losses quickly (averaging $177,419 USD loss per trade)
Riding winners for maximum extension (averaging $1,419,920 USD profit per trade)
🛡️ II. 핵심 철학: 손실은 빠르게 자르고, 수익은 끝까지
암호화폐 시장에서 MDD <7%의 의미
암호화폐 선물 시장은 일일 변동성이 10%를 초과하는 경우가 빈번하며, 일반적인 전략들은 30~50%의 MDD를 겪습니다. 이와 극명한 대조로, 본 전략은 7년간 단 한 번도 7%를 초과하는 계좌 손실을 기록하지 않았습니다. 이렇게 극도로 낮은 MDD는 운이 아닌 체계적인 메커니즘을 통해 달성되었습니다:
🎯 진입 필터링: 'ADX 팝업 필터'가 핵심 구성 요소로, 시장 상황이 주요 반전이나 횡보를 나타낼 때 거래를 엄격히 회피하여 고위험 구간 노출을 최소화합니다.
🏛️ 자본 보존 우선: 본 전략은 최대 잠재 손실을 감수하기보다 투자자의 심리적 안정성과 자본 보존을 우선시하도록 설계되었습니다.
손익비 8.003의 힘
손익비는 '총 수익 거래'와 '총 손실 거래'의 비율로, 위험 조정 수익을 측정하는 핵심 지표입니다.
8.003이라는 값은 1달러를 잃을 때마다 평균적으로 8달러 이상을 벌어들이는 구조를 의미합니다. 이는 진정한 추세 추종 전략의 최대 효율성을 보여줍니다:
손실은 빠르게 자르고 ($177,419 USD 평균 손실)
수익은 최대한 연장합니다 ($1,419,920 USD 평균 수익)
🎯 III. Strategy Reliability and Structural Edge
The Secret of 24 Trades in 7 Years
Only 24 trades over 7 years signifies that this strategy ignores 99% of market volatility and targets only the 1% of 'most certain buying cycles'. This approach eliminates the drag from excessive trading:
❌ No commission bleed
❌ No slippage erosion
❌ No psychological wear from overtrading
📈 Long-Term Trend Following: The strategy analyzes Bitcoin's long-term price cycles to capture the onset of massive trends while remaining undisturbed by short-term market noise.
Non-Repainting Structure: Alignment of Reality and Simulation
🎬 Non-Repainting Proof Video Available
※↑ "If you wish, I can also show you a video as evidence of the non-repainting throughout the 7 years."
✅ Real-Time Trading Reliability: This strategy is built with a non-repainting structure, generating buy/sell signals only after each candle's closing price is confirmed.
✅ Preventing Data Exaggeration: This design ensures that backtest results do not 'repaint' or distort past performance, guaranteeing high correlation between simulated results and actual live trading environments.
✅ Live Trading Advantage: While simulations use closing prices, live trading may allow entry at more favorable prices before candle close, potentially yielding even better execution than backtest results.
🎯 III. 전략의 신뢰성과 구조적 우위
7년간 24회 거래의 비밀
7년간 단 24회의 거래는 시장 변동성의 99%를 무시하고 오직 1%의 '가장 확실한 매수 사이클'만을 타겟으로 한다는 것을 의미합니다. 이는 과도한 거래로 인한 문제를 근본적으로 제거합니다:
❌ 수수료 소모 없음
❌ 슬리피지 침식 없음
❌ 과도한 트레이딩으로 인한 심리적 소모 없음
📈 장기 추세 추종: 비트코인 가격 역사를 지배하는 장기 사이클 분석을 활용하여, 단기 시장 노이즈에 흔들리지 않고 대규모 추세의 시작점을 포착하는 데 집중합니다.
논-리페인팅 구조: 현실과 시뮬레이션의 일치
🎬 논-리페인팅 증명 영상 제공 가능
※↑ "원하신다면 7년간 리페인팅이 없음을 증명하는 영상도 보여드릴 수 있습니다."
✅ 실시간 거래 신뢰성: 본 전략은 논-리페인팅 구조로 구축되어, 캔들의 종가가 확정된 후에만 매수/매도 신호를 생성합니다.
✅ 데이터 과장 방지: 이러한 설계는 백테스트 결과가 과거 성과를 '리페인팅'하거나 과장하지 않도록 보장하며, 시뮬레이션 결과와 실제 라이브 거래 환경 간의 높은 상관관계를 보장합니다.
✅ 라이브 실행 우위 가능성: 시뮬레이션은 종가 기준이지만, 라이브 운영 시 캔들이 마감되기 전 더 유리한 가격에 진입할 수 있어 시뮬레이션 결과보다 더 나은 실행 성과를 얻을 가능성이 있습니다.
📈 IV. Performance Summary (November 14, 2018 - November 8, 2025)
| Metric | Value || Metric | Value |
|--------|-------|
| Initial Capital | $1,000,000 |
| Net Profit | +$26,091,383.74 |
| Cumulative Return | +2,609.14% |
| Maximum Drawdown | -6.999% |
| Total Trades | 24 |
| Winning Trades | 19 (79.17%) |
| Losing Trades | 5 (20.83%) |
| Avg Winning Trade | +$1,419,920.16 |
| Avg Losing Trade | -$177,419.86 |
| Profit Factor | 8.003 |
| Sortino Ratio | 11.486 |
| Win/Loss Ratio | 8.003 |
⚙️ Default Settings:
Slippage: 0 ticks
Commission: 0.333% (Bybit standard)
📈 IV. 성과 지표 요약 (2018년 11월 14일 ~ 2025년 11월 8일)
|| 지표 | 값 |
|--------|-------|
| 초기 자본 | $1,000,000 |
| 순이익 | +$26,091,383.74 |
| 누적 수익률 | +2,609.14% |
| 최대 낙폭 | -6.999% |
| 총 거래 횟수 | 24 |
| 수익 거래 | 19 (79.17%) |
| 손실 거래 | 5 (20.83%) |
| 평균 수익 거래 | +$1,419,920.16 |
| 평균 손실 거래 | -$177,419.86 |
| 손익비 | 8.003 |
| 소르티노 비율 | 11.486 |
| 평균 손익 비율 | 8.003 |
⚙️ 기본 설정:
슬리피지: 0틱 (기본값)
수수료: 0.333% (Bybit 표준)
👥 V. Who Is This Strategy For?
✅ Long-term Bitcoin investors seeking stable, low-drawdown returns
✅ Traders tired of overtrading who prefer surgical, sniper-style precision entries
✅ Investors seeking psychological stability by avoiding large account swings
✅ Data-driven decision makers who value proven performance over marketing claims
👥 V. 이 전략은 누구를 위한 것인가요?
✅ 안정적이고 낮은 낙폭의 수익을 추구하는 장기 비트코인 투자자
✅ 과도한 매매에 지친 트레이더로 저격수 스타일의 정밀한 진입을 선호하는 분
✅ 큰 계좌 변동을 피하여 심리적 안정성을 추구하는 투자자
✅ 주장보다 검증된 객관적 성과를 중시하는 데이터 기반 의사 결정자
🔒 VI. Access & Disclaimer
🔐 Access Type: Invite-Only (Protected Source Code)
💬 How to Get Access: Send a private message or leave a comment below
⚠️ Important Disclaimer:
Past performance does not guarantee future results. Cryptocurrency and futures trading involve substantial risk of loss. This strategy is provided for educational and informational purposes only. Users should conduct their own research and consult with a financial advisor before making investment decisions. The author is not responsible for any financial losses incurred from using this strategy.
🔒 VI. 접근 방법 및 면책사항
🔐 접근 유형: 초대 전용 (소스코드 보호)
💬 접근 방법: 비공개 메시지 또는 아래 댓글 남기기
⚠️ 중요 면책사항:
과거 성과가 미래 결과를 보장하지 않습니다. 암호화폐 및 선물 거래는 상당한 손실 위험을 수반합니다. 본 전략은 교육 및 정보 제공 목적으로만 제공됩니다. 사용자는 투자 결정을 내리기 전 자체 조사를 수행하고 재무 자문가와 상담해야 합니다. 저자는 본 전략 사용으로 인한 재정적 손실에 대해 책임지지 않습니다.
🏷️ VII. Tags
Bitcoin |Bitcoin | BTCUSD | BTCUSD.P | Bybit | DailyChart | LongTerm | TrendFollowing | ADX | NonRepainting | Strategy | BacktestProven | SevenYears | LowDrawdown | HighProfitFactor | StableReturns | CapitalPreservation | Ichimoku | DMI | SuperTrend | TechnicalAnalysis | Volatility | RiskManagement | AutoTrading | Futures | PerpetualFutures | AlgorithmicTrading | SystematicTrading | DataDriven | InviteOnly | ProtectedScript | SnipperTrading | HighConviction | MDD | SortinoRatio
🏷️ VII. 태그
비트코인 |비트코인 | BTCUSD | BTCUSD.P | 바이비트 | 일봉 | 장기투자 | 추세추종 | ADX | 논리페인팅 | 전략 | 백테스트검증 | 7년검증 | 저낙폭 | 고손익비 | 안정수익 | 자본보존 | 일목균형표 | DMI | 슈퍼트렌드 | 기술적분석 | 변동성 | 위험관리 | 자동매매 | 선물 | 무기한선물 | 알고리즘트레이딩 | 시스템트레이딩 | 데이터기반 | 초대전용 | 보호스크립트 | 저격수트레이딩 | 고확신 | MDD | 소르티노비율
📌 Note: This strategy is designed exclusively for Bybit BTCUSD.P perpetual futures on the 1-day (daily) timeframe. Performance may vary significantly on other symbols or timeframes.
📌 참고: 본 전략은 Bybit BTCUSD.P 무기한 선물 계약의 1일봉(Daily) 타임프레임에 전용으로 설계되었습니다. 다른 심볼이나 타임프레임에서는 성과가 크게 달라질 수 있습니다.

[Bybit BTCUSD.P] 7Years Backtest Results. 2,609% +Non-Repainting
📊 I. Strategy Overview: Trust Backed by Numbers
The ADX Sniper v12 strategy has been rigorously tested over 7 years, from November 14, 2018 to November 8, 2025, spanning every major cycle of the Bitcoin BTCUSD.P futures market. This strategy successfully balances two often-conflicting goals: maximizing profitability while minimizing volatility, all supported by objective performance data.
This strategy has been validated across all Bitcoin (BTCUSD.P) futures market cycles over a 7-year period.
■ Visual Proof: Bar Replay Simulation
The chart above demonstrates actual entry and exit points captured via TradingView's Bar Replay feature. The green rectangle highlights the core profitable trading zone, showing where the strategy successfully captured sustained uptrends. This visual evidence confirms:
1) Confirmed buy/sell signals with exact execution prices (marked in red and blue)
2) No repainting or signal distortion after candle close
3) Consistent performance across multiple market cycles within the highlighted zone
💰 Core Performance Metrics:
Cumulative Return : 2,609.14% (compounded growth over 7 years)
Maximum Drawdown (MDD) : 6.999% (preserving over 93% of capital)
Average Profit/Loss Ratio : 8.003 (industry-leading risk-reward efficiency)
Total Trades : 24 (focused exclusively on high-conviction opportunities)
Sortino Ratio : 11.486 (mathematically proving robustness and stability)
✅ This strategy has been validated across all Bitcoin BTCUSD.P futures market cycles over a 7-year period.
🛡️ II. Core Philosophy: Cut Losses Short, Let Profits Run
Why MDD Stays Below 7% in a Volatile Market
The crypto futures market typically experiences daily volatility exceeding 10%, with most strategies enduring drawdowns between 30% and 50%. In stark contrast, this strategy has never exceeded a 7% account loss over seven years. This exceptional low MDD is achieved through deliberate design mechanisms, not luck:
🎯 Entry Filtering: The 'ADX Pop-up Filter' is the core component. It enables the strategy to strictly avoid trading when market conditions indicate major reversals or consolidation phases, thereby minimizing exposure to high-risk zones.
🏛️ Capital Preservation Priority: The strategy prioritizes investor psychological stability and capital preservation over pursuing maximum potential returns.
The Power of an 8.003 Profit Factor
The Profit Factor measures the ratio of total profitable trades to total losing trades. It's the most critical metric for assessing risk-adjusted returns.
A Profit Factor of 8.003 means that for every dollar lost, the strategy earns an average of eight dollars. This demonstrates the efficiency of a true trend-following strategy:
Cutting losses quickly (averaging $177,419 USD loss per trade)
Riding winners for maximum extension (averaging $1,419,920 USD profit per trade)
🎯 III. Strategy Reliability and Structural Edge
The Secret of 24 Trades in 7 Years
Only 24 trades over 7 years signifies that this strategy ignores 99% of market volatility and targets only the 1% of 'most certain buying cycles'. This approach eliminates the drag from excessive trading:
❌ No commission bleed
❌ No slippage erosion
❌ No psychological wear from overtrading
📈 Long-Term Trend Following: The strategy analyzes Bitcoin's long-term price cycles to capture the onset of massive trends while remaining undisturbed by short-term market noise.
Non-Repainting Structure: Alignment of Reality and Simulation
🎬 Non-Repainting Proof Video Available
※↑ "If you wish, I can also show you a video as evidence of the non-repainting throughout the 7 years."
✅ Real-Time Trading Reliability: This strategy is built with a non-repainting structure, generating buy/sell signals only after each candle's closing price is confirmed.
✅ Preventing Data Exaggeration: This design ensures that backtest results do not 'repaint' or distort past performance, guaranteeing high correlation between simulated results and actual live trading environments.
✅ Live Trading Advantage: While simulations use closing prices, live trading may allow entry at more favorable prices before candle close, potentially yielding even better execution than backtest results.
📈 IV. Performance Summary (November 14, 2018 - November 8, 2025)
|| Metric | Value |
|--------|-------|
| Initial Capital | $1,000,000 |
| Net Profit | +$26,091,383.74 |
| Cumulative Return | +2,609.14% |
| Maximum Drawdown | -6.999% |
| Total Trades | 24 |
| Winning Trades | 19 (79.17%) |
| Losing Trades | 5 (20.83%) |
| Avg Winning Trade | +$1,419,920.16 |
| Avg Losing Trade | -$177,419.86 |
| Profit Factor | 8.003 |
| Sortino Ratio | 11.486 |
| Win/Loss Ratio | 8.003 |
⚙️ Default Settings:
Slippage: 0 ticks
Commission: 0.333% (Bybit standard)
👥 V. Who Is This Strategy For?
✅ Long-term Bitcoin investors seeking stable, low-drawdown returns
✅ Traders tired of overtrading who prefer surgical, sniper-style precision entries
✅ Investors seeking psychological stability by avoiding large account swings
✅ Data-driven decision makers who value proven performance over marketing claims
🔒 VI. Access & Disclaimer
🔐 Access Type: Invite-Only (Protected Source Code)
💬 How to Get Access: Send a private message or leave a comment below
⚠️ Important Disclaimer:
Past performance does not guarantee future results. Cryptocurrency and futures trading involve substantial risk of loss. This strategy is provided for educational and informational purposes only. Users should conduct their own research and consult with a financial advisor before making investment decisions. The author is not responsible for any financial losses incurred from using this strategy.
🏷️ VII. Tags
Bitcoin |Bitcoin | BTCUSD | BTCUSD.P | Bybit | DailyChart | LongTerm | TrendFollowing | ADX | NonRepainting | Strategy | BacktestProven | SevenYears | LowDrawdown | HighProfitFactor | StableReturns | CapitalPreservation | Ichimoku | DMI | SuperTrend | TechnicalAnalysis | Volatility | RiskManagement | AutoTrading | Futures | PerpetualFutures | AlgorithmicTrading | SystematicTrading | DataDriven | InviteOnly | ProtectedScript | SnipperTrading | HighConviction | MDD | SortinoRatio
📌 Note: This strategy is designed exclusively for Bybit BTCUSD.P perpetual futures on the 1-day (daily) timeframe. Performance may vary significantly on other symbols or timeframes.

[Camarilla Pivots] Signal Clean Up Analysis with Backtest (TSO)Camarilla Pivots NEW GEN Indicator!
This is a full-cycle trading system indicator, which uses Camarilla Pivots for generating signals using a custom developed algorithm, TP (Take Profit) and SL (Stop Loss) levels. There are 3 SOURCES for signals (each can be used separately or in combination or all 3 can be used at the same time, each signal SOURCE is using Camarilla Pivots levels to open optimal trade direction) with chained (NOTE: There are many potential profitable setups available, by combining clean up features availabe in the indicator settings!) signal cleanup and analysis approach with scheduling and alerting capabilities. Works best with shorter timeframes: 1M, 5M, 15M, 1H.
NOTE: Every calculation is done on a confirmed closed candle bar state, so the indicator will never repaint!
NOTE: At position open - there will be calculated Take-Profit and Stop-Loss targets, however each target is considered hit, when candle bar closes breaking that target, so Take-Profit and Stop-Loss when hit will slightly differ then what you see at position open!
===========================================================================
Explanation of all the Features | Configuration Guide | Indicator Settings | Signal Cleanup Analysis
---------------------------------------------------------------------------
>>> Customizable Backtesting for a specific date range, results via TradingView strategy, which includes “Deep Backtesting” for largest amounts of data on trading results.
>>> Trading Schedule with customizable trading daily time range, automatic closing/alert trades before Power Hour or right before market closes or leave it open until next day.
>>> 3 Trading Systems.
>>> Multiple Signal SOURCEs for opening trades, either SOURCE can be used or both at the same time!
>>> Static/Dynamic Stop-Loss setups (HIGHLIGHT: Stop-Loss will be moved to Entry after TP1 is taken, which minimizes risk).
>>> Single or Multiple profit targets (up to 5).
>>> Take-Profit customizable offset feature (set your Take-Profit targets slightly before everyone is expecting it!).
>>> Candle bar signal analysis (matching candle color, skip opposite structured and/or doji candle uncertain signals).
>>> Additional analysis of VWAP/EMA/ATR/EWO (Elliot Wave Oscillator)/Divergence MACD+RSI/Volume signal confirmation (clean up your chart with indicator showing only the best potential signals!).
>>> Advanced Alerts setup, which can be potentially setup with a trading bot over TradingView Webhook (NOTE: This will require advanced programming knowledge).
===========================================================================
Labels, plots, colors explanations:
---------------------------------------------------------------------------
>>>>> LONG open: green "house" looking arrow below candle bar.
>>>>> SHORT open: red "house" looking arrow above candle bar.
>>>>> LONG/SHORT take-profit target: green/red circles (multi-profit > TP2/3/4/5 smaller circles).
>>>>> LONG/SHORT stop-loss target: green/red + crosses.
>>>>> LONG/SHORT take-profit hits: green/red diamonds.
>>>>> LONG/SHORT stop-loss hits: green/red X-crosses.
>>>>> LONG/SHORT EOD (End of Day | Intraday style) close (profitable trade): green/red squares.
>>>>> LONG/SHORT EOD (End of Day | Intraday style) close (loss trade): green/red PLUS(+)-crosses.
===========================================================================
Date Range and Trading Schedule Settings
---------------------------------------------------------------------------
>>>>> Date Range: Select your start and/or end dates (uncheck “End” for indicator to show results up to the very moment and to use for LIVE trading) for backtesting results, if not using backtesting – uncheck “Start”/“End” to turn it off.
>>>>> Use TradingView “Strategy Tester” to see backtesting results
NOTE: If Strategy Tester does not show any results with Date Ranged fully unchecked, there may be an issue where a script opens a trade, but there is not enough TradingView power to set the Take-Profit and Stop-Loss and somehow an open trade gets stuck and never closes, so there are “no trades present”. In such case you will need to manually check “Start”/“End” dates or use “Depp Backtesting” feature!
>>>>> Trading Schedule: This is where you can setup Intraday Session or any custom session schedule you wish. Turn it ON. Select trading hours. Select EOD (End of Day) setting (NOTE: If it will be OFF, the indicator will assume you are holding your position open until next day!). Please note the EOD trade closure times with the 2 different Intraday close settings when turned on:
At Market Close:
1/3/5min > will close at 15:55pm ET
15min > will close at 15:45pm ET
30min > will close at 15:30pm ET
45min > will close at 15:45pm ET
60min > will close at 15:00pm ET
Before Power Hour:
1/3/5min > will close at 15:00pm ET
15min > will close at 15:00pm ET
30min > will close at 15:00pm ET
45min > will close at 15:00pm ET
60min > will close at 15:00pm ET
>>> Trading Systems: 1) "Open Until Closed by TP or SL": the signal will only open a trade if no trades are currently open/trunning, a trade can only be closed by Take Profit, Stop Loss or End of Day close (if turned on) | 2) "Open Until Closed by TP or SL + OCA": Same as 1), but if there is an opposite signal to the trade which is currently open > it will immediately be closed with new trade open or End of Day close (if turned on) | 3) "OCA (no TP or SL)": There are is Take Profit or Stop Loss, only an opposite signal will close current trade and open an opposite one or End of Day close (if turned on).
>>> Position Open sources:
>>>>> Position Open - SOURCE1 | LONG: S3, SL: S4, TP1: R3, TP2: R4, TP3: R5, TP4/5: Smart Formula | SHORT: R3, SL: R4, TP1: S3, TP2: S4, TP3: S5, TP4/5: Smart Formula
>>>>> Position Open - SOURCE2 | LONG: R4, SL: R3, TP1: R5, TP2/3/4/5: Smart Formula | SHORT: S4, SL: S3, TP1: S5, TP2/3/4/5: Smart Formula
>>>>> Position Open - SOURCE3 | LONG: R5, SL: R4, TP1/2/3/4/5: Smart Formula | SHORT: S5, SL: S4, TP1/2/3/4/5: Smart Formula
>>> Turn On/Off: Current Position SL + Opposite Position Open Signal on the same closing candle bar (If current trade hits Stop-Loss and at that same closing candle bar there is a signal for an opposite direction trade > indicator will close current position as Stop-Loss and immediately open an opposite position). NOTE: With this option turned on, there will be more trades, but not necessarily better results, since after Stop-Loss is hit, it may make sense to wait a little before opening an opposite trade, even if it matches the condition at the same time when Stop-Loss is hit, but sometimes it shows great results, so this setting/feature is included.
>>> Turn On/Off: Turn On/Off: Current Position REGULAR SL | Only the SL + Opposite Position Open will trigger if turned on, IF NOT - THERE WILL BE NO STOP-LOSS AT ALL!!! NOTE: It is very dangerous to trade without Stop-Loss!
>>>>> Signal Candle Bar consuming Take-Profits - position/trade signal candle bar is big enought to "consume"/close ahead the first TP setting > the signal can either be skipped, or all Take-Profit areas pushed ahead using smart formula)
>>>>> MULTIPROFIT | TP (Take-Profit) System: Once the trade is open, all Take-Profit target(s) are immediately calculated and set for the trade > once the target(s) is hit > trade will be partially closed (if candle bar closes beyond several Take-Profit targets > trade will be reduced accordingly to the amount of how many Take-Profit targets were hit)
>>>>> MULTIPROFIT | SL (Stop-Loss) System: 1) Static – Once the trade is open, Stop-Loss is calculated and set for the remaining of the trade ||| 2) Dynamic – At trade open, Stop-Loss is calculated and set the same way, however once 1st Take-Profit is taken > Stop-Loss is moved to Entry, reducing the risk.
>>>>> # of TPs (number of take profit targets): Just like it is named, this is where you select the number of Take-Profit targets for your trading system (NOTE: If "OCA (no TP or SL)" Trading System is selected, this setting won’t do anything, since there are no TP or SLs for that system).
>>>>> TP(s) offset: This is a special feature for all Take-Profit targets, where you can turn on a customizable offset, so that if the price is almost hitting the Take-Profit target, but never actually touches it > you will capture it. This is good to use with HHLL (Highest High Lowest Low), which is pretty much a Support/Resistance as often the price will nearly touch these strong areas and turn around…
===========================================================================
Signal Analysis and Cleanup Settings
---------------------------------------------------------------------------
>>>>> Candle Analysis | Candle Color signal confirmation: If closed candle bar color does not match the signal direction > no trade will be open.
>>>>> Candle Analysis | Skip opposite candle signals: If closed candle bar color will match the signal direction, but candle structure will be opposite (for example: bearish green hammer, long high stick on top of a small green square) > no trade will be open.
>>>>> Candle Analysis | Skip doji candle signals: If closed candle bar will be the uncertain doji > no trade will be open.
>>>>> Divergence/Oscillator Analysis | EWO (Elliot Wave Oscillator) signal confirmation: LONG will only be open if at signal, EWO is green or will be at bullish slope (you can select which setting you desire), SHORT if EWO is red or will be at bearish slope.
>>>>> Divergence/Oscillator Analysis | VWAP signal confirmation: LONG will only be open if at signal, the price will be above VWAP, SHORT if below.
>>>>> Divergence/Oscillator Analysis | Moving Average signal confirmation: LONG will only be open if at signal, the price will be above selected Moving Average, SHORT if below.
>>>>> Divergence/Oscillator Analysis | ATR signal confirmation: LONG will only be open if at signal, the price will be above ATR, SHORT if below.
>>>>> Divergence/Oscillator Analysis | RSI + MACD signal confirmation: LONG will only be open if at signal, RSI + MACD will be bullish, SHORT if RSI + MACD will be bearish.
>>>>> Volume signal confirmation: LONG/SHORT will only be opened with strong Volume matching the signal direction, by default, strong Volume percentage is set to 150% and weak to 50%, but you can change it as you desire.
===========================================================================
||||||||||||||||||||||||||||||||||| *** ||||||||||||||||||||||||||||||||||| *** |||||||||||||||||||||||||||||||||||
||||||||||||||||||||||||||||||||||| *** ||||||||||||||||||||||||||||||||||| *** |||||||||||||||||||||||||||||||||||
TP System - VERY IMPORTANT INFO!
-------------------------------------------------------------------------------------------------------------------
"TP PERCENTAGE" - amount by which current trade/position needs to be reduced/partially closed/sold.
-------------------------------------------------------------------------------------------------------------------
TP System: Dynamic
"TP PERCENTAGE" - will always be the same amount (trade/position size divided by the # of take-profit(TP) targets) and percentage to be closed will always be of the ORIGINAL trade/position.
-------------------------------------------------------------------------------------------------------------------
TP System: Static
"TP PERCENTAGE" - will always be the same amount IF take-profit(TP) targets are hit 1-by-1 (TP1 > TP2 > TP3 > TP4 > TP5), otherwise it will vary and unless it is a 1st take-profit(TP1), the REMAINING trade/position size will always be smaller than original and therefore the percentage to be closed will always be of the REMAINING trade/position and NOT the original one!
-------------------------------------------------------------------------------------------------------------------
"TP PERCENTAGE" CheatSheet (these are the only percentages you may see)
-----------------------------------------------------------------------
TP PERCENTAGE---Close/Sell Amount-------------Example (trade size: 50 stocks)
20%-------------trade size * 0.2--------------50 * 0.2 = 10 stocks
25%-------------trade size * 0.25-------------50 * 0.25 = 12.5(~13) stocks
34%-------------trade size * 0.34-------------50 * 0.34 = 17 stocks
40%-------------trade size * 0.4--------------50 * 0.4 = 20 stocks
50%-------------trade size * 0.5--------------50 * 0.5 = 25 stocks
60%-------------trade size * 0.6--------------50 * 0.6 = 30 stocks
66%-------------trade size * 0.66-------------50 * 0.66 = 33 stocks
75%-------------trade size * 0.75-------------50 * 0.75 = 37.5(~38) stocks
80%-------------trade size * 0.8--------------50 * 0.8 = 40 stocks
100%------------trade size--------------------50 = 50 stocks
-----------------------------------------------------------------------
If for any reason a portion of the current/remaining trade closed at such occurrence was slightly wrong, it is not an issue. Such occurrences are rare and with slight difference in partial TP closed is not significant to overall performance of our algorithms.
||||||||||||||||||||||||||||||||||| *** ||||||||||||||||||||||||||||||||||| *** |||||||||||||||||||||||||||||||||||
||||||||||||||||||||||||||||||||||| *** ||||||||||||||||||||||||||||||||||| *** |||||||||||||||||||||||||||||||||||
Alert Settings (you don’t have to touch this section unless you will be using TradingView alerts through a Webhook to use with trading bot)
---------------------------------------------------------------------------
Here is how a LONG OPEN alert looks like.
NOTE: Each label , , etc. is customizable, you can change the text of it within indicator Input settings.
ALERT >>>>>>>>>>>>>>>>>>>>>>>>>>>>>>>>>>>>>>>>>>>>>>>
COIN: BTCUSD
TIMEFRAME: 15M
LONG: OPEN
ENTRY: 20000
TP1: 20500
TP2: 21000
TP3: 21500
TP4: 22500
TP5: 23500
SL: 19000
Leverage: 0
---------------------------------------------------------------------------
Here is how a TP1 alert will look with 5 TPs breakdown of the trade.
NOTE1: Next to TP1 taken it will show at which price it was triggered.
NOTE2: Next to "TP Percentage" it shows how much of the CURRENT/ACTIVE/REMAINING trade needs to be closed.
NOTE2: If TP2/3/4/5 comes before TP1 - the alert will tell you exactly how many percent of the trade needs to be closed!
ALERT >>>>>>>>>>>>>>>>>>>>>>>>>>>>>>>>>>>>>>>>>>>>>>>
COIN: BTCUSD
TIMEFRAME: 15M
LONG: TP1
TP1: 20500
TP Percentage: 20%
---------------------------------------------------------------------------
Here is how an alert will look for LONG - STOP-LOSS.
ALERT >>>>>>>>>>>>>>>>>>>>>>>>>>>>>>>>>>>>>>>>>>>>>>>
COIN: BTCUSD
TIMEFRAME: 15M
ENTRY: 20000
LONG: SL
SL: 19000
---------------------------------------------------------------------------
Here is how an alert will look for LONG - EOD (End of Day) In Profit close.
ALERT >>>>>>>>>>>>>>>>>>>>>>>>>>>>>>>>>>>>>>>>>>>>>>>
COIN: BTCUSD
TIMEFRAME: 15M
LONG: EOD-Close (profit)
ENTRY: 20000
EOD-Close: 21900
===========================================================================
Adding Alerts in TradngView
---------------------------------------------------------------------------
-Add indicator to chart and make sure it is configured (check back-testing results)
-Right-click anywhere on the TradingView chart
-Click on Add alert
-Condition: Select this indicator by it’s name
-Alert name: Whatever you want
-Hit “Create”
-Note: If you change ANY Settings within the indicator – you must DELETE the current alert and create a new one per steps above, otherwise it will continue triggering alerts per old Settings!
===========================================================================
If you have any questions or issues with the indicator, please message me directly via TradingView.
---------------------------------------------------------------------------
Good Luck! (NOTE: Trading is very risky, past performance is not necessarily indicative of future results, so please trade responsibly!)
---------------------------------------------------------------------------
NOTE: There seems to be a strange glitch when strategy is running live, it will show "double-take" take-profits labels on the chart. This is not affecting the script logic and backtesting results, if you will remove/re-add the script afterwards, it will no longer show the duplicate orders... this must be some sort of a glitch as every alert was thoroughly tested to make sure everything is working!

[Volume Profile] Signal Clean Up Analysis with Backtest (TSO) This is a full-cycle trading system indicator, which uses Volume Profile for generating signals using a custom developed algorithm, TP (Take Profit) and SL (Stop Loss) levels. There are 2 SOURCES for signals (each can be used separately or both can be used at the same time, each signal SOURCE is using Volume Profile levels to open optimal trade direction) with chained (NOTE: You can select several or ALL of the features, this is not limited to either one) signal cleanup and analysis approach with scheduling and alerting capabilities. Works with most popular timeframes: 1M, 5M, 15M, 1H, 4H, D, great for intraday trading!
NOTE: Every calculation is done on a confirmed closed candle bar state, so the indicator will never repaint!
===========================================================================
Explanation of all the Features | Configuration Guide | Indicator Settings | Signal Cleanup Analysis
---------------------------------------------------------------------------
>>> Customizable Backtesting for a specific date range, results via TradingView strategy, which includes “Deep Backtesting” for largest amounts of data on trading results.
>>> Trading Schedule with customizable trading daily time range, automatic closing/alert trades before Power Hour or right before market closes or leave it open until next day.
>>> 3 Trading Systems.
>>> Multiple Signal SOURCEs for opening trades, either SOURCE can be used or both at the same time!
>>> Static/Dynamic Stop-Loss setups (HIGHLIGHT: Stop-Loss will be moved to Entry after TP1 is taken, which minimizes risk).
>>> Single or Multiple profit targets (up to 3).
>>> Take-Profit customizable offset feature (set your Take-Profit targets slightly before everyone is expecting it!).
>>> Candle bar signal analysis (matching candle color, skip opposite structured and/or doji candle uncertain signals).
>>> Additional analysis of VWAP/EMA/ATR/EWO (Elliot Wave Oscillator)/Divergence MACD+RSI/Volume signal confirmation (clean up your chart with indicator showing only the best potential signals!).
>>> Advanced Alerts setup, which can be potentially setup with a trading bot over TradingView Webhook (NOTE: This will require advanced programming knowledge).
===========================================================================
Labels, plots, colors explanations:
---------------------------------------------------------------------------
>>>>> Signal SOURCE(s): Green/Red arrows, which will be shown unconditionally, outside of trade engine and can be hidden if desired.
>>>>> LONG open: green "house" looking arrow below candle bar.
>>>>> SHORT open: red "house" looking arrow above candle bar.
>>>>> LONG/SHORT take-profit target: green/red circles (multi-profit > TP2/3/4/5 smaller circles).
>>>>> LONG/SHORT take-profit hits: green/red diamonds.
>>>>> LONG/SHORT stop-loss target: green/red + crosses.
>>>>> LONG/SHORT stop-loss hits: green/red X-crosses.
>>>>> LONG/SHORT EOD close (profitable trade): green/red squares.
>>>>> LONG/SHORT EOD close (loss trade): green/red PLUS(+)-crosses.
===========================================================================
Date Range and Trading Schedule Settings
---------------------------------------------------------------------------
>>>>> Date Range: Select your start and/or end dates (uncheck “End” for indicator to show results up to the very moment and to use for LIVE trading) for backtesting results, if not using backtesting – uncheck “Start”/“End” to turn it off.
>>>>> Use TradingView “Strategy Tester” to see backtesting results
NOTE: If Strategy Tester does not show any results with Date Ranged fully unchecked, there may be an issue where a script opens a trade, but there is not enough TradingView power to set the Take-Profit and Stop-Loss and somehow an open trade gets stuck and never closes, so there are “no trades present”. In such case you will need to manually check “Start”/“End” dates or use “Depp Backtesting” feature!
>>>>> Trading Schedule: This is where you can setup Intraday Session or any custom session schedule you wish. Turn it ON. Select trading hours. Select EOD (End of Day) setting (NOTE: If it will be OFF, the indicator will assume you are holding your position open until next day!).
>>> Trading Systems: 1) "Open Until Closed by TP or SL": the signal will only open a trade if no trades are currently open/trunning, a trade can only be closed by Take Profit, Stop Loss or End of Day close (if turned on) | 2) "Open Until Closed by TP or SL + OCA": Same as 1), but if there is an opposite signal to the trade which is currently open > it will immediately be closed with new trade open or End of Day close (if turned on) | 3) "OCA (no TP or SL)": There are is Take Profit or Stop Loss, only an opposite signal will close current trade and open an opposite one or End of Day close (if turned on)
>>>>> MULTIPROFIT | TP (Take-Profit) System: Once the trade is open, all Take-Profit target(s) are immediately calculated and set for the trade > once the target(s) is hit > trade will be partially closed (if candle bar closes beyond several Take-Profit targets > trade will be reduced accordingly to the amount of how many Take-Profit targets were hit)
>>>>> MULTIPROFIT | SL (Stop-Loss) System: 1) Static – Once the trade is open, Stop-Loss is calculated and set for the remaining of the trade ||| 2) Dynamic – At trade open, Stop-Loss is calculated and set the same way, however once 1st Take-Profit is taken > Stop-Loss is moved to Entry, reducing the risk.
>>>>> # of TPs (number of take profit targets): Just like it is named, this is where you select the number of Take-Profit targets for your trading system (NOTE: If "OCA (no TP or SL)" Trading System is selected, this setting won’t do anything, since there are no TP or SLs for that system).
>>>>> TP(s) offset: This is a special feature for all Take-Profit targets, where you can turn on a customizable offset, so that if the price is almost hitting the Take-Profit target, but never actually touches it > you will capture it. This is good to use with HHLL (Highest High Lowest Low), which is pretty much a Support/Resistance as often the price will nearly touch these strong areas and turn around…
===========================================================================
Take-Profit and Stop-Loss visual example:
---------------------------------------------------------------------------
1) A simply nice intraday trading day for SPY (S&P500 ETF TRUST) with a single Take-Profit target on each trade.
See how Take-Profit distances increase with price momentum and how Stop-Loss is following the trade reducing the risk!
2) Same intraday trading day for SPY (S&P500 ETF TRUST) with 3 Take-Profit targets with static Stop-Loss.
3) Same intraday trading day for SPY (S&P500 ETF TRUST) with 3 Take-Profit targets with dynamic Stop-Loss.
You can see how Stop-Loss was moved once TP1 is taken!
===========================================================================
Trade Analysis and Cleanup Settings
---------------------------------------------------------------------------
>>>>> Candle Analysis | Candle Color signal confirmation: If closed candle bar color does not match the signal direction > no trade will be open.
>>>>> Candle Analysis | Skip opposite candle signals: If closed candle bar color will match the signal direction, but candle structure will be opposite (for example: bearish green hammer, long high stick on top of a small green square) > no trade will be open.
>>>>> Candle Analysis | Skip doji candle signals: If closed candle bar will be the uncertain doji > no trade will be open.
>>>>> Divergence/Oscillator Analysis | EWO (Elliot Wave Oscillator) signal confirmation: LONG will only be open if at signal, EWO is green or will be at bullish slope (you can select which setting you desire), SHORT if EWO is red or will be at bearish slope.
>>>>> Divergence/Oscillator Analysis | VWAP signal confirmation: LONG will only be open if at signal, the price will be above VWAP, SHORT if below.
>>>>> Divergence/Oscillator Analysis | Moving Average signal confirmation: LONG will only be open if at signal, the price will be above selected Moving Average, SHORT if below.
>>>>> Divergence/Oscillator Analysis | ATR signal confirmation: LONG will only be open if at signal, the price will be above ATR, SHORT if below.
>>>>> Divergence/Oscillator Analysis | RSI + MACD signal confirmation: LONG will only be open if at signal, RSI + MACD will be bullish, SHORT if RSI + MACD will be bearish.
>>>>> Volume signal confirmation: LONG/SHORT will only be open if closing candle volume is 150% above average Volume based on the Volume Length.
===========================================================================
Alert Settings (you don’t have to touch this section unless you will be using TradingView alerts through a Webhook to use with trading bot)
---------------------------------------------------------------------------
Here is how a LONG OPEN alert looks like (each label is customizable + I can add up more items/labels if needed):
COIN: BTCUSD
TIMEFRAME: 15M
LONG: OPEN
ENTRY: 20000
TP1: 20500
TP2: 21000
TP3: 21500
SL: 19000
Leverage: 0
===========================================================================
Adding Alerts in TradngView
---------------------------------------------------------------------------
-Right-click anywhere on the TradingView chart
-Click on Add alert
-Condition: Select this indicator by it’s name
-Alert name: Whatever you want
-Hit “Create”
-Note: If you change ANY Settings within the indicator – you must DELETE the current alert and create a new one per steps above, otherwise it will continue triggering alerts per old Settings!
===========================================================================
If you have any questions or issues with the indicator, please message me directly via TradingView.
---------------------------------------------------------------------------
Good Luck! (NOTE: Trading is very risky, past performance is not necessarily indicative of future results, so please trade responsibly!)

[SMA Cross + HHLL] Signal Clean Up Analysis with Backtest (TSO) This is a DEMO indicator with a simple 2 SMAs cross for signals + HHLL for TP/SL. It mainly demonstrates chained (NOTE: You can select several or ALL of the features, this is not limited to either one) signal cleanup and analysis approach with scheduling and alerting capabilities. Works with most popular timeframes: 1M, 5M, 15M, 1H, 4H, D.
===========================================================================
Here are some pre-set examples with nice Backtesting results (try em out!):
---------------------------------------------------------------------------
>>> Indexes – SPY (INTRADAY SETUP ): Timeframe: 5M | Trading Schedule: ON, 10:00-15:45 ET, EOD: At Market Close | Trading System: Open Until Closed by TP or SL | MULTIPROFIT: TP (take profit) System: Dynamic | MULTIPROFIT: SL (stop loss) System (This is only for “Dynamic” TP System ONLY!!!): Dynamic | # of TPs: 5 | Skip opposite candle types in signals, which are opposite to direction of candle color (for example: bearish green hammer) | Everything else: Default
>>> Bitcoin – BTCUSD (24/7 SETUP): Timeframe: 1H | Trading Schedule: OFF, End of Day (EOD): OFF | Trading System: Open Until Closed by TP or SL | MULTIPROFIT: TP (take profit) System: Dynamic | MULTIPROFIT: SL (stop loss) System (This is only for “Dynamic” TP System ONLY!!!): Dynamic | # of TPs: 3 | TP(s) Offset: on, TP(s) offset amount: 50 | ATR confirmation | Everything else: Default
===========================================================================
Explanation of all the Features | Configuration Guide | Indicator Settings
---------------------------------------------------------------------------
---------------------------------------------------------------------------
Signal cleanup analysis:
---------------------------------------------------------------------------
>>> Customizable Backtesting for a specific date range, results via TradingView strategy, which includes “Deep Backtesting” for largest amounts of data on trading results.
>>> Trading Schedule with customizable trading daily time range, automatic closing/alert trades before Power Hour or right before market closes or leave it open until next day.
>>> 3 Trading Systems.
>>> Static/Dynamic Take-Profit setups (HILIGHT: momentum catch dynamic Take-Profit approach).
>>> Static/Dynamic Stop-Loss setups (HIGHLIGHT: smart trailing Stop-Loss which minimizes risk).
>>> Single or Multiple profit targets (up to 5).
>>> Take-Profit customizable offset feature (set your Take-Profit targets slightly before everyone is expecting it!).
>>> Candle bar signal analysis (skip opposite structured and/or doji candle uncertain signals).
>>> Additional analysis of VWAP/EMA/ATR/EWO (Elliot Wave Oscillator)/Divergence MACD+RSI signal confirmation (clean up your chart with indicator showing only the best potential signals!).
>>> Advanced Alerts setup, which can be potentially setup with a trading bot over TradingView Webhook (NOTE: This will require advanced programming knowledge).
>>> Customize your signal SOURCE and your Take-Profit/Stop-Loss SOURCES as you desire.
===========================================================================
Labels, plots, colors explanations:
---------------------------------------------------------------------------
>>>>> Signal SOURCE: SMA crossings (green and red BIG circles) .
>>>>> Take-profit/Stop-loss SOURCE: HHLL (Highest High Lowest Low) .
>>>>> LONG open: green arrow below candle bar.
>>>>> SHORT open: red arrow above candle bar.
>>>>> LONG/SHORT take-profit target: green/red circles (multi-profit > TP2/3/4/5 smaller circles).
>>>>> LONG/SHORT take-profit hits: green/red diamonds.
>>>>> LONG/SHORT stop-loss target: green/red + crosses.
>>>>> LONG/SHORT stop-loss hits: green/red X-crosses.
>>>>> LONG/SHORT EOD close (profitable trade): green/red squares.
>>>>> LONG/SHORT EOD close (loss trade): green/red PLUS(+)-crosses.
===========================================================================
Date Range and Trading Schedule Settings
---------------------------------------------------------------------------
>>>>> Date Range: Select your start and/or end dates (uncheck “End” for indicator to show results up to the very moment and to use for LIVE trading) for backtesting results, if not using backtesting – uncheck “Start”/“End” to turn it off.
---------------------------------------------------------------------------
>>>>> Use TradingView “Strategy Tester” to see backtesting results
---------------------------------------------------------------------------
NOTE: If Strategy Tester does not show any results with Date Ranged fully unchecked, there may be an issue where a script opens a trade, but there is not enough TradingView power to set the Take-Profit and Stop-Loss and somehow an open trade gets stuck and never closes, so there are “no trades present”. In such case you will need to manually check “Start”/“End” dates or use “Depp Backtesting” feature!
---------------------------------------------------------------------------
>>>>> Trading Schedule: This is where you can setup Intraday Session or any custom session schedule you wish. Turn it ON. Select trading hours. Select EOD (End of Day) setting (NOTE: If it will be OFF, the indicator will assume you are holding your position open until next day!).
>>>>> Trading System: 1) Open Until Closed by TP or SL – once the trade is open, it can only be closed by Take-Profit, Stop-Loss or at EOD (if turned on) ||| 2) OCA – Opposite Trade will Open Closing Current Trade – Same as 1), except that when and if an OPPOSITE signal is received > indicator will close current trade immediately (profit or loss) and open a new one(NOTE: This will only happen with an OPPOSITE direction trade!) ||| 3) Open Until Opposite Signal or EOD (if turned on) – This approach is the simplest one, there are no Take-Profits or Stop-Losses, the trade is open until an OPPOSITE signal is received or until EOD (if turned on).
Take-Profit, Stop-Loss and Multi-Profit Settings
>>>>> MULTIPROFIT | TP (Take-Profit) System: 1) Static – Once the trade is open, all Take-Profit target(s) are immediately calculated and set for the trade > once the target(s) is hit > trade will be partially closed (if candle bar closes beyond several Take-Profit targets > trade will be reduced accordingly to the amount of how many Take-Profit targets were hit) ||| 2) Dynamic – Once the trade is open, only the 1st Take-Profit target is calculated, once the 1st Take-Profit is hit > next Take-Profit distance is calculated based on the distance from trade Entry to where 1st Take-Profit was taken, once 2nd Take-Profit is taken > 3rd Take-Profit is calculated per same logic, these are good for price momentum as with price speeding up – profits increase as well!
NOTE: Below 2 settings, each correspond to only 1 setting of the TP (Take-Profit) System, please pay attention to the above TP system setting before changing SL settings!
>>>>> MULTIPROFIT | SL (Stop-Loss) System : 1) Static – Once the trade is open, Stop-Loss is calculated and set for the remaining of the trade ||| 2) Dynamic – At trade open, Stop-Loss is calculated and set the same way, however once 1st Take-Profit is taken > Stop-Loss is moved to Entry, reducing the risk.
>>>>> MULTIPROFIT | SL (Stop-Loss) System : 1) Static - Once the trade is open, Stop-Loss is calculated and set for the remaining of the trade ||| 2) Dynamic – At trade open, Stop-Loss is calculated and set the same way, however with each Take-Profit taken, Stop-Loss will be moved to previous Take-Profit (TP1 taken > SL:Entry | TP2 taken > SL:TP1 | TP3 taken > SL:TP2 | TP4 taken > SL:TP3 | TP5 taken > trade closed), this is basically a smart Stop-Loss trailing system!
>>>>> # of TPs (number of take profit targets): Just like it is named, this is where you select the number of Take-Profit targets for your trading system (NOTE: If “3) Open Until Opposite Signal or EOD (if turned on)” Trading System is selected, this setting won’t do anything, since there are no TP or SLs for that system).
>>>>> TP(s) offset: This is a special feature for all Take-Profit targets, where you can turn on a customizable offset, so that if the price is almost hitting the Take-Profit target, but never actually touches it > you will capture it. This is good to use with HHLL (Highest High Lowest Low), which is pretty much a Support/Resistance as often the price will nearly touch these strong areas and turn around…
---------------------------------------------------------------------------
Dynamic/Static Take-Profit and Stop-Loss visual examples:
1) Fully Dynamic Take-Profit and Stop-Loss setup for BTCUSD
See how Take-Profit distances increase with price momentum and how Stop-Loss is following the trade reducing the risk!
2) Static/Dynamic, Static Take-Profit and Dynamic Stop-Loss setup for SPY (S&P500 ETF TRUST)
You can see a static Take-Profit set at position open, while Stop-Loss is semi-dynamic adjusting to Entry once TP1 target is taken!
3) Fully Static Take-Profit and Stop-Loss setup for SPY (S&P500 ETF TRUST)
This one is a fully static setup for both Take-Profit and Stop-Loss, you can also observe how trade is closed right before the Power Hour (trade can be closed right before Power Hour or right before Market Closes or left overnight as you desire).
---------------------------------------------------------------------------
Trade Analysis and Cleanup Settings
>>>>> Candle Analysis | Candle Color signal confirmation: If closed candle bar color does not match the signal direction > no trade will be open.
>>>>> Candle Analysis | Skip opposite candle signals: If closed candle bar color will match the signal direction, but candle structure will be opposite (for example: bearish green hammer, long high stick on top of a small green square) > no trade will be open.
>>>>> Candle Analysis | Skip doji candle signals: If closed candle bar will be the uncertain doji > no trade will be open.
>>>>> Divergence/Oscillator Analysis | EWO (Elliot Wave Oscillator) signal confirmation: LONG will only be open if at signal, EWO is green or will be at bullish slope (you can select which setting you desire), SHORT if EWO is red or will be at bearish slope.
>>>>> Divergence/Oscillator Analysis | VWAP signal confirmation: LONG will only be open if at signal, the price will be above VWAP, SHORT if below.
>>>>> Divergence/Oscillator Analysis | Moving Average signal confirmation: LONG will only be open if at signal, the price will be above selected Moving Average, SHORT if below.
>>>>> Divergence/Oscillator Analysis | ATR signal confirmation: LONG will only be open if at signal, the price will be above ATR, SHORT if below.
>>>>> Divergence/Oscillator Analysis | RSI + MACD signal confirmation: LONG will only be open if at signal, RSI + MACD will be bullish, SHORT if RSI + MACD will be bearish.
===========================================================================
Alert Settings (you don’t have to touch this section unless you will be using TradingView alerts through a Webhook to use with trading bot)
---------------------------------------------------------------------------
Here is how a LONG OPEN alert looks like (each label is customizable + I can add up more items/labels if needed):
COIN: BTCUSD
TIMEFRAME: 15M
LONG: OPEN
ENTRY: 20000
TP1: 20500
TP2: 21000
TP3: 21500
SL: 19000
Leverage: 0
===========================================================================
Trade Open Signal SOURCE + Take-Profit/Stop-Loss SOURCE
---------------------------------------------------------------------------
>>> Customize your signal SOURCE, Take-Profit and Stop-Loss SOURCE as desired (NOTE: These are pre-configured and should be usable on majority of markets, however feel free to play around with these settings as there is nearly an infinite amount of setups out there!
===========================================================================
Adding Alerts in TradngView
---------------------------------------------------------------------------
-Right-click anywhere on the TradingView chart
-Click on Add alert
-Condition: Select this indicator by it’s name
-Alert name: Whatever you want
-Hit “Create”
-Note: If you change ANY Settings within the indicator – you must DELETE the current alert and create a new one per steps above, otherwise it will continue triggering alerts per old Settings!
===========================================================================
If you have any questions or issues with the indicator, please message me directly via TradingView.
---------------------------------------------------------------------------
Good Luck! (NOTE: Trading is very risky, so please trade responsibly!)

Trend Movement S1-TMIdea:
This script combines: Moving Average (MA), Directional Movement (DMI), MACD
When condition of long or short position from all mentioned indicator are met script opens position. Once trend changes, it closes the position.
Then add some filter conditions to avoid noise.
Concept:
(Note that we take the close to get the closing price)
-Using only cross up down with MA will give a reversal point, but the downside is that it can be noisy.
-MACD will show the current trend detected by cross point.
-Then the +DI , -DI , ADX values are taken into account to confirm the price direction and movement strength.
-This strategy solves this problem by combining 2 more moving averages called 2 trend lines 1 long and 1 short. When the short line crosses up, it will show that the price trend is increasing (at this time the background between these 2 lines will be green) and vice versa (red). To determine if the current trend is bullish or bearish . This will avoid buying when price tend to go down.
-However, there will be many points where some more complex logic is needed. It will add conditions and calculate the probabilities before triggering the signals (You can see them through the item symbols B1, B2, ... ).
How it works:
1. The thin line is stand for short term moving average, and the thick line is stand for long term moving average.
If thin lines cross the thick lines, their color and background will turn green, the price is tend to go up (Uptrend).
If thin lines cross down thick lines, their color and background will turn red, the price is tend to go down (Downtrend).
2. Ability to check the checkbox in setting to show the Golden/De*ath cross.
The yellow symbol "+" is the Golden cross.
The black symbol "+" is the De*th cross.
3. Buy and Sell are show clearly on strategy as the buy and sell point. The default source from bar is CLOSE
4. Setting "Buy only" it using for spot market.
5. When "Not buy in down trend" is checked, it will not trigger buy when in down trend (thin lines cross down thick lines like description in 1.)
6. Setting High spread will call Close buy when it match the High spread bar with the High spread % value
7. It provides setting "Back test From date/To date" for backtest feature. You can set "BacktestFrom date" as the begin of test period. If check box "Using To Date" is check: "Backtest To Date" will be the end of test period.
Suitable time frames:
4h, 1D, 1W
* Please note that this logic does not attempt to predict future prices or 100% accurate signal; Strategy Tester are available to test the profitability of this strategy.
(INVITE ONLY indicator. Please direct message or visit website to try it out)
Hope you guys enjoy!
Examples:
BTCUSD 4H
TSLA 4H

Miyagi (VWAP) + DCA BacktestVWAP has been the main condition for entry for our trading community when using the Wick Hunter bot for quite some time now; however using VWAP alone can lead to poor entries and bags.
Miyagi adds filtering conditions which can then be used to improve entries as opposed to simply using VWAP alone.
Miyagi: The attempt at mastering something for the best results.
Miyagi indicators combine multiple trigger conditions and place them in one toolbox for traders to easily use, produce alerts, backtest, reduce risk and increase profitability.
Miyagi (VWAP) + DCA Backtest allows you to backtest your VWAP settings across each pair.
VWAP + Backtest starts with the user selectable take profit and stoploss, both in percent.
Backtesting can be done in any trend direction: Long, Short, or both.
First we start with the VWAP Settings for entry.
The VWAP Settings are based off the original VWAP Indicator found here:
VWAP Timeframe can be adjusted to chart timeframe, or to another timeframe of choice.
VWAP Period is adjustable and should be set to your current period setting.
VWAP Lower Line (Long) is the Percentage Below VWAP = Long Entry.
VWAP Upper Line (Short) is the Percentage Above VWAP = Short Entry.
Once your VWAP Settings are now configured for your current trading settings, you can move onto the DCA and Backtest Settings.
Select DCA to allow and backtest DCA.
Equity %: allows you to select what percent of Equity you will use.
Leverage: Set the leverage you will trade at, from 1-100X.
DCA Start %: This is the percent that your DCA Starts at, in % away from initial entry.
Entry Order Size %: This is the entry order size, in percent of your account, that is used for entry.
DCA Order Size %: This is the DCA order size, in percent of your account, that is used for the first DCA.
DCA Order Size Scale %: This is the DCA size scaling, in %, that is applied to all DCA's after the first.
DCA % from Avg: This is the % away from Average DCA setting.
Step Size Scale %: This is the step size scale setting in percent, that is placed away from your first DCA.
DCA Buy Count: How many DCAs in total that can be used.
Properties Tab includes generic backtest settings including capital amount, base currency, order size, commission, slippage and margin.
Happy Trading!

VuManChu/Noski B Backtester (Gold Dot)This is a backtest version of Vumanchu's original script Market Cipher-B. All credit goes to his original coding.
This has been coded to backtest "Gold dot" entries only, so please keep that in mind when using.
Hope this is helpful!

VuManChu/Noski B Backtester (Divergence Green/Red Dot)This is a backtest version of Vumanchu's original script Market Cipher-B. All credit goes to his original coding.
This has been coded to backtest the alert conditions "Buy (Big green circle +div) and Sell (Big red circle + div)" entries only from the original Cipher B script, so please keep that in mind when using.
Hope this is helpful!

VuManChu/Noski B Backtester (Small Green/Red Dot)This is a backtest version of Vumanchu's original script Market Cipher-B. All credit goes to his original coding.
This has been coded to backtest Small Red/Green dot entries only, so please keep that in mind when using.
Hope this is helpful!

NoSKi MC-B Backtester (Green/Red Dot)This is a backtest version of Vumanchu's original script Market Cipher-B. All credit goes to his original coding.
This has been coded to backtest Red/Green dot entries only, so please keep that in mind when using.
Hope this is helpful!

Goose-X Auto Backtester Automated backtest strategy script for Goose-X 15 min indic. // Backtest purpose only
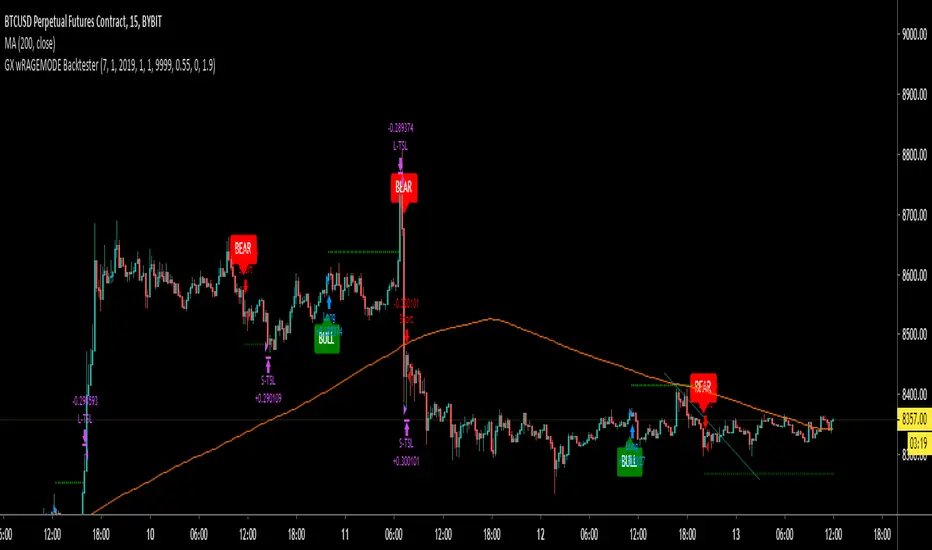
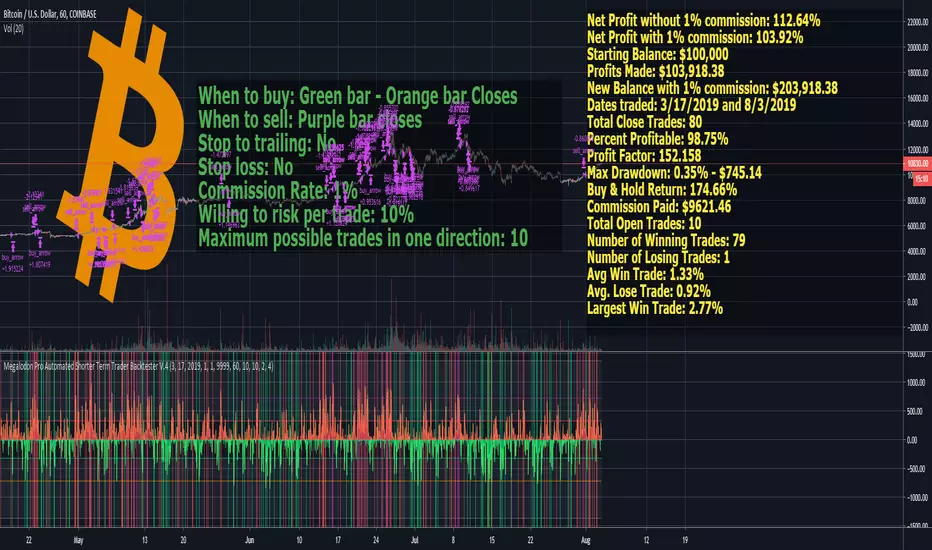
Megalodon Pro Automated Shorter Term Trader BacktesterSTRATEGY
When to buy: Green bar - Orange bar Closes
When to sell: Purple bar closes
Stop to trailing: No
Stop loss: No
Commission Rate: 1%
Willing to risk per trade: 10%
Maximum possible trades in one direction: 10
RESULTS
Net Profit without 1% commission: 112.64%
Net Profit with 1% commission: 103.92%
Starting Balance: $100,000
Profits Made: $103,918.38
New Balance with 1% commission: $203,918.38
Dates traded: 3/17/2019 and 8/3/2019
Total Close Trades: 80
Percent Profitable: 98.75%
Profit Factor: 152.158
Max Drawdown: 0.35% - $745.14
Buy & Hold Return: 174.66%
Commission Paid: $9621.46
Total Open Trades: 10
Number of Winning Trades: 79
Number of Losing Trades: 1
Avg Win Trade: 1.33%
Avg. Lose Trade: 0.92%
Largest Win Trade: 2.77%
Let me know what you guys think about the results?
Due to the tradingview's limitations on providing the shorter time frame price data, we had to provide a 60 minute time frame backtesting results.
The shorter time frames including 1 minute and 15 minutes backtesting results are way more accurate and precise than 60 minutes time frame results.
Megalodon Trading
Enlightening the Modern Investors
Cava Signals Backtesting v2Cava Signals Backtesting Strategy v2 (BTC)
This Pine Script strategy is designed for backtesting trading signals on BTC, built upon the Cava Signals v2 framework. It integrates multiple technical indicators to identify potential buy and sell opportunities, incorporating volume analysis, momentum, and trend-following mechanisms. The strategy supports customizable parameters for trade entry, exit, take-profit, stop-loss, and DCA (Dollar-Cost Averaging) logic, optimized for BTC trading. Ideal for traders looking to test and refine their approach in a backtesting environment, this script offers flexibility to adapt to various market conditions while focusing on disciplined trade management. Always backtest thoroughly and validate performance before live use.

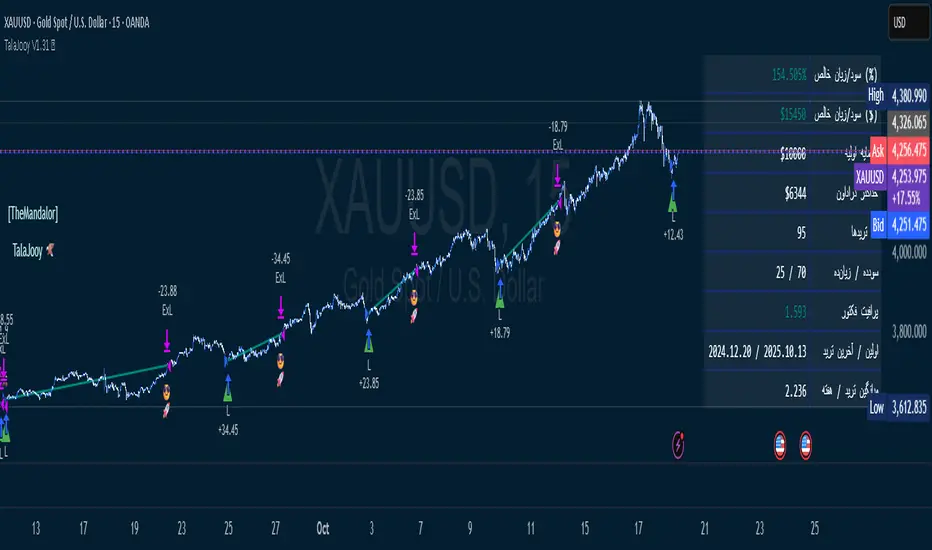
TalaJooy V1.31 𓅂💎 استراتژی معاملاتی TalaJooy V1.31 𓅂
TalaJooy (طلاجوی) یک چارچوب معاملاتی حرفهای و کامل برای TradingView است که برای حذف حدس و گمان، احساسات و تصمیمگیریهای هیجانی از فرآیند معاملات طراحی شده است.
این محصول یک «اندیکاتور سیگنالدهی» ساده نیست؛ بلکه یک استراتژی (Strategy) کامل است که چهار وظیفه کلیدی را به صورت خودکار انجام میدهد:
تحلیل بازار (بر اساس یک موتور امتیازدهی کمی)
صدور سیگنال (ورود و خروج شفاف)
مدیریت ریسک پویا (محاسبه خودکار حد ضرر)
مدیریت حجم پوزیشن (محاسبه خودکار حجم بر اساس ریسک)
هدف «طلاجوی» تبدیل معاملهگری شهودی به یک فرآیند مکانیکی، مبتنی بر داده و مدیریت ریسک است.
⚙️ قابلیتهای کلیدی (آنچه دریافت میکنید)
این استراتژی مجهز به مجموعهای از ابزارهای حرفهای است که مستقیماً روی چارت شما اجرا میشوند:
🎯 ۱. سیگنالهای ورود و خروج شفاف
فلشهای واضح خرید (▲) و فروش (▼) که نقاط دقیق ورود بر اساس منطق استراتژی را مشخص میکنند. این سیستم تنها زمانی سیگنال صادر میکند که فیلترهای روند، همسویی لازم را تایید کنند.
🛡️ ۲. مدیریت ریسک پویای ATR
بزرگترین چالش معاملهگران، تعیین حد ضرر (SL) مناسب است. این استراتژی حد ضرر را به صورت خودکار و پویا بر اساس نوسانات واقعی بازار (با استفاده از ATR) محاسبه میکند.
نتیجه: در بازارهای پرنوسان، استاپ شما برای جلوگیری از استاپهانت شدن، فاصله ایمنتری میگیرد و در بازارهای آرام، بهینهتر و نزدیکتر تنظیم میشود.
💰 ۳. محاسبه خودکار حجم پوزیشن
دیگر نیازی به «ماشین حساب پوزیشن» ندارید. استراتژی به صورت اتوماتیک، حجم دقیق هر معامله را بر اساس درصد ریسک ثابتی که شما از کل سرمایهتان تعیین میکنید، محاسبه مینماید. این ویژگی، مدیریت سرمایه حرفهای را در تمام معاملات شما تضمین میکند.
🎨 ۴. نواحی بصری سود و زیان (TP/SL)
هنگامی که یک معامله باز است، این ابزار به صورت زنده، نواحی حد سود (سبز) و حد ضرر (قرمز) را مشابه ابزار پوزیشن خود تریدینگ ویو، مستقیماً روی چارت برای شما رسم میکند.
📈 ۵. پنل آمار عملکرد پیشرفته
یک جدول آماری جامع که تمام معیارهای کلیدی عملکرد شما را به صورت زنده نمایش میدهد:
سود و زیان خالص (دلاری و درصدی)
ضریب سود (Profit Factor)
نرخ موفقیت (Win Rate)
تعداد معاملات سودده / زیانده
حداکثر افت سرمایه (Max Drawdown)
و موارد دیگر...
🚦 ۶. آیکونهای بازخورد معامله
با آیکونهای هوشمند، فوراً کیفیت معاملات بسته شده خود را ارزیابی کنید:
😎🚀 (سود ویژه و قابل توجه)
💰 (سود عادی)
🙈 (زیان)
📈 چگونه از این ابزار استفاده کنید؟
«طلاجوی» یک 'ماشین چاپ پول' جادویی نیست، بلکه یک ابزار تست و اجرای حرفهای است.
۱. بکتست و بهینهسازی (Backtesting)
مهمترین قدرت این اسکریپت، قابلیت Strategy بودن آن است. شما میتوانید این استراتژی را روی هر جفتارز و تایم فریمی که معامله میکنید (طلا، کریپتو، جفتارزها و...) بکتست بگیرید تا آمار عملکرد آن را مشاهده کنید.
۲. تنظیم پارامترها
از طریق منوی تنظیمات، پارامترهای کلیدی مانند درصد ریسک، نسبت ریسک به ریوارد (R:R)، و فیلترهای زمانی را مطابق با سبک معاملاتی و دارایی مورد نظر خود بهینهسازی کنید.
۳. اجرای سیستماتیک
پس از یافتن تنظیمات بهینه در بکتست، در معاملات زنده به سیگنالها پایبند بمانید و اجازه دهید منطق مکانیکی، معاملات شما را مدیریت کند.
⚠️ سلب مسئولیت مهم (مطابق با قوانین TradingView)
این اسکریپت صرفاً یک ابزار تحلیلی و معاملاتی است و نباید به عنوان سیگنال مالی یا توصیهای برای خرید و فروش تلقی شود. تمام معاملات دارای ریسک هستند و نتایج گذشته تضمینکننده عملکرد آینده نمیباشد.
لطفاً قبل از استفاده از این استراتژی در حساب واقعی، آن را به طور کامل در حالت دمو یا بکتست ارزیابی کنید. مسئولیت تمامی سودها و زیانها بر عهده خود معاملهگر است.
💎 TalaJooy V1.31 𓅂 Trading Strategy
TalaJooy (meaning "Gold Seeker") is a complete, professional trading framework for TradingView, designed to remove guesswork, emotion, and impulsive decisions from your trading process.
This is not a simple signal indicator; it is a complete Strategy script that automates four key tasks:
Market Analysis (Based on a quantitative scoring engine)
Signal Generation (Clear entries and exits)
Dynamic Risk Management (Automated Stop Loss calculation)
Position Sizing (Automated trade sizing based on risk)
The goal of "TalaJooy" is to transform intuitive trading into a mechanical, data-driven, and risk-managed process.
⚙️ Key Features (What You Get)
This strategy comes equipped with a suite of professional tools that run directly on your chart:
🎯 1. Clear Entry & Exit Signals
Receive unambiguous Buy (▲) and Sell (▼) arrows identifying precise entry points based on the strategy's logic. The system only generates signals when its trend-confirmation filters are aligned.
🛡️ 2. Dynamic ATR Risk Management
A trader's biggest challenge is setting a proper Stop Loss (SL). This strategy calculates your SL automatically and dynamically based on real-time market volatility (using ATR).
The Benefit: In volatile markets, your stop is placed at a safer distance to avoid being "stopped out" by noise. In calm markets, it's set tighter and more efficiently.
💰 3. Automated Position Sizing
Stop using external "position size calculators." The strategy automatically calculates the exact trade size for every position based on a fixed risk percentage of your total equity (which you define). This enforces professional money management on every trade.
🎨 4. Visual Profit & Loss (TP/SL) Zones
While a trade is active, this tool plots live, visual zones for your Take Profit (green) and Stop Loss (red) targets, similar to TradingView's native "Long/Short Position" tool.
📈 5. Advanced Performance Stats Panel
A comprehensive statistics table displays all your key performance metrics in real-time:
Net Profit (% and $)
Profit Factor
Win Rate
Win / Loss Trade Count
Max Drawdown
And more...
🚦 6. Smart Trade Feedback Icons
Instantly review the quality of your closed trades with intelligent emoji feedback:
😎🚀 (Exceptional Profit)
💰 (Standard Profit)
🙈 (Loss)
📈 How to Use This Tool
"TalaJooy" is not a "magic money machine"; it is a professional-grade tool for testing and execution.
1. Backtesting & Optimization
The most powerful feature of this script is its Strategy component. You can backtest it on any asset or timeframe you trade (Gold, Crypto, Forex, etc.) to see its historical performance data.
2. Parameter Tuning
Use the settings menu to optimize key parameters—such as Risk Percentage, Risk:Reward Ratio, and core filter settings—to match your personal trading style and preferred assets.
3. Systematic Execution
After identifying optimal settings via backtesting, adhere to the signals in your live trading and let the mechanical logic manage your trades.
⚠️ Important Disclaimer (TradingView Compliant)
This script is provided for educational and analytical purposes only. It is not financial advice or a recommendation to buy or sell any asset. All trading involves substantial risk. Past performance is not indicative of future results.
Please thoroughly evaluate this strategy via backtesting or paper trading before deploying it with real funds. The user assumes full responsibility for all profits and losses incurred.
Configurable BB+RSI+Aroon strategy backtest for binary optionsI wanted to share this strategy that I use myself for binary options trading. After trading binary options for several years I have learned that every single day is unique... assets behave differently every single day. So, when I start the day I want to know which is the optimum combination of parameters in my indicators that will give me the signals I want during the day and I get that by doing a quick backtest of the parameters combination in a specific asset that same day. When trading Binary Options I usually do 3 or 4 trades max per day and, yes, there are moments in which even with the right backtest data the signals fail (I strongly believe that there is no strategy that guarantees 100% success in any type of trade, and this one here is not an exception - but has worked well with some assets). So, here is my contribution to improve your productivity by automating a bit that backtesting part.
How this script works?
It is a simple price crossunder / crossover Bollinger Bands (BB) with a confirmation from RSI overbought / oversold signals and a fast Aroon. You will see the BB plotted with its confirmations:
(1) a blue circle that plots in the chart when the price is coming back inside the channel (within the Bollinger Bands)
(2) an orange square that plots in the chart when the RSI is coming back from the overbought or oversold areas
(3) a triangle that could be red or green depending on the Aroon confirmation: Red if Aroon Down is crossing down Aroon Up or green if vice versa.
The strategy will call for long (Call) if:
(1) the price is crossing over the lower band of the Bollinger Bands, coming back inside the channel
(2) Aroon Up is crossing or has crossed above Aroon Down
(3) RSI is crossing over the oversold limit
Consequently, the strategy will call for a short (Put) if:
(1) the price is crossing down the upper band of the Bollinger Bands, coming back inside the channel
(2) Aroon Down is crossing or has crossed below Aroon Up
(3) RSI is crossing under the overbought limit
You can configure:
1. Aroon length (keep it as fast as possible: 3, 4 or 5 are recommended values)
2. The point where Aroon Up and Aroon Down cross to make the signal valid (50 is by default. It could also be 25 or 75)
3. The RSI length
4. RSI Overbought and Oversold limits (they do not need to be symmetric: you can use 29 and 93, for example)
5. Bollinger Bands length and standard deviation
6. Number of bars to keep your option open. Depending on the timeframe used, this will determine the time you will keep your binary option open. If you are in a 1 min chart and keep this parameter in 3, then you will need to configure your binary option to expire in 3 minutes.
How to evaluate your backtest?
In Binary Options you only need the success rate, so what I do is that when I am manually updating the parameters I keep my strategy tester window open checking the winning trades vs losing trades ratio ("Percent Profitable"). I personally will only keep an asset monitored looking for signals that day if the Percent Profitable on the backtest of the same day is above 80%.
Regarding the code: it is open, public and free. No need to ask for permission if you want to copy+paste and use it in whole or parts.
Happy pip hunting!
-marco

NoNonsense Forex - high timeframe trading absurd NON-REPAINTINGSome time ago I bumped into NoNonsense Forex - pretty good-looking course with well-designed videos, reasonable rules, etc. Nice explanatory videos, not selling anything, building indicators-only strategy. But there was one thing that really annoyed me - it was supposed to work only on Daily timeframe. What is the point in trading such high timeframe, if decisions changing market direction are playing out within 1 minute? What is the point in evaluating trades from 1994 if we are 25 years later?
Anyway, I have developed this strategy, which is:
- non-repainting
- not using trailing-stop
- not using any other known TradingView backtest bugs
And I'm showing it as an example of OVERFITTING. Backtesting results look absurd: 100% profitable. But if you change any of the many parameters in the Settings popup, they will turn into disaster. It means, the rules of this strategy are very fragile. Don't trade this! Remember about backtesting rule #1: past results do not guarantee success in the future.
I'm giving this strategy out with the source code. Feel free to do anything you want with it. But if you find parameters or modifications on, which allow profitable trading on lower timeframes, don't be shy, let me know :)
*********
Forex / Indices / Commodities traders who want to start AUTO-TRADING might want to take a look at "TradingConnector", which allows no-latency trades execution from TradingView to MT4/MT5.
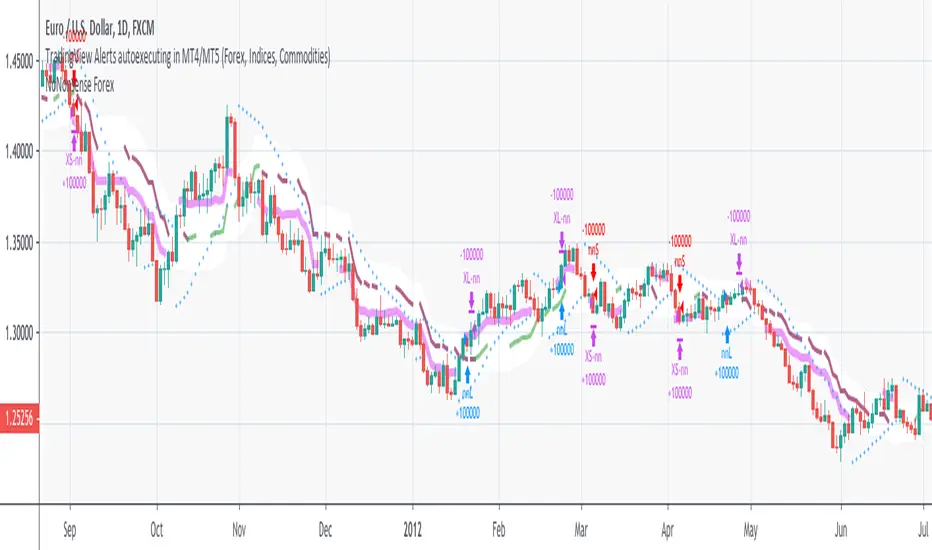
PD Crypto Performer (Backtest)Description:
This is the backtesting version of the PD Crypto Performer (Alert) . The strategy assumes the same capital amount invested ($10,000) each trade. You can also see how your capital grows over time by enabling the reinvesting proceeds option. For details, please check out this tutorial . The backtesting results could be easily improved in live trading by following the recommended methods of use below.
To assist the decision-making process, the code currently references BTCUSD. As a result, it is only suitable for crypto traders. However, we are working on the stock and forex versions, and the Performer will have these compatibilities soon.
Most importantly, our signals DO NOT REPAINT !
Recommended Use:
- Time Frame: 1HR
- Asset: Large cap crypto assets.
For lower risk tolerance, we recommend using the indicator on ETHUSD. For maximizing profits, we recommend using the indicator on BCHUSD.
- Always set stop loss according to your own risk tolerance
- Take profits along the way.
Recommended Use for Advanced Traders:
- Position sizing:
Larger position if the 1HR signal is in the same direction compared to the 4HR trend.
Smaller position if the 1HR signal is in the opposite direction compared to the 4HR trend.
- Better entry/exit points:
Track the 1HR signal for the asset you are trading on other exchanges along with the BTCUSD 1HR signal. Sometimes, the signals from different exchanges occur with a 1-2 hour difference. You could use these earlier signals along with a lower time frame (eg. 15min) entry confirmation from your own exchange for better entry / exit points.
Go to www.phi-deltalytics.com and sign up for a FREE trial today!
Let us know if you have any questions or recommendations. We are here for your success!
Disclaimer:
It should not be assumed that the methods, techniques, or indicators presented will be profitable or that they will not result in losses. Past results are not necessarily indicative of future results. This is not a solicitation of any order to buy or sell.

LANZ Strategy 5.0 [Backtest]🔷 LANZ Strategy 5.0 — Rule-Based BUY Logic with Time Filter, Session Limits and Auto SL/TP Execution
This is the backtest version of LANZ Strategy 5.0, built as a strategy script to evaluate real performance under fixed intraday conditions. It automatically places BUY and SELL trades based on structured candle confirmation, EMA trend alignment, and session-based filters. The system simulates real-time execution with precise Stop Loss and Take Profit levels.
📌 Built for traders seeking to simulate clean intraday logic with fully automated entries and performance metrics.
🧠 Core Logic & Strategy Conditions
✅ BUY Signal Conditions:
Price is above the EMA200
The last 3 candles are bullish (close > open)
The signal occurs within the defined session window (NY time)
Daily trade limit has not been exceeded
If all are true, a BUY order is executed at market, with SL and TP set immediately.
🔻 SELL Signal Conditions (Optional):
Exactly inverse to BUY (below EMA + 3 bearish candles). Disabled by default.
🕐 Operational Time Filter (New York Time)
You can fully customize your intraday window:
Start Time: e.g., 01:15 NY
End Time: e.g., 16:00 NY
The system evaluates signals only within this range, even across midnight if configured.
🔁 Trade Management System
One trade at a time per signal
Trades include a Stop Loss (SL) and Take Profit (TP) based on pip distance
Trade result is calculated automatically
Each signal is shown with a triangle marker (BUY only, by default)
🧪 Backtest Accuracy
This version uses:
strategy.order() for entries
strategy.exit() for SL and TP
strategy.close_all() at the configured manual closing time
This ensures realistic behavior in the TradingView strategy tester.
⚙️ Flow Summary (Step-by-Step)
On every bar, check:
Is the time within the operational session?
Is the price above the EMA?
Are the last 3 candles bullish?
If conditions met → A BUY trade is opened:
SL = entry – X pips
TP = entry + Y pips
Trade closes:
If SL or TP is hit
Or at the configured manual close time (e.g., 16:00 NY)
📊 Settings Overview
Timeframe: 1-hour (ideal)
SL/TP: Configurable in pips
Max trades/day: User-defined (default = 99 = unlimited)
Manual close: Adjustable by time
Entry type: Market (not limit)
Visuals: Plotshape triangle for BUY entry
👨💻 Credits:
💡 Developed by: LANZ
🧠 Strategy logic & execution: LANZ
✅ Designed for: Clean backtesting, clarity in execution, and intraday logic simulation

LANZ Strategy 1.0 [Backtest]🔷 LANZ Strategy 1.0 — Time-Based Session Trading with Smart Reversal Logic and Risk-Controlled Limit Orders
This backtest version of LANZ Strategy 1.0 brings precision to session-based trading by using directional confirmation, pre-defined risk parameters, and limit orders that execute overnight. Designed for the 1-hour timeframe, it allows traders to evaluate the system with configurable SL, TP, and risk settings in a fully automated environment.
🧠 Core Strategy Logic:
1. Directional Confirmation at 18:00 NY:
At 18:00 NY, the system compares the 08:00 open vs the 18:00 close:
If the direction matches the previous day, the signal is reversed.
If the direction differs, the current day's trend is kept.
This logic is designed to avoid momentum exhaustion and capture corrective reversals.
2. Entry Level Definition:
Based on the confirmed direction:
For BUY, the Low of the day is used as Entry Point (EP).
For SELL, the High of the day becomes EP.
The system plots a Stop Loss and Take Profit based on user-defined pip inputs (default: SL = 18 pips, TP = 54 pips → RR 1:3).
3. Time-Limited Entry Execution (LIMIT Orders):
Orders are sent after 18:00 NY and can be triggered anytime between 18:00 and 08:00 NY.
If EP is not touched before 08:00, the order is automatically cancelled.
4. Manual Close Feature:
If the trade is still open at the configured hour (default 09:00 NY), the system closes all positions, simulating realistic intraday exit scenarios.
5. Lot Size Calculation Based on Risk:
Lot size is dynamically calculated using the account size, risk percentage, and SL distance.
This ensures consistent risk exposure regardless of market volatility.
⚙️ Step-by-Step Flow:
08:00 NY → Captures the open of the day.
18:00 NY → Confirms direction and defines EP, SL, and TP.
After 18:00 NY → If conditions are met, a LIMIT order is placed at EP.
Between 18:00–08:00 NY → If price touches EP, the trade is executed.
At 08:00 NY → If EP wasn’t touched, the order is cancelled.
At Configured Manual Close Time (default 09:00 NY) → All open positions are force-closed if still active.
🧪 Backtest Settings:
Timeframe: 1-hour only
Order Type: strategy.entry() with limit=
SL/TP Configurable: Yes, in pips
Risk Input: % of capital per trade
Manual Close Time: Fully adjustable (default 09:00 NY)
👨💻 Credits:
Developed by LANZ
Strategy logic and trading concept built with clarity and precision.
Code structure and documentation by Kairos, your AI trading assistant.
Designed for high-confidence execution and clean backtesting performance.

LANZ Strategy 3.0 [Backtest]🔷 LANZ Strategy 3.0 — Asian Range Fibonacci Scalping Strategy
LANZ Strategy 3.0 is a precision-engineered backtesting tool tailored for intraday traders who rely on the Asian session range to determine directional bias. This strategy implements dynamic Fibonacci projections and strict time-window validation to simulate a clean and disciplined trading environment.
🧠 Core Components:
Asian Range Bias Definition: Direction is established between 01:15–02:15 a.m. NY time based on the candle’s close in relation to the midpoint of the Asian session range (18:00–01:15 NY).
Limit Order Execution: Only one trade is placed daily, using a limit order at the Asian range high (for sells) or low (for buys), between 01:15–08:00 a.m. NY.
Fibonacci-Based TP/SL:
Original Mode: TP = 2.25x range, SL = 0.75x range.
Optimized Mode: TP = 1.95x range, SL = 0.65x range.
No Trade After 08:00 NY: If the limit order is not executed before 08:00 a.m. NY, it is canceled.
Fallback Logic at 02:15 NY: If the market direction misaligns with the setup at 02:15 a.m., the system re-evaluates and can re-issue the order.
End-of-Day Closure: All positions are closed at 15:45 NY if still open.
📊 Backtest-Ready Design:
Entries and exits are executed using strategy.entry() and strategy.exit() functions.
Position size is fixed via capital risk allocation ($100 per trade by default).
Only one position can be active at a time, ensuring controlled risk.
📝 Notes:
This strategy is ideal for assets sensitive to the Asian/London session overlap, such as Forex pairs and indices.
Easily switch between Fibonacci versions using a single dropdown input.
Fully deterministic: all entries are based on pre-defined conditions and time constraints.
👤 Credits:
Strategy developed by rau_u_lanz using Pine Script v6. Built for traders who favor clean sessions, directional clarity, and consistent execution using time-based logic and Fibonacci projections.
