Tìm kiếm tập lệnh với "backtest"
Bullish Harami Backtest This is a bullish reversal pattern formed by two candlesticks in which a small
real body is contained within the prior session's unusually large real body.
Usually the second real body is the opposite color of the first real body.
The Harami pattern is the reverse of the Engulfing pattern.
WARNING:
- For purpose educate only
- This script to change bars colors.

Trend Trader AVR Backtest This is plots the indicator developed by Andrew Abraham
in the Trading the Trend article of TASC September 1998
It was modified, result values wass averages.

Market Facilitation Index (MFI) Backtest The Market Facilitation Index is an indicator that relates price range to
volume and measures the efficency of price movement. Use the indicator to
determine if the market is trending. If the Market Facilitation Index increased,
then the market is facilitating trade and is more efficient, implying that the
market is trending. If the Market Facilitation Index decreased, then the market
is becoming less efficient, which may indicate a trading range is developing that
may be a trend reversal.
You can change long to short in the Input Settings
WARNING:
- For purpose educate only
- This script to change bars colors.

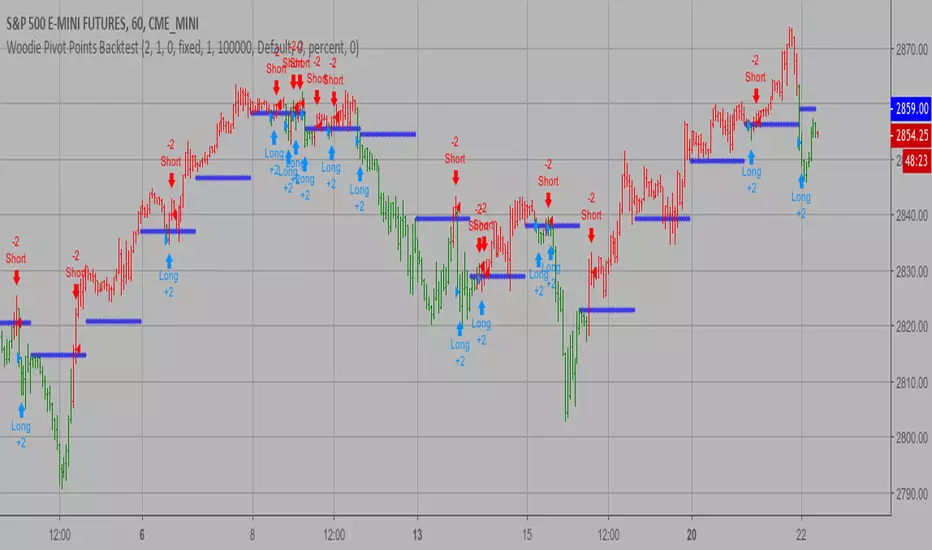
Woodie Pivot Points Backtest Simply input the vales of the high, low and closing price of the previous
period to calculate the Woodie pivot point and the associated resistance
and support levels for the present period.
You can change long to short in the Input Settings
WARNING:
- For purpose educate only
- This script to change bars colors.
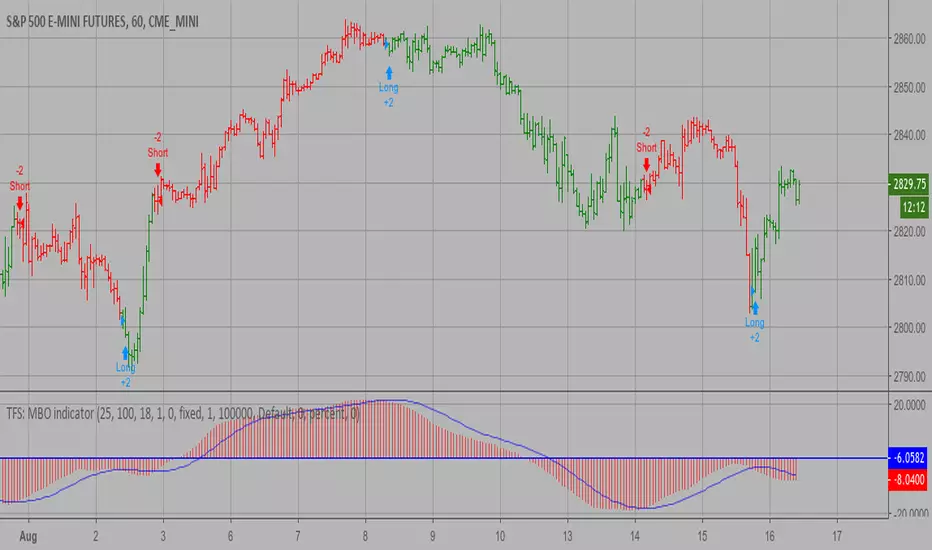
TFS: MBO Backtest MBO indicator is the third component of TFS trading system. This indicator
was developed by Bryan Strain and Mark Whitley.
The idea of MBO is similar to moving average convergence/divergence (MACD)
indicator. It is calculated by subtracting the 200-day moving average from
the 25-day moving average.
You can change long to short in the Input Settings
WARNING:
- For purpose educate only
- This script to change bars colors.
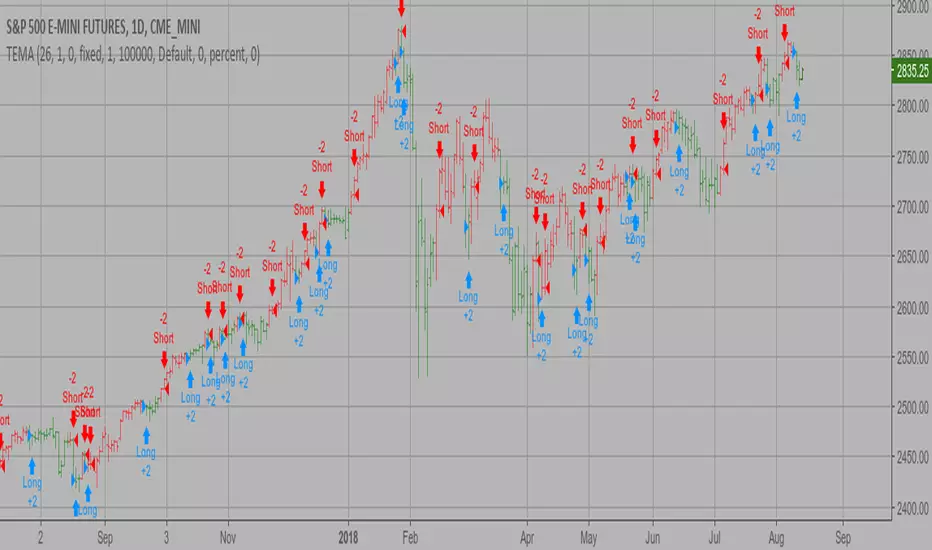
TEMA1 Backtest This study plots the TEMA1 indicator. TEMA1 ia s triple MA (Moving Average),
and is calculated as 3*MA - (3*MA(MA)) + (MA(MA(MA)))
You can change long to short in the Input Settings
WARNING:
- For purpose educate only
- This script to change bars colors.
Percent difference between price and MA Backtest Percent difference between price and MA
You can change long to short in the Input Settings
WARNING:
- For purpose educate only
- This script to change bars colors.

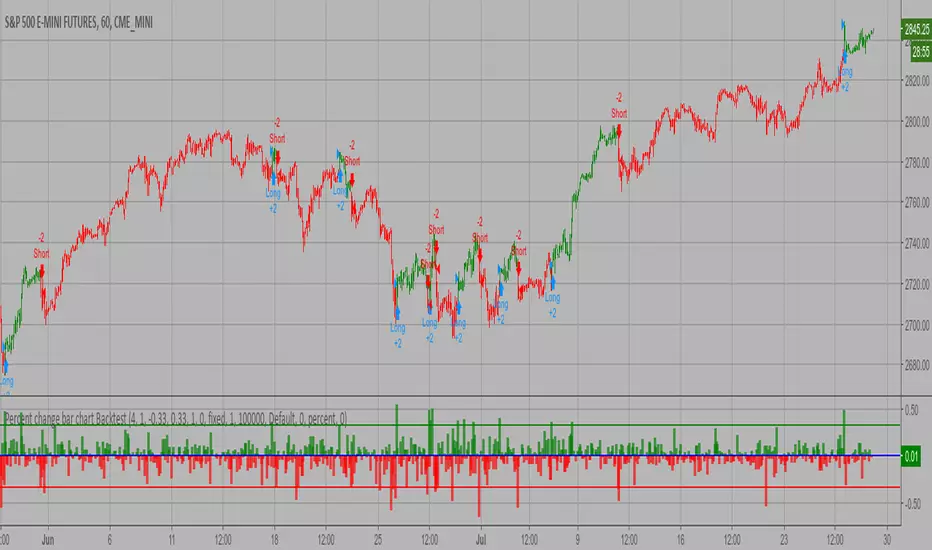
Percent change bar chart Backtest This histogram displays price or % change from previous bar.
You can change long to short in the Input Settings
WARNING:
- For purpose educate only
- This script to change bars colors.
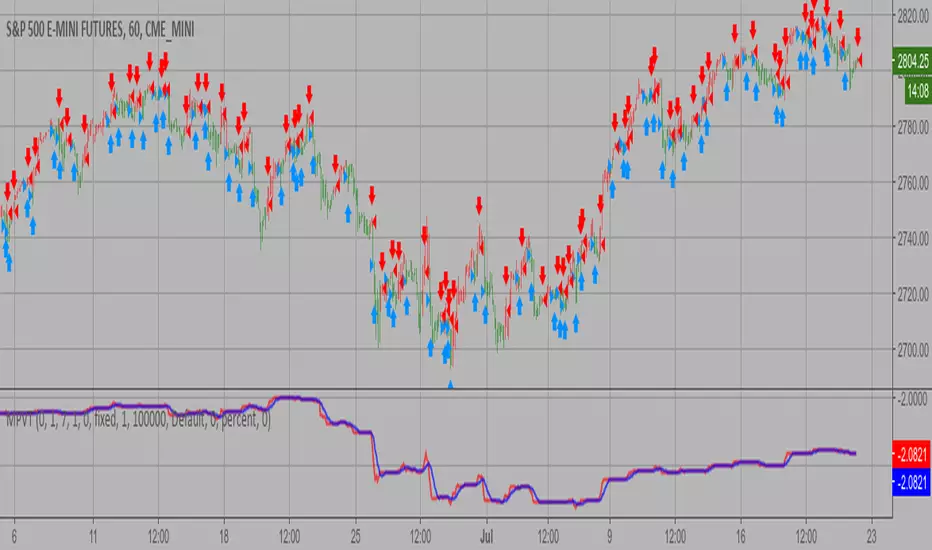
Modified Price-Volume Trend Backtest The related article is copyrighted material from
Stocks & Commodities.
Strategy by HPotter.
You can change long to short in the Input Settings
WARNING:
- For purpose educate only
- This script to change bars colors.
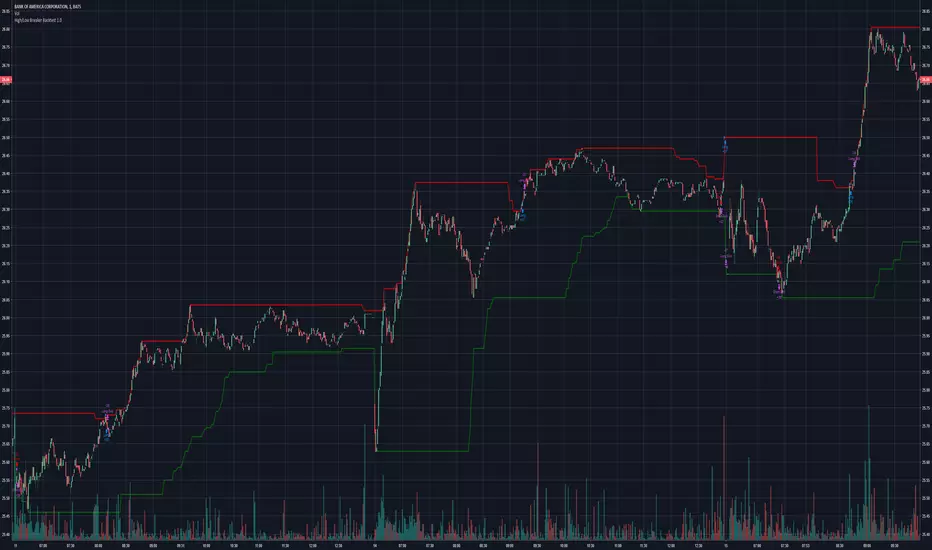
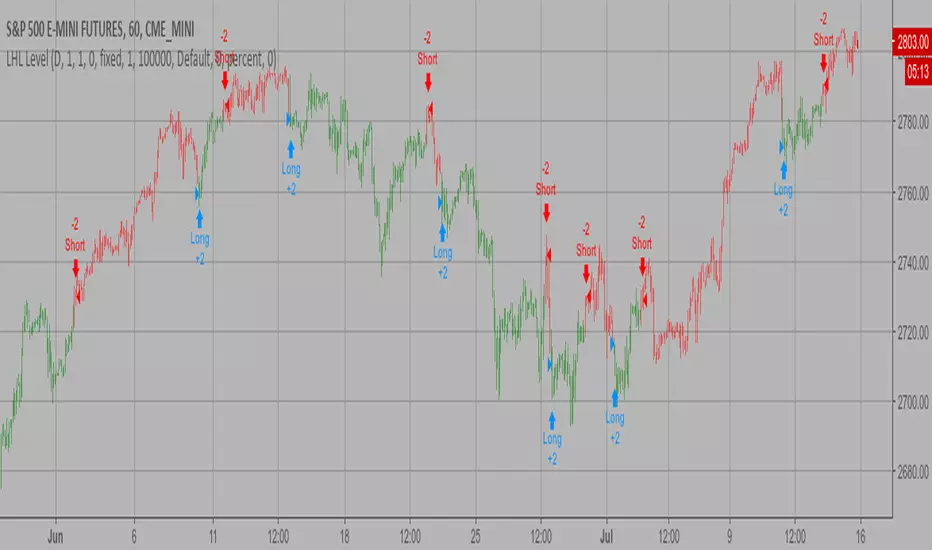
Last High and Low Level Backtest This script shows a high and low period value.
SelectPeriod - Day or Week or Month and etc.
LookBackPeriods - Shift levels 0 - current period, 1 - previous and etc.
You can change long to short in the Input Settings
WARNING:
- For purpose educate only
- This script to change bars colors.
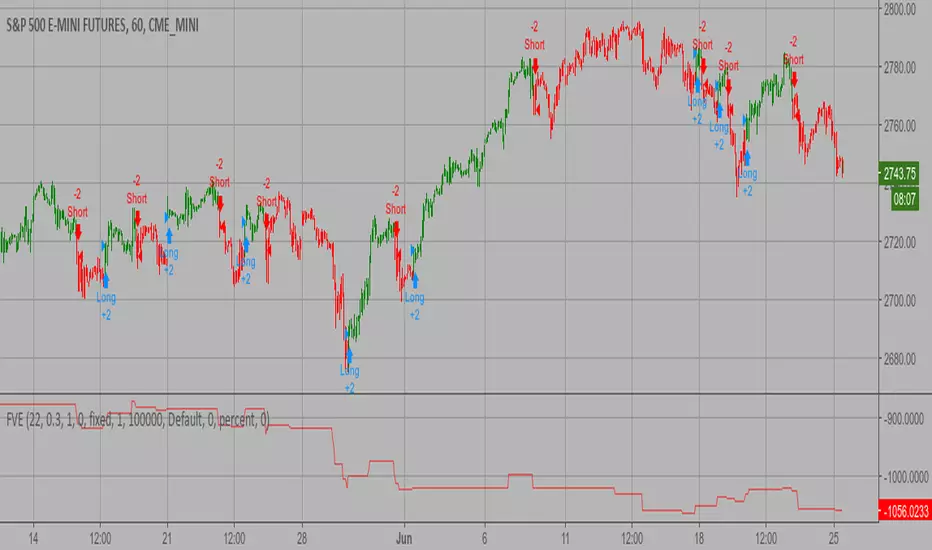
Finite Volume Elements (FVE) Backtest The FVE is a pure volume indicator. Unlike most of the other indicators
(except OBV), price change doesn?t come into the equation for the FVE (price
is not multiplied by volume), but is only used to determine whether money is
flowing in or out of the stock. This is contrary to the current trend in the
design of modern money flow indicators. The author decided against a price-volume
indicator for the following reasons:
- A pure volume indicator has more power to contradict.
- The number of buyers or sellers (which is assessed by volume) will be the same,
regardless of the price fluctuation.
- Price-volume indicators tend to spike excessively at breakouts or breakdowns.
You can change long to short in the Input Settings
WARNING:
- For purpose educate only
- This script to change bars colors.
Ergodic CSI Backtest This is one of the techniques described by William Blau in his book
"Momentum, Direction and Divergence" (1995). If you like to learn more,
we advise you to read this book. His book focuses on three key aspects
of trading: momentum, direction and divergence. Blau, who was an electrical
engineer before becoming a trader, thoroughly examines the relationship between
price and momentum in step-by-step examples. From this grounding, he then looks
at the deficiencies in other oscillators and introduces some innovative techniques,
including a fresh twist on Stochastics. On directional issues, he analyzes the
intricacies of ADX and offers a unique approach to help define trending and
non-trending periods.
This indicator plots Ergotic CSI and smoothed Ergotic CSI to filter out noise.
You can change long to short in the Input Settings
WARNING:
- For purpose educate only
- This script to change bars colors.

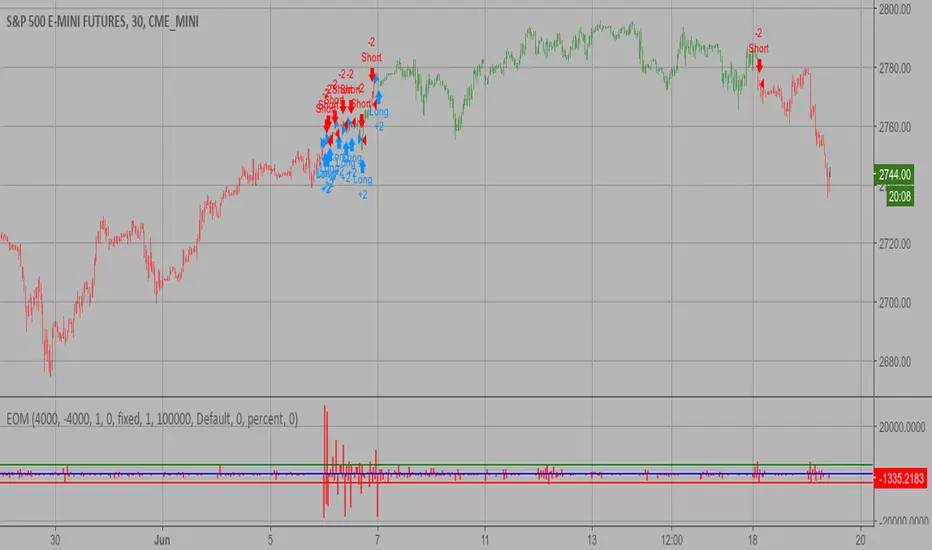
Ease of Movement (EOM) Backtest This indicator gauges the magnitude of price and volume movement.
The indicator returns both positive and negative values where a
positive value means the market has moved up from yesterday's value
and a negative value means the market has moved down. A large positive
or large negative value indicates a large move in price and/or lighter
volume. A small positive or small negative value indicates a small move
in price and/or heavier volume.
A positive or negative numeric value. A positive value means the market
has moved up from yesterday's value, whereas, a negative value means the
market has moved down.
You can change long to short in the Input Settings
WARNING:
- For purpose educate only
- This script to change bars colors.
Dynamic Momentum Index (DMI) Backtest This indicator plots Dynamic Momentum Index indicator. The Dynamic Momentum
Index (DMI) was developed by Tushar Chande and Stanley Kroll. The indicator
is covered in detail in their book The New Technical Trader.
The DMI is identical to Welles Wilder`s Relative Strength Index except the
number of periods is variable rather than fixed. The variability of the time
periods used in the DMI is controlled by the recent volatility of prices.
The more volatile the prices, the more sensitive the DMI is to price changes.
In other words, the DMI will use more time periods during quiet markets, and
less during active markets. The maximum time periods the DMI can reach is 30
and the minimum is 3. This calculation method is similar to the Variable
Moving Average, also developed by Tushar Chande.
The advantage of using a variable length time period when calculating the RSI
is that it overcomes the negative effects of smoothing, which often obscure short-term moves.
The volatility index used in controlling the time periods in the DMI is based
on a calculation using a five period standard deviation and a ten period average
of the standard deviation.
You can change long to short in the Input Settings
WARNING:
- For purpose educate only
- This script to change bars colors.

Average Directional Movement Index Rating Backtest The Average Directional Movement Index Rating (ADXR) measures the strength
of the Average Directional Movement Index (ADX). It's calculated by taking
the average of the current ADX and the ADX from one time period before
(time periods can vary, but the most typical period used is 14 days).
Like the ADX, the ADXR ranges from values of 0 to 100 and reflects strengthening
and weakening trends. However, because it represents an average of ADX, values
don't fluctuate as dramatically and some analysts believe the indicator helps
better display trends in volatile markets.
You can change long to short in the Input Settings
WARNING:
- For purpose educate only
- This script to change bars colors.

Vertical Horizontal Filter BacktestVertical Horizontal Filter was initiated by Adam White. It was first published
in a magazine called “Issues of Futures” in August, 1991. The Vertical Horizontal
Filter (VHF) is a very common Indicator used by traders to find out the Phase of
a Price Trend. Normally, a price trend can be in a Trending Phase or a Congestion
Phase/Choppy Movement Phase. Adam White created this particular Technical Indicator
to determine whether prices are trending in a particular direction or are they going
through a transitional period. He used it to measure the range of Futures available
in the market.
You can change long to short in the Input Settings
WARNING:
- For purpose educate only
- This script to change bars colors.

STARC Bands Backtest A type of technical indicator that is created by plotting two bands around
a short-term simple moving average (SMA) of an underlying asset's price.
The upper band is created by adding a value of the average true range
(ATR) - a popular indicator used by technical traders - to the moving average.
The lower band is created by subtracting a value of the ATR from the SMA.
STARC is an acronym for Stoller Average Range Channels. The indicator is
named after its creator, Manning Stoller.
You can change long to short in the Input Settings
WARNING:
- For purpose educate only
- This script to change bars colors.

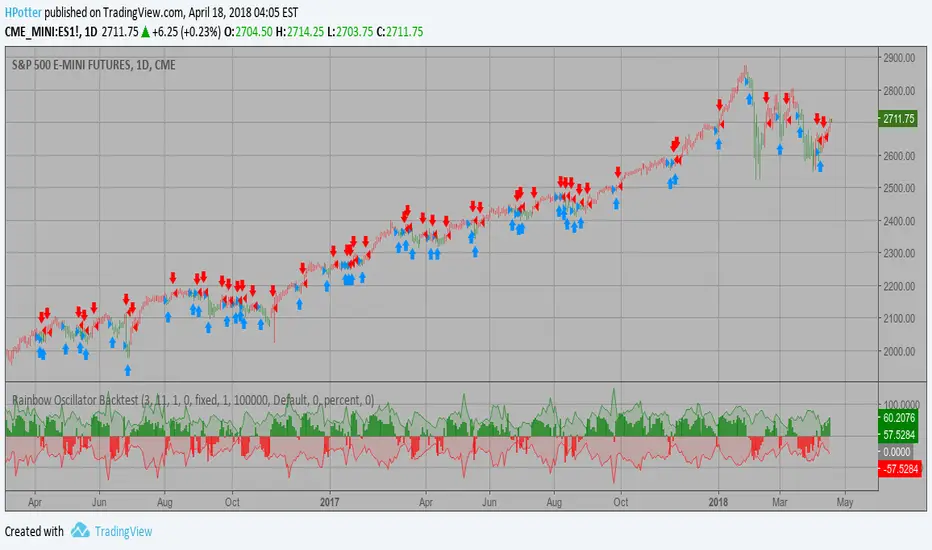
Rainbow Oscillator Backtest Ever since the people concluded that stock market price movements are not
random or chaotic, but follow specific trends that can be forecasted, they
tried to develop different tools or procedures that could help them identify
those trends. And one of those financial indicators is the Rainbow Oscillator
Indicator. The Rainbow Oscillator Indicator is relatively new, originally
introduced in 1997, and it is used to forecast the changes of trend direction.
As market prices go up and down, the oscillator appears as a direction of the
trend, but also as the safety of the market and the depth of that trend. As
the rainbow grows in width, the current trend gives signs of continuity, and
if the value of the oscillator goes beyond 80, the market becomes more and more
unstable, being prone to a sudden reversal. When prices move towards the rainbow
and the oscillator becomes more and more flat, the market tends to remain more
stable and the bandwidth decreases. Still, if the oscillator value goes below 20,
the market is again, prone to sudden reversals. The safest bandwidth value where
the market is stable is between 20 and 80, in the Rainbow Oscillator indicator value.
The depth a certain price has on a chart and into the rainbow can be used to judge
the strength of the move.
You can change long to short in the Input Settings
WARNING:
- For purpose educate only
- This script to change bars colors.
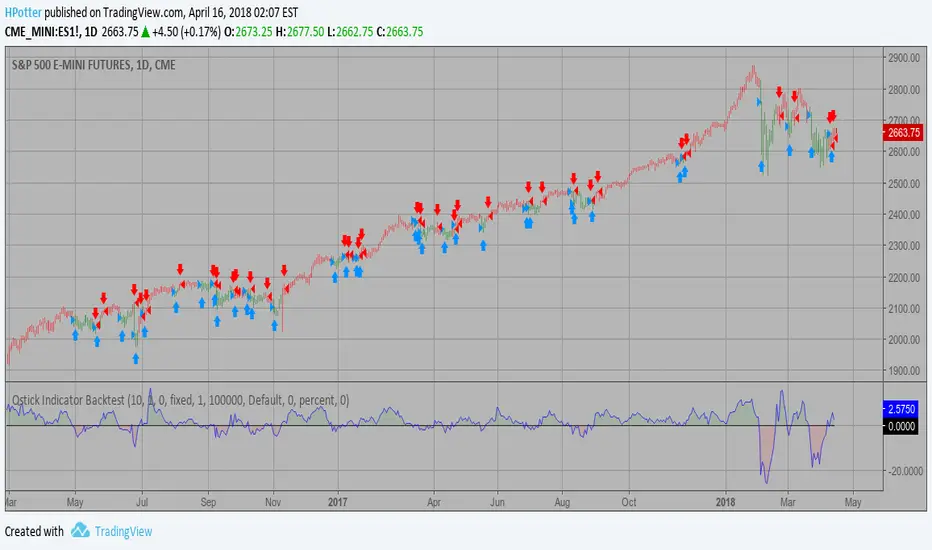
Qstick Indicator Backtest A technical indicator developed by Tushar Chande to numerically identify
trends in candlestick charting. It is calculated by taking an 'n' period
moving average of the difference between the open and closing prices. A
Qstick value greater than zero means that the majority of the last 'n' days
have been up, indicating that buying pressure has been increasing.
Transaction signals come from when the Qstick indicator crosses through the
zero line. Crossing above zero is used as the entry signal because it is indicating
that buying pressure is increasing, while sell signals come from the indicator
crossing down through zero. In addition, an 'n' period moving average of the Qstick
values can be drawn to act as a signal line. Transaction signals are then generated
when the Qstick value crosses through the trigger line.
You can change long to short in the Input Settings
WARNING:
- For purpose educate only
- This script to change bars colors.
Psychological line Backtest Psychological line (PSY), as an indicator, is the ratio of the number of
rising periods over the total number of periods. It reflects the buying
power in relation to the selling power.
If PSY is above 50%, it indicates that buyers are in control. Likewise,
if it is below 50%, it indicates the sellers are in control. If the PSY
moves along the 50% area, it indicates balance between the buyers and
sellers and therefore there is no direction movement for the market.
You can change long to short in the Input Settings
WARNING:
- For purpose educate only
- This script to change bars colors.

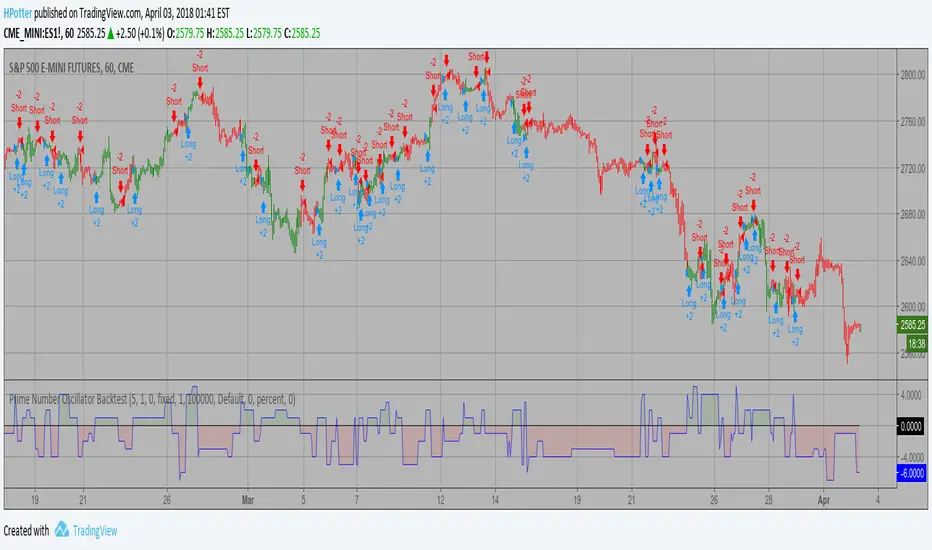
Prime Number Oscillator Backtest Determining market trends has become a science even though a high number or people
still believe it’s a gambling game. Mathematicians, technicians, brokers and investors
have worked together in developing quite several indicators to help them better understand
and forecast market movements.
Developed by Modulus Financial Engineering Inc., the prime number oscillator indicates the
nearest prime number, be it at the top or the bottom of the series, and outlines the
difference between that prime number and the respective series.
You can change long to short in the Input Settings
WARNING:
- For purpose educate only
- This script to change bars colors.
Prime Number Bands Backtest Determining market trends has become a science even though a high number
or people still believe it’s a gambling game. Mathematicians, technicians,
brokers and investors have worked together in developing quite several
indicators to help them better understand and forecast market movements.
The Prime Number Bands indicator was developed by Modulus Financial Engineering
Inc. This indicator is charted by indentifying the highest and lowest prime number
in the neighborhood and plotting the two series as a band.
You can change long to short in the Input Settings
WARNING:
- For purpose educate only
- This script to change bars colors.
