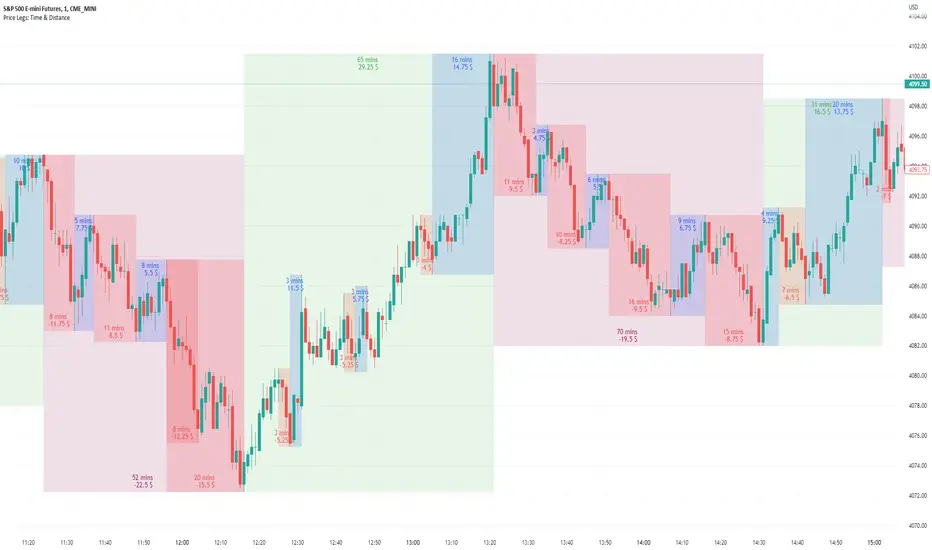
Price Legs: Time & Distance. Measuring moves in time & price-Tool to measure price legs in terms of both time and price; gives an idea of frequency of market movements and their typical extent and duration.
-Written for backtesting: seeing times of day where setups are most likely to unfold dynamically; getting an idea of typical and minimum sizes of small/large legs.
-Two sets of editable lookback numbers to measure both small and large legs independently.
-Works across timeframes and assets (units = mins/hours/days dependent on timeframe; units = '$' for indices & futures, 'pips' for FX).
~toggle on/off each set of bull/bear boxes.
~choose lookback/forward length for each set. Increase number for larger legs, decrease for smaller legs.
(for assets outside of the big Indices and FX, you may want to edit the multiplier, pMult, on lines 23-24)
small legs
large legs
Tìm kiếm tập lệnh với "backtest"
Divergence BacktesterThere is n number of possible ways in which we can backtest divergence and this is just a start :)
In this script, we are trying to count how many times the pivots made HH, HL, LH, LL after a particular divergence state.
An example of using data is as below:
The script keeps track of each pivot sentiment and resulting next pivot state. As mentioned in the chart snapshot, we can look at two of the previous pivot states and collect stats on how each of these state impacted price action.
As mentioned before, this is just tip of iceberg. Further combinations for which we can do backtest are:
1. m X n combinations of last pivot and last to last pivot divergence state
2. divergence combined with double divergence state.
Only issue to explore further is lack of space on the chart as tables can take up huge space.
PS: As you can see based on historical stats, probability of divergence impacting the change of trend is very low in most cases.

ATR BacktesterATR backtester... input the desired number of bars backwards (I'd recommend 100 or so), and then it'll spit out in the columns on the right side of the screen how many times each ATR was hit. Helps to tell at a glance where bullish and bearish is for the stock. May not be insanely useful since you can just look at the chart, but feel free to use the code yourself for something.
Breakout Probability (Expo)█ Overview
Breakout Probability is a valuable indicator that calculates the probability of a new high or low and displays it as a level with its percentage. The probability of a new high and low is backtested, and the results are shown in a table— a simple way to understand the next candle's likelihood of a new high or low. In addition, the indicator displays an additional four levels above and under the candle with the probability of hitting these levels.
The indicator helps traders to understand the likelihood of the next candle's direction, which can be used to set your trading bias.
█ Calculations
The algorithm calculates all the green and red candles separately depending on whether the previous candle was red or green and assigns scores if one or more lines were reached. The algorithm then calculates how many candles reached those levels in history and displays it as a percentage value on each line.
█ Example
In this example, the previous candlestick was green; we can see that a new high has been hit 72.82% of the time and the low only 28.29%. In this case, a new high was made.
█ Settings
Percentage Step
The space between the levels can be adjusted with a percentage step. 1% means that each level is located 1% above/under the previous one.
Disable 0.00% values
If a level got a 0% likelihood of being hit, the level is not displayed as default. Enable the option if you want to see all levels regardless of their values.
Number of Lines
Set the number of levels you want to display.
Show Statistic Panel
Enable this option if you want to display the backtest statistics for that a new high or low is made. (Only if the first levels have been reached or not)
█ Any Alert function call
An alert is sent on candle open, and you can select what should be included in the alert. You can enable the following options:
Ticker ID
Bias
Probability percentage
The first level high and low price
█ How to use
This indicator is a perfect tool for anyone that wants to understand the probability of a breakout and the likelihood that set levels are hit.
The indicator can be used for setting a stop loss based on where the price is most likely not to reach.
The indicator can help traders to set their bias based on probability. For example, look at the daily or a higher timeframe to get your trading bias, then go to a lower timeframe and look for setups in that direction.
-----------------
Disclaimer
The information contained in my Scripts/Indicators/Ideas/Algos/Systems does not constitute financial advice or a solicitation to buy or sell any securities of any type. I will not accept liability for any loss or damage, including without limitation any loss of profit, which may arise directly or indirectly from the use of or reliance on such information.
All investments involve risk, and the past performance of a security, industry, sector, market, financial product, trading strategy, backtest, or individual's trading does not guarantee future results or returns. Investors are fully responsible for any investment decisions they make. Such decisions should be based solely on an evaluation of their financial circumstances, investment objectives, risk tolerance, and liquidity needs.
My Scripts/Indicators/Ideas/Algos/Systems are only for educational purposes!

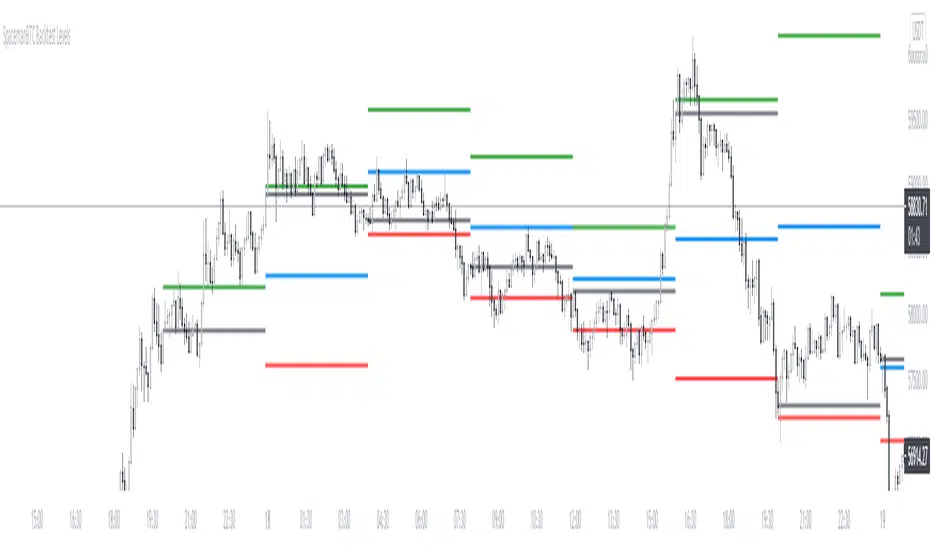
Key Levels CustomTF + Backtest: SpacemanBTCKey Levels Backtest, same logic as the key levels script, provide levels based:
High, Low, Mid and Close.
This was requested, took a long time to post as I fell sick and was given a lot of Dev Work.
Hope this helps those who use it, very useful to see liquidity grabs in my opinion.
Input time in minutes!
Result of a user request.
Configurable BB+RSI+Aroon strategy backtest for binary optionsI wanted to share this strategy that I use myself for binary options trading. After trading binary options for several years I have learned that every single day is unique... assets behave differently every single day. So, when I start the day I want to know which is the optimum combination of parameters in my indicators that will give me the signals I want during the day and I get that by doing a quick backtest of the parameters combination in a specific asset that same day. When trading Binary Options I usually do 3 or 4 trades max per day and, yes, there are moments in which even with the right backtest data the signals fail (I strongly believe that there is no strategy that guarantees 100% success in any type of trade, and this one here is not an exception - but has worked well with some assets). So, here is my contribution to improve your productivity by automating a bit that backtesting part.
How this script works?
It is a simple price crossunder / crossover Bollinger Bands (BB) with a confirmation from RSI overbought / oversold signals and a fast Aroon. You will see the BB plotted with its confirmations:
(1) a blue circle that plots in the chart when the price is coming back inside the channel (within the Bollinger Bands)
(2) an orange square that plots in the chart when the RSI is coming back from the overbought or oversold areas
(3) a triangle that could be red or green depending on the Aroon confirmation: Red if Aroon Down is crossing down Aroon Up or green if vice versa.
The strategy will call for long (Call) if:
(1) the price is crossing over the lower band of the Bollinger Bands, coming back inside the channel
(2) Aroon Up is crossing or has crossed above Aroon Down
(3) RSI is crossing over the oversold limit
Consequently, the strategy will call for a short (Put) if:
(1) the price is crossing down the upper band of the Bollinger Bands, coming back inside the channel
(2) Aroon Down is crossing or has crossed below Aroon Up
(3) RSI is crossing under the overbought limit
You can configure:
1. Aroon length (keep it as fast as possible: 3, 4 or 5 are recommended values)
2. The point where Aroon Up and Aroon Down cross to make the signal valid (50 is by default. It could also be 25 or 75)
3. The RSI length
4. RSI Overbought and Oversold limits (they do not need to be symmetric: you can use 29 and 93, for example)
5. Bollinger Bands length and standard deviation
6. Number of bars to keep your option open. Depending on the timeframe used, this will determine the time you will keep your binary option open. If you are in a 1 min chart and keep this parameter in 3, then you will need to configure your binary option to expire in 3 minutes.
How to evaluate your backtest?
In Binary Options you only need the success rate, so what I do is that when I am manually updating the parameters I keep my strategy tester window open checking the winning trades vs losing trades ratio ("Percent Profitable"). I personally will only keep an asset monitored looking for signals that day if the Percent Profitable on the backtest of the same day is above 80%.
Regarding the code: it is open, public and free. No need to ask for permission if you want to copy+paste and use it in whole or parts.
Happy pip hunting!
-marco

NoNonsense Forex - high timeframe trading absurd NON-REPAINTINGSome time ago I bumped into NoNonsense Forex - pretty good-looking course with well-designed videos, reasonable rules, etc. Nice explanatory videos, not selling anything, building indicators-only strategy. But there was one thing that really annoyed me - it was supposed to work only on Daily timeframe. What is the point in trading such high timeframe, if decisions changing market direction are playing out within 1 minute? What is the point in evaluating trades from 1994 if we are 25 years later?
Anyway, I have developed this strategy, which is:
- non-repainting
- not using trailing-stop
- not using any other known TradingView backtest bugs
And I'm showing it as an example of OVERFITTING. Backtesting results look absurd: 100% profitable. But if you change any of the many parameters in the Settings popup, they will turn into disaster. It means, the rules of this strategy are very fragile. Don't trade this! Remember about backtesting rule #1: past results do not guarantee success in the future.
I'm giving this strategy out with the source code. Feel free to do anything you want with it. But if you find parameters or modifications on, which allow profitable trading on lower timeframes, don't be shy, let me know :)
*********
Forex / Indices / Commodities traders who want to start AUTO-TRADING might want to take a look at "TradingConnector", which allows no-latency trades execution from TradingView to MT4/MT5.
LANZ Strategy 5.0 [Backtest]🔷 LANZ Strategy 5.0 — Rule-Based BUY Logic with Time Filter, Session Limits and Auto SL/TP Execution
This is the backtest version of LANZ Strategy 5.0, built as a strategy script to evaluate real performance under fixed intraday conditions. It automatically places BUY and SELL trades based on structured candle confirmation, EMA trend alignment, and session-based filters. The system simulates real-time execution with precise Stop Loss and Take Profit levels.
📌 Built for traders seeking to simulate clean intraday logic with fully automated entries and performance metrics.
🧠 Core Logic & Strategy Conditions
✅ BUY Signal Conditions:
Price is above the EMA200
The last 3 candles are bullish (close > open)
The signal occurs within the defined session window (NY time)
Daily trade limit has not been exceeded
If all are true, a BUY order is executed at market, with SL and TP set immediately.
🔻 SELL Signal Conditions (Optional):
Exactly inverse to BUY (below EMA + 3 bearish candles). Disabled by default.
🕐 Operational Time Filter (New York Time)
You can fully customize your intraday window:
Start Time: e.g., 01:15 NY
End Time: e.g., 16:00 NY
The system evaluates signals only within this range, even across midnight if configured.
🔁 Trade Management System
One trade at a time per signal
Trades include a Stop Loss (SL) and Take Profit (TP) based on pip distance
Trade result is calculated automatically
Each signal is shown with a triangle marker (BUY only, by default)
🧪 Backtest Accuracy
This version uses:
strategy.order() for entries
strategy.exit() for SL and TP
strategy.close_all() at the configured manual closing time
This ensures realistic behavior in the TradingView strategy tester.
⚙️ Flow Summary (Step-by-Step)
On every bar, check:
Is the time within the operational session?
Is the price above the EMA?
Are the last 3 candles bullish?
If conditions met → A BUY trade is opened:
SL = entry – X pips
TP = entry + Y pips
Trade closes:
If SL or TP is hit
Or at the configured manual close time (e.g., 16:00 NY)
📊 Settings Overview
Timeframe: 1-hour (ideal)
SL/TP: Configurable in pips
Max trades/day: User-defined (default = 99 = unlimited)
Manual close: Adjustable by time
Entry type: Market (not limit)
Visuals: Plotshape triangle for BUY entry
👨💻 Credits:
💡 Developed by: LANZ
🧠 Strategy logic & execution: LANZ
✅ Designed for: Clean backtesting, clarity in execution, and intraday logic simulation

LANZ Strategy 1.0 [Backtest]🔷 LANZ Strategy 1.0 — Time-Based Session Trading with Smart Reversal Logic and Risk-Controlled Limit Orders
This backtest version of LANZ Strategy 1.0 brings precision to session-based trading by using directional confirmation, pre-defined risk parameters, and limit orders that execute overnight. Designed for the 1-hour timeframe, it allows traders to evaluate the system with configurable SL, TP, and risk settings in a fully automated environment.
🧠 Core Strategy Logic:
1. Directional Confirmation at 18:00 NY:
At 18:00 NY, the system compares the 08:00 open vs the 18:00 close:
If the direction matches the previous day, the signal is reversed.
If the direction differs, the current day's trend is kept.
This logic is designed to avoid momentum exhaustion and capture corrective reversals.
2. Entry Level Definition:
Based on the confirmed direction:
For BUY, the Low of the day is used as Entry Point (EP).
For SELL, the High of the day becomes EP.
The system plots a Stop Loss and Take Profit based on user-defined pip inputs (default: SL = 18 pips, TP = 54 pips → RR 1:3).
3. Time-Limited Entry Execution (LIMIT Orders):
Orders are sent after 18:00 NY and can be triggered anytime between 18:00 and 08:00 NY.
If EP is not touched before 08:00, the order is automatically cancelled.
4. Manual Close Feature:
If the trade is still open at the configured hour (default 09:00 NY), the system closes all positions, simulating realistic intraday exit scenarios.
5. Lot Size Calculation Based on Risk:
Lot size is dynamically calculated using the account size, risk percentage, and SL distance.
This ensures consistent risk exposure regardless of market volatility.
⚙️ Step-by-Step Flow:
08:00 NY → Captures the open of the day.
18:00 NY → Confirms direction and defines EP, SL, and TP.
After 18:00 NY → If conditions are met, a LIMIT order is placed at EP.
Between 18:00–08:00 NY → If price touches EP, the trade is executed.
At 08:00 NY → If EP wasn’t touched, the order is cancelled.
At Configured Manual Close Time (default 09:00 NY) → All open positions are force-closed if still active.
🧪 Backtest Settings:
Timeframe: 1-hour only
Order Type: strategy.entry() with limit=
SL/TP Configurable: Yes, in pips
Risk Input: % of capital per trade
Manual Close Time: Fully adjustable (default 09:00 NY)
👨💻 Credits:
Developed by LANZ
Strategy logic and trading concept built with clarity and precision.
Code structure and documentation by Kairos, your AI trading assistant.
Designed for high-confidence execution and clean backtesting performance.

LANZ Strategy 3.0 [Backtest]🔷 LANZ Strategy 3.0 — Asian Range Fibonacci Scalping Strategy
LANZ Strategy 3.0 is a precision-engineered backtesting tool tailored for intraday traders who rely on the Asian session range to determine directional bias. This strategy implements dynamic Fibonacci projections and strict time-window validation to simulate a clean and disciplined trading environment.
🧠 Core Components:
Asian Range Bias Definition: Direction is established between 01:15–02:15 a.m. NY time based on the candle’s close in relation to the midpoint of the Asian session range (18:00–01:15 NY).
Limit Order Execution: Only one trade is placed daily, using a limit order at the Asian range high (for sells) or low (for buys), between 01:15–08:00 a.m. NY.
Fibonacci-Based TP/SL:
Original Mode: TP = 2.25x range, SL = 0.75x range.
Optimized Mode: TP = 1.95x range, SL = 0.65x range.
No Trade After 08:00 NY: If the limit order is not executed before 08:00 a.m. NY, it is canceled.
Fallback Logic at 02:15 NY: If the market direction misaligns with the setup at 02:15 a.m., the system re-evaluates and can re-issue the order.
End-of-Day Closure: All positions are closed at 15:45 NY if still open.
📊 Backtest-Ready Design:
Entries and exits are executed using strategy.entry() and strategy.exit() functions.
Position size is fixed via capital risk allocation ($100 per trade by default).
Only one position can be active at a time, ensuring controlled risk.
📝 Notes:
This strategy is ideal for assets sensitive to the Asian/London session overlap, such as Forex pairs and indices.
Easily switch between Fibonacci versions using a single dropdown input.
Fully deterministic: all entries are based on pre-defined conditions and time constraints.
👤 Credits:
Strategy developed by rau_u_lanz using Pine Script v6. Built for traders who favor clean sessions, directional clarity, and consistent execution using time-based logic and Fibonacci projections.

HL/2 Fast & Slow - Cloud Signals + Backtest + Exit AlarmsDescription:
This indicator plots two HL/2 moving averages—a fast and a slow line—on the chart, along with dynamic upper and lower bands based on the slow line and ATR. It features a colored cloud between the two averages to visualize trend direction, and it provides buy/sell signals based on the alignment of the two lines.
Key Features:
Fast & Slow HL/2 Averages
Fast and slow HL/2 lines calculated as simple moving averages.
Lines change color based on direction (up/down), configurable via style settings.
Dynamic Upper and Lower Bands
Bands calculated from the slow line using ATR to capture volatility.
Trend Cloud
Fills the area between fast and slow lines.
Green if both lines are rising, red if both are falling, gray if lines disagree.
Transparency adjustable for better visual clarity.
Buy/Sell Signals
Signals appear only when both lines align in the same direction.
Two modes available:
Series Signals: generates a signal whenever the cloud color changes.
Single Signal: generates a signal only when the slow line changes direction.
Signals are plotted as small triangles above/below bars.
Alerts can be set for both buy/sell signals.
Exit Modes and Alerts
Exit positions either on a reverse signal or when the cloud enters a neutral gray zone.
Exit alerts are available for both conditions.
Integrated Backtest Panel
Shows total trades, win rate, and cumulative profit in USD.
Considers position size and commission (configurable).
Panel color indicates profit (green) or loss (red).
Fixed position on chart for easy reference.
Inputs:
Fast and slow periods, ATR length, ATR multiplier.
Position size, commission percentage.
Signal mode (Series or Single).
Exit mode (Reverse Signal or Gray Area).
Style options for line colors and cloud colors.
Time window for backtesting (daily, weekly, monthly, or custom date range).
Usage:
Ideal for identifying trend direction and potential entry points.
Can be used for manual trading or as part of an automated strategy with alerts.
Provides a visual and statistical overview of trading performance via the backtest panel.

Portfolio Simulator & BacktesterMulti-asset portfolio simulator with different metrics and ratios, DCA modeling, and rebalancing strategies.
Core Features
Portfolio Construction
Up to 5 assets with customizable weights (must total 100%)
Support for any tradable symbol: stocks, ETFs, crypto, indices, commodities
Real-time validation of allocations
Dollar Cost Averaging
Monthly or Quarterly contributions
Applies to both portfolio and benchmark for fair comparison
Model real-world investing behavior
Rebalancing
Four strategies: None, Monthly, Quarterly, Yearly
Automatic rebalancing to target weights
Transaction cost modeling (customizable fee %)
Key Metrics Table
CAGR: Annualized compound return (S&P 500 avg: ~10%)
Alpha: Excess return vs. benchmark (positive = outperformance)
Sharpe Ratio: Return per unit of risk (>1.0 is good, >2.0 excellent)
Sortino Ratio: Like Sharpe but only penalizes downside (better metric)
Calmar Ratio: CAGR / Max Drawdown (>1.0 good, >2.0 excellent)
Max Drawdown: Largest peak-to-trough decline
Win Rate: % of positive days (doesn't indicate profitability)
Visualization
Dual-chart comparison - Portfolio vs. Benchmark
Dollar or percentage view toggle
Customizable colors and line width
Two tables: Statistics + Asset Allocation
Adjustable table position and text size
🚀 Quick Start Guide
Enter 1-5 ticker symbols (e.g., SPY, QQQ, TLT, GLD, BTCUSD)
Make sure percentage weights total 100%
Choose date range (ensure chart shows full period - zoom out!)
Configure DCA and rebalancing (optional)
Select benchmark (default: SPX)
Analyze results in statistics table
💡 Pro Tips
Chart data matters: Load SPY or your longest-history asset as main chart
If you select an asset that was not available for the selected period, the chart will not show up! E.g. BTCUSD data: Only available from ~2017 onwards.
Transaction fees: 0.1% default (adjust to match your broker)
⚠️ Important Notes
Requires visible chart data (zoom out to show full date range)
Limited by each asset's historical data availability
Transaction fees and costs are modeled, but taxes/slippage are not
Past performance ≠ future results
Use for research and education only, not financial advice
Let me know if you have any suggestions to improve this simulator.

Aroon and ASH strategy - ETHERIUM [IkkeOmar]Intro:
This post introduces a Pine Script strategy, as an example if anyone needs a push to get started. This example is a strategy on ETH, obviously it isn't a good strategy, and I wouldn't share my own good strategies because of alpha decay. This strategy combines two technical indicators: Aroon and Absolute Strength Histogram (ASH).
Overview:
The strategy employs the Aroon indicator alongside the Absolute Strength Histogram (ASH) to determine market trends and potential trade setups. Aroon helps identify the strength and direction of a trend, while ASH provides insights into the strength of momentum. By combining these indicators, the strategy aims to capture profitable trading opportunities in Ethereum markets. Normally when developing strats using indicators, you want to find some good indicators, but you NEED to understand their strengths and weaknesses, other indicators can be incorporated to minimize the downs of another indicator. Try to look for synergy in your indicators!
Indicator settings:
Aroon Indicator:
- Two sets of parameters are used for the Aroon indicator:
- For Long Positions: Aroon periods are set to 56 (upper) and 20 (lower).
- For Short Positions: Aroon periods are set to 17 (upper) and 55 (lower).
Absolute Strength Histogram (ASH):
ASH is calculated with a length of 9 bars using the closing price as the data source.
Trading Conditions:
The strategy incorporates specific conditions to initiate and exit trades:
Start Date:
Traders can specify the start date for backtesting purposes.
Trade Direction:
Traders can select the desired trade direction: Long, Short, or Both.
Entry and Exit Conditions:
1. Long Position Entry: A long position is initiated when the Aroon indicator crosses over (crossover) the lower Aroon threshold, indicating a potential uptrend.
2. Long Position Exit: A long position is closed when the Aroon indicator crosses under (crossunder) the lower Aroon threshold.
3. Short Position Entry: A short position is initiated when the Aroon indicator crosses under (crossunder) the upper Aroon threshold, signaling a potential downtrend.
4. Short Position Exit: A short position is closed when the Aroon indicator crosses over (crossover) the upper Aroon threshold.
Disclaimer:
THIS ISN'T AN OPTIMAL STRATEGY AT ALL! It was just an old project from when I started learning pine script!
The backtest doesn't promise the same results in the future, always do both in-sample and out-of-sample testing when backtesting a strategy. And make sure you forward test it as well before implementing it!

PIVOT STRATEGY [INDIAN MARKET TIMING]
A Back-tested Profitable Strategy for Free!!
A PIVOT INTRADAY STRATEGY for 5 minute Time-Frame , that also explains the time condition for Indian Markets
The Timing can be changed to fit other markets, scroll down to "TIME CONDITION" to know more.
The commission is also included in the strategy .
The basic idea is when ,
1) Price crosses above ema1 ,indicated by pivot highest line in green color .
2) Price crosses below ema1 ,indicated by pivot lowest line in red color .
3) Candle high crosses above pivot highest , is the Long condition .
4) Candle low crosses below pivot lowest , is the Short condition .
5) Maximum Risk per trade for the intraday trade can be changed .
6) Default_qty_size is set to 60 contracts , which can be changed under settings → properties → order size .
7) ATR is used for trailing after entry, as mentioned in the inputs below.
// ═════════════════════════//
// ————————> INPUTS <————————— //
// ═════════════════════════//
Leftbars —————> Length of pivot highs and lows
Rightbars —————> Length of pivot highs and lows
Price Cross Ema —————> Added condition
ATR LONG —————> ATR stoploss trail for Long positions
ATR SHORT —————> ATR stoploss trail for Short positions
RISK —————> Maximum Risk per trade for the day
The strategy was back-tested on RELIANCE ,the input values and the results are mentioned under "BACKTEST RESULTS" below .
// ═════════════════════════ //
// ————————> PROPERTIES<——————— //
// ═════════════════════════ //
Default_qty_size ————> 60 contracts , which can be changed under settings
↓
properties
↓
order size
// ═══════════════════════════════//
// ————————> TIME CONDITION <————————— //
// ═══════════════════════════════//
The time can be changed in the script , Add it → click on ' { } ' → Pine editor→ making it a copy [right top corner} → Edit the line 25 .
The Indian Markets open at 9:15am and closes at 3:30pm .
The 'time_cond' specifies the time at which Entries should happen .
"Close All" function closes all the trades at 3pm, at the open of the next candle.
To change the time to close all trades , Go to Pine Editor → Edit the line 103 .
All open trades get closed at 3pm , because some brokers don't allow you to place fresh intraday orders after 3pm .
NSE:RELIANCE
// ═══════════════════════════════════════════════ //
// ————————> BACKTEST RESULTS ( 128 CLOSED TRADES )<————————— //
// ═══════════════════════════════════════════════ //
INPUTS can be changed for better back-test results.
The strategy applied to NIFTY ( 5 min Time-Frame and contract size 60 ) gives us 60% profitability y , as shown below
It was tested for a period a 6 months with a Profit Factor of 1.45 ,net Profit of 21,500Rs profit .
Sharpe Ratio : 0.311
Sortino Ratio : 0.727
The graph has a Linear Curve with consistent profits .
The INPUTS are as follows,
1) Leftbars ————————> 3
2) Rightbars ————————> 5
3) Price Cross Ema ——————> 150
4) ATR LONG ————————> 2.7
5) ATR SHORT ———————> 2.9
6) RISK —————————> 2500
7) Default qty size ——————> 60
NSE:RELIANCE
Save it to favorites.
Apply it to your charts Now !!
↓
FOLLOW US FOR MORE !
Thank me later ;)

Consolidation Breakout [Indian Market Timing]OK let's get started ,
A Day Trading (Intraday) Consolidation Breakout Indication Strategy that explains time condition for Indian Markets .
The commission is also included in the strategy .
The basic idea is ,
1) Price crosses above upper band , indicated by a color change (green) is the Long condition .
2) Price crosses below lower band , indicated by a color change (red) is the Short condition .
3) ATR is used for trailing after entry
// ═══════════════════════════════//
// ————————> TIME CONDITION <————————— //
// ═══════════════════════════════//
The Indian Markets open at 9:15am and closes at 3:30pm.
The time_condition specifies the time at which Entries should happen .
"Close All" function closes all the trades at 2:57pm.
All open trades get closed at 2:57pm , because some brokers dont allow you to place fresh intraday orders after 3pm.
NSE:NIFTY1!
// ═══════════════════════════════════════════════ //
// ————————> BACKTEST RESULTS ( 114 CLOSED TRADES )<————————— //
// ═══════════════════════════════════════════════ //
LENGTH , MULT (factor) and ATR can be changed for better backtest results.
The strategy applied to NIFTY (3 min Time-Frame and contract size 5) gives us 60% profitability , as shown below
It was tested for a period a 8 months with a Profit Factor of 2.2 , avg Trade of 6000Rs profit and Sharpe Ratio : 0.67
The graph has a Linear Curve with consistent profits.
NSE:NIFTY1!
Save it favorites.
Apply it to your charts Now !!
Thank me later ;)

Key Performance IndicatorWe are happy to introduce the Key Performance Indicator by Detlev Matthes. This is an amazing tool to quantify the efficiency of a trading system and identify potential spots of improvement.
Abstract
A key performance indicator with high explanatory value for the quality of trading systems is introduced. Quality is expressed as an indicator and comprises the individual values of qualitative aspects. The work developing the KPI was submitted for the 2017 VTAD Award and won first prize.
Introduction
Imagine that you have a variety of stock trading systems from which to select. During backtesting, each trading system will deliver different results with regard to its indicators (depending on, inter alia, its parameters and the stock used). You will also get different forms of progression for profit development. It requires great experience to select the “best” trading system from this variety of information (provided by several indicators) and significantly varying equity progression forms. In this paper, an indicator will be introduced that expresses the quality of a trading system in just one figure. With such an indicator, you can view the results of one backtest at a glance and also more easily compare a variety of backtesting results with one another.
If you are interested in learning more about the calculations behind this indicator then I have included a link to the english version of his research paper.
Along with this, we now offer indicator development services. If you are interested in learning more then feel free to reach out to get a quote for your project.
**Please note that we have NOT inputted any real strategy into the code and therefore it is not producing any real value. Feel free to change the code as desired to test any strategy!**
drive.google.com
3Commas Bollinger StrategyThis strategy is intended for use as a way of backtesting various parameters available on 3commas.io composite bot using a bollinger band type trading strategy. While it's primary intention is to provide users a way of backtesting bot parameters, it can also be used to trigger a deal start by either using the {{strategy.open.alert_message}} field in your alert and providing the bot details in the configuration screen for the strategy or by including the usual deal start message provided by 3commas. You can find more information about how to do this from help.3commas.io
The primary inputs for the strategy are:
// USER INPUTS
Short MA Window - The length of the Short moving average
Long MA Window - The length of the Long moving average
Upper Band Offset - The offset to use for the upper bollinger offset
Lower Band Offset - The offset to use for the lower bollinger offset
Long Stop Loss % - The stop loss percentage to test
Long Take Profit % - The Take profit percentage to test
Initial SO Deviation % - The price deviation percentage required to place to first safety order
Safety Order Vol Step % - The volume scale to test
3Commas Bot ID - (self explanatory)
Bot Email Token - Found in the deal start message for your bot (see link in previous section for details)
3Commas Bot Trading Pair - The pair to include for composite bot start deals (should match format of 3commas, not TradingView IE. USDT_BTC not BTCUSDT)
Start Date, Month, Year and End Date, Month and Year all apply to the backtesting window. By default it will use as much data as it can given the current period select (there is less historical data available for periods below 1H) back as far as 2016 (there appears to be no historical data on Trading view much before this). If you would like to test a different period of time, just change these values accordingly.
Known Issues
Currently there are a couple of issues with this strategy that you should be aware of. I may fix them at some point in the future but they don't really bug me so this is more for informational purposes than a promise that they may one day be fixed.
Does not test trailing take profit
Number of safety orders and Safety Order Step Scale are currently not user configurable (must edit source code)
Using the user configuration to generate deal start message assumes you are triggering a composite bot, not a simple bot.

APEX - Tester - Buy/Sell Strategies - Basic - BACKTESTERThis is a upgraded version of the following study.
This is a simple Strategy for backtesting your APEX trading ideas.
Be aware that the results will not be exact same as with apex bot.

[Autoview][BackTest]Dual MA Ribbons R0.12 by JustUncleLThis is an implementation of a strategy based on two MA Ribbons, a Fast Ribbon and a Slow Ribbon. This strategy can be used on Normal candlestick charts or Renko charts (if you are familiar with them).
The strategy revolves around a pair of scripts: One to generate alerts signals for Autoview and one for Backtesting, to tune your settings.
The risk management options are performed within the script to set SL(StopLoss), TP(TargetProfit), TSL(Trailing Stop Loss) and TTP (Trailing Target Profit). The only requirement for Autoview is to Buy and Sell as directed by this script, no complicated syntax is required.
The Dual Ribbons are designed to capture the inferred behavior of traders and investors by using two groups of averages:
> Traders MA Ribbon: Lower MA and Upper MA (Aqua=Uptrend, Blue=downtrend, Gray=Neutral), with center line Avg MA (Orange dotted line).
> Investors MAs Ribbon: Lower MA and Upper MA (Green=Uptrend, Red=downtrend, Gray=Neutral), with center line Avg MA (Fuchsia dotted line).
> Anchor time frame (0=current). This is the time frame that the MAs are calculated for. This way 60m MA Ribbons can be viewed on a 15 min chart to establish tighter Stop Loss conditions.
Trade Management options:
Option to specify Backtest start and end time.
Trailing Stop, with Activate Level (as % of price) and Trailing Stop (as % of price)
Target Profit Level, (as % of price)
Stop Loss Level, (as % of price)
BUY green triangles and SELL dark red triangles
Trade Order closed colour coded Label:
>> Dark Red = Stop Loss Hit
>> Green = Target Profit Hit
>> Purple = Trailing Stop Hit
>> Orange = Opposite (Sell) Order Close
Trade Management Indication:
Trailing Stop Activate Price = Blue dotted line
Trailing Stop Price = Fuschia solid stepping line
Target Profit Price = Lime '+' line
Stop Loss Price = Red '+' line
Dealing With Renko Charts:
If you choose to use Renko charts, make sure you have enabled the "IS This a RENKO Chart" option, (I have not so far found a way to Detect the type of chart that is running).
If you want non-repainting Renko charts you MUST use TRADITIONAL Renko Bricks. This type of brick is fixed and will not change size.
Also use Renko bricks with WICKS DISABLED. Wicks are not part of Renko, the whole idea of using Renko bricks is not to see the wick noise.
Set you chart Time Frame to the lowest possible one that will build enough bricks to give a reasonable history, start at 1min TimeFrame. Renko bricks are not dependent on time, they represent a movement in price. But the chart candlestick data is used to create the bricks, so lower TF gives more accurate Brick creation.
You want to size your bricks to 2/1000 of the pair price, so for ETHBTC the price is say 0.0805 then your Renko Brick size should be about 2*0.0805/1000 = 0.0002 (round up).
You may find there is some slippage in value, but this can be accounted for in the Backtest by setting your commission a bit higher, for Binance for example I use 0.2%
Special thanks goes to @CryptoRox for providing the initial Risk management Framework in his "How to automate this strategy for free using a chrome extension" example.

MACD Backtesting IndicatorThis Pine Script v5 indicator replicates TradingView's standard MACD with full backtesting capabilities. Traders can adjust all parameters (12,26,9 defaults) through inputs and see real-time performance metrics in the table. Buy/sell signals appear as labeled arrows, matching classic MACD crossover strategy while providing visual backtest results for strategy evaluation.

Daily Candle Bias Backtesting Stats @MaxMaserati This indicator, is a powerful backtesting and probability tool designed to quantify the "follow-through" of specific candle types across different market sessions.
It identifies specific price action setups and tracks whether price hits a "Target" (continuation) or an "Invalidation" (reversal) first, providing real-time win rates for your favorite sessions.
The Candle Bias Stats indicator automatically categorizes every candle based on the MMM candle bias and tracks their historical success rate. It calculates how often a candle's high/low is broken before its opposite end is touched. By breaking this data down into sessions (Asian, London, NY), it identifies high-probability "time-of-day" windows where specific price action setups are most reliable.
MMM CANDLE LOGIC
Bullish Expansion & Breakout Signatures
Bullish Body Close Plus (BuBC Plus): Represents strong bullish momentum where price closes above the previous high and near its own top, signaling that buyers are in complete control.
Bullish Body Close Minus (BuBC Minus): Indicates weak bullish momentum; while the price closes above the previous high, a long top wick shows sellers pushed back, suggesting a potential retest of the previous high.
Bearish Expansion & Breakout Signatures
Bearish Body Close Plus (BeBC Plus): A very strong bearish signal where price closes below the previous low and near its own bottom, indicating sellers are dominant.
Bearish Body Close Minus (BeBC Minus): Signifies weak bearish momentum; the price breaks the previous low but finishes with a long bottom wick as buyers push back, often leading to a retest of the old ceiling.
Bullish Reversal & Trap Signatures (Affinity)
Bullish Affinity Plus (BuAF Plus): A strong bullish reversal where a new low is made, but sellers hit a wall and get trapped, causing price to finish near its top with a long bottom wick.
Bullish Affinity Minus (BuAF Minus): A weak bullish bounce where a new low is made and price finishes back inside the previous range, but buyers lack the energy for a significant move.
Bearish Reversal & Trap Signatures (Affinity)
Bearish Affinity Plus (BeAF Plus): A strong bearish reversal; buyers are trapped after making a new high, and price finishes near its bottom with a long top wick.
Bearish Affinity Minus (BeAF Minus): A weak bearish drop where sellers stop the rise but lack the energy to push price significantly lower.
Neutral & Volatility Signatures
Close Inside Bullish (CI•BuAF): Bullish neutral state where price stays inside the previous candle’s range but finishes in the top half, indicating buyers are slightly more active.
Close Inside Bearish (CI•BeAF): Bearish neutral state where price remains inside the previous box and finishes in the bottom half.
Seek & Destroy Bullish (S&D•BuAF): Bullish volatility characterized by price moving above and below the previous candle before buyers win the battle and close price near the top.
Seek & Destroy Bearish (S&D•BeAF): Bearish volatility where sellers win a high-chaos battle, closing price near the bottom after sweeping both sides of the previous candle.
H4 CANDLE EXAMPLE
Deep Dive: Analysis of the 4H Statistics
The image presents a comprehensive backtest of 4,999 total candles from September 2022 to December 2025. Here is the breakdown of what the interface is telling us:
1. The Strategy: Target vs. Invalidation
The indicator tracks BuBC (Bullish Body Close) and BeBC (Bearish Body Close).
The Target: For a Bullish candle, the target is the High. For a Bearish candle, it is the Low.
The Invalidation: The opposite end of the candle (the Low for Bullish, the High for Bearish).
The Goal: To see which level is touched first in the subsequent bars.
2. Global Performance (The Top Right Table)
Looking at the BuBC (1402 samples) section:
Target First (67.8%): In nearly 7 out of 10 cases, once a 4H candle closes "bullish" (breaking the previous high), the price continues higher to break its own high before it ever returns to take out its own low.
Both Hit (17.7%): This is a critical metric. It represents "Stop Runs" or "Wicks" where price hits the target but also hits the invalidation within the same tracking period.
Efficiency (1.3 Bars): This tells us the "follow-through" is almost immediate. If the trade doesn't work within 1 or 2 candles, the statistical edge drops off significantly.
3. The Session Breakdown (The Bottom Left Table)
This is where the "Edge" is found. Not all hours of the day are created equal.
Asian Late (02:00-06:00) – The "Star" Performer: With a 72.9% Target rate, this is labeled "BEST." It has the lowest "Both%" (6.5%), meaning moves during these hours are incredibly "clean." If a setup forms here, price usually moves directly to the target without looking back.
London Open & Overlap (06:00-14:00): These sessions maintain a high win rate (approx. 70%). This suggests that the European session provides reliable trend continuation for the S&P 500.
NY Session (14:00-18:00) – The "Trap" Zone: This is labeled "WORST" for a reason. While the win rate is basically a coin flip (49.6%), the Both% spikes to 36.7%. This means that even if you are right about the direction, the market is highly likely to "sweep" your stop loss before going to the target. It is the most volatile and "fake-out" prone time for this specific setup.
Summary of the Data
The statistics show that the S&P 500 4H Candle Bias is a highly reliable trend-following indicator, provided you trade it at the right time.
The data suggests a clear three-step logic:
Directional Edge: Both Bullish and Bearish body closes have a natural ~67% probability of continuation.
Timing is Everything: Trading during the Late Asian and London sessions increases your probability of success to over 70% with very low risk of a "fake-out."
Risk Warning: Avoid "Body Close" breakout strategies during the NY Mid-day (14:00-18:00). The statistics prove that this window is dominated by "Seek and Destroy" price action, where price is mathematically likely to hit both your target and your stop, usually hitting the stop first.

Smart MA Crossover BacktesterSmart MA Crossover Backtester - Strategy Overview
Strategy Name: Smart MA Crossover Backtester
Published on: TradingView
Applicable Markets: Works well on crypto (tested profitably on ETH)
Strategy Concept
The Smart MA Crossover Backtester is an improved Moving Average (MA) crossover strategy that incorporates a trend filter and an ATR-based stop loss & take profit mechanism for better risk management. It aims to capture trends efficiently while reducing false signals by only trading in the direction of the long-term trend.
Core Components & Logic
Moving Averages (MA) for Entry Signals
Fast Moving Average (9-period SMA)
Slow Moving Average (21-period SMA)
A trade signal is generated when the fast MA crosses the slow MA.
Trend Filter (200-period SMA)
Only enters long positions if price is above the 200-period SMA (bullish trend).
Only enters short positions if price is below the 200-period SMA (bearish trend).
This helps in avoiding counter-trend trades, reducing whipsaws.
ATR-Based Stop Loss & Take Profit
Uses the Average True Range (ATR) with a multiplier of 2 to calculate stop loss.
Risk-Reward Ratio = 1:2 (Take profit is set at 2x ATR).
This ensures dynamic stop loss and take profit levels based on market volatility.
Trading Rules
✅ Long Entry (Buy Signal):
Fast MA (9) crosses above Slow MA (21)
Price is above the 200 MA (bullish trend filter active)
Stop Loss: Below entry price by 2× ATR
Take Profit: Above entry price by 4× ATR
✅ Short Entry (Sell Signal):
Fast MA (9) crosses below Slow MA (21)
Price is below the 200 MA (bearish trend filter active)
Stop Loss: Above entry price by 2× ATR
Take Profit: Below entry price by 4× ATR
Why This Strategy Works Well for Crypto (ETH)?
🔹 Crypto markets are highly volatile – ATR-based stop loss adapts dynamically to market conditions.
🔹 Long-term trend filter (200 MA) ensures trading in the dominant direction, reducing false signals.
🔹 Risk-reward ratio of 1:2 allows for profitable trades even with a lower win rate.
This strategy has been tested on Ethereum (ETH) and has shown profitable performance, making it a strong choice for crypto traders looking for trend-following setups with solid risk management. 🚀

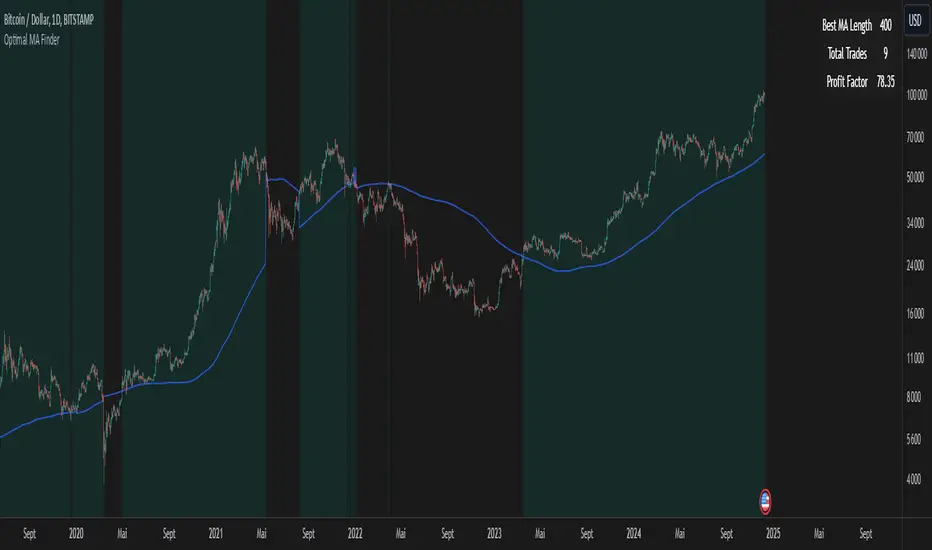
Optimal MA FinderIntroduction to the "Optimal MA Finder" Indicator
The "Optimal MA Finder" is a powerful and versatile tool designed to help traders optimize their moving average strategies. This script combines flexibility, precision, and automation to identify the most effective moving average (MA) length for your trading approach. Whether you're aiming to improve your long-only strategy or implement a buy-and-sell methodology, the "Optimal MA Finder" is your go-to solution for enhanced decision-making.
What Does It Do?
The script evaluates a wide range of moving average lengths, from 10 to 500, to determine which one produces the best results based on historical data. By calculating critical metrics such as the total number of trades and the profit factor for each MA length, it identifies the one that maximizes profitability. It supports both simple moving averages (SMA) and exponential moving averages (EMA), allowing you to tailor the analysis to your preferred method.
The logic works by backtesting each MA length against the price data and assessing the performance under two strategies:
Buy & Sell: Includes both long and short trades.
Long Only: Focuses solely on long positions for more conservative strategies.
Once the optimal MA length is identified, the script overlays it on the chart, highlighting periods when the price crosses over or under the optimal MA, helping traders identify potential entry and exit points.
Why Is It Useful?
This indicator stands out for its ability to automate a task that is often labor-intensive and subjective: finding the best MA length. By providing a clear, data-driven answer, it saves traders countless hours of manual testing while significantly enhancing the accuracy of their strategies. For example, instead of guessing whether a 50-period EMA is more effective than a 200-period SMA, the "Optimal MA Finder" will pinpoint the exact length and type of MA that has historically yielded the best results for your chosen strategy.
Key Benefits:
Precision: Identifies the MA length with the highest profit factor for maximum profitability.
Automation: Conducts thorough backtesting without manual effort.
Flexibility: Adapts to your preferred MA type (SMA or EMA) and trading strategy (Buy & Sell or Long Only).
Real-Time Feedback: Provides actionable insights by plotting the optimal MA directly on your chart and highlighting relevant trading periods.
Example of Use: Imagine you're trading a volatile stock and want to optimize your long-only strategy. By applying the "Optimal MA Finder," you discover that a 120-period EMA results in the highest profit factor. The indicator plots this EMA on your chart, showing you when to consider entering or exiting positions based on price movements relative to the EMA.
In short, the "Optimal MA Finder" empowers traders by delivering data-driven insights and improving the effectiveness of trading strategies. Its clear logic, combined with robust automation, makes it an invaluable tool for both novice and experienced traders seeking consistent results.