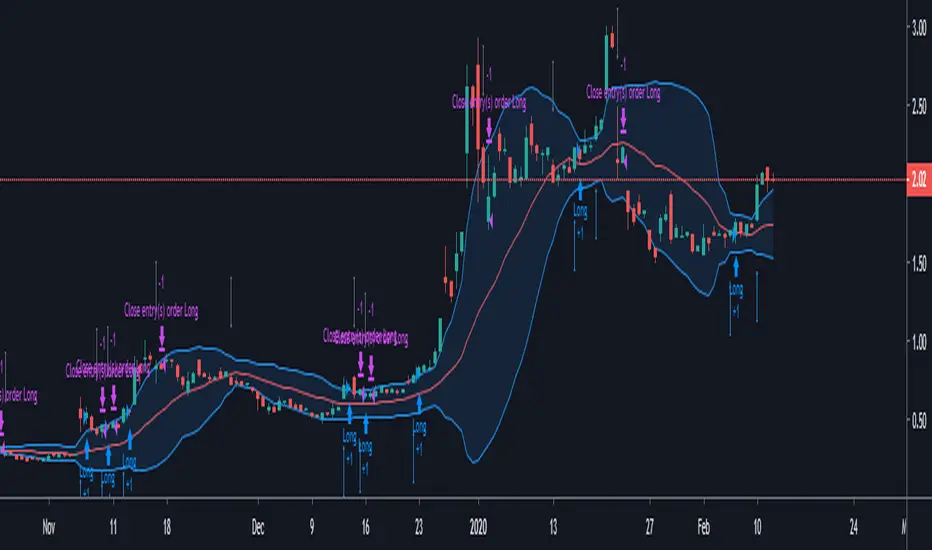
NoScoobies Bollinger BandsBollinger Bands strategy that I am trying out, however I can't get my strategy.close to work. Looking for help.Chiến lược Pine Script®của dc4freeCập nhật 222248
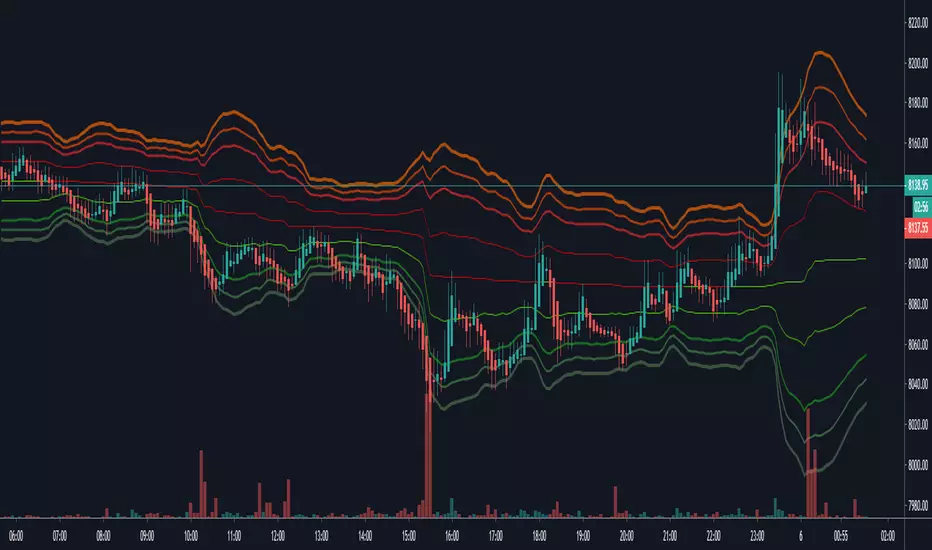
Multiple EMA deviation rate bandsMultiple EMA deviation rate bandsChỉ báo Pine Script®của corn_traderCập nhật 23
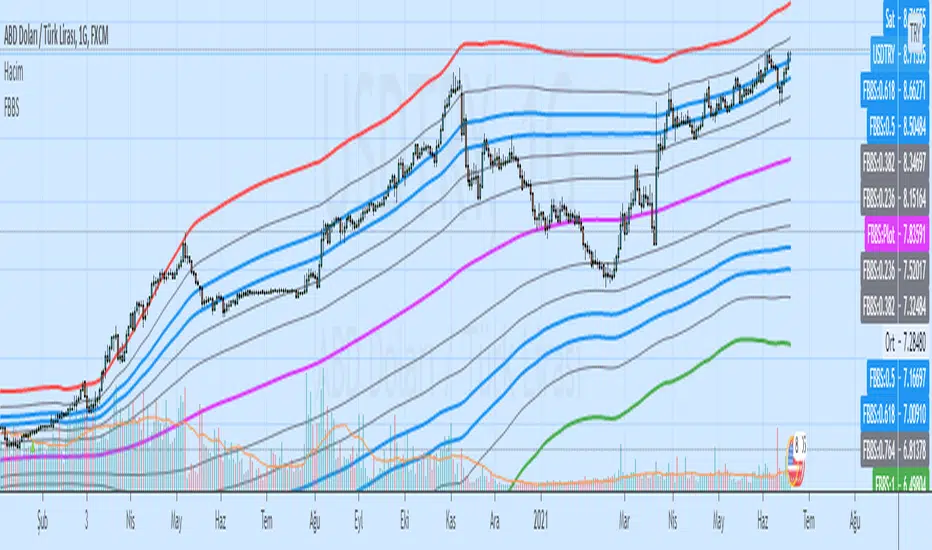
Fibonacci Bollinger Bands TEMAFibonacci Bollinger Bands TEMAChỉ báo Pine Script®của ceyhunCập nhật 11243
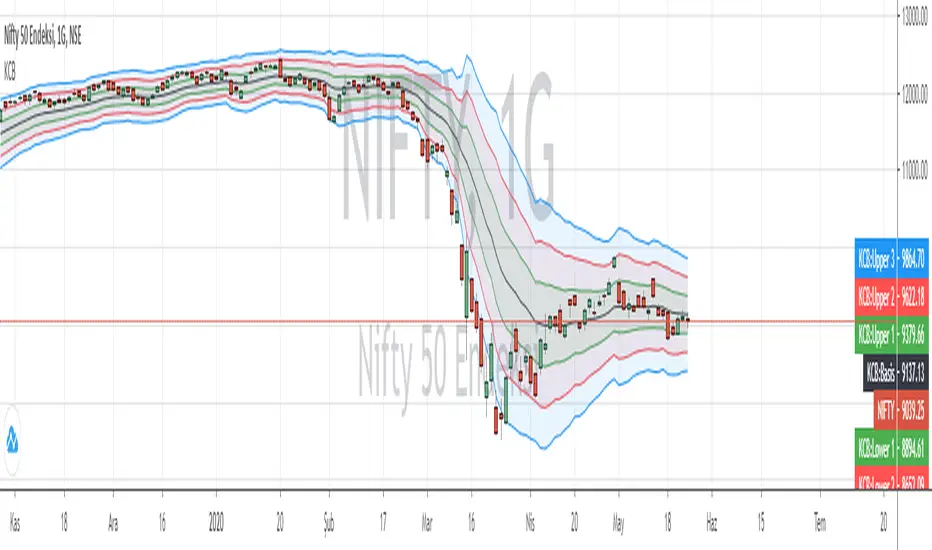
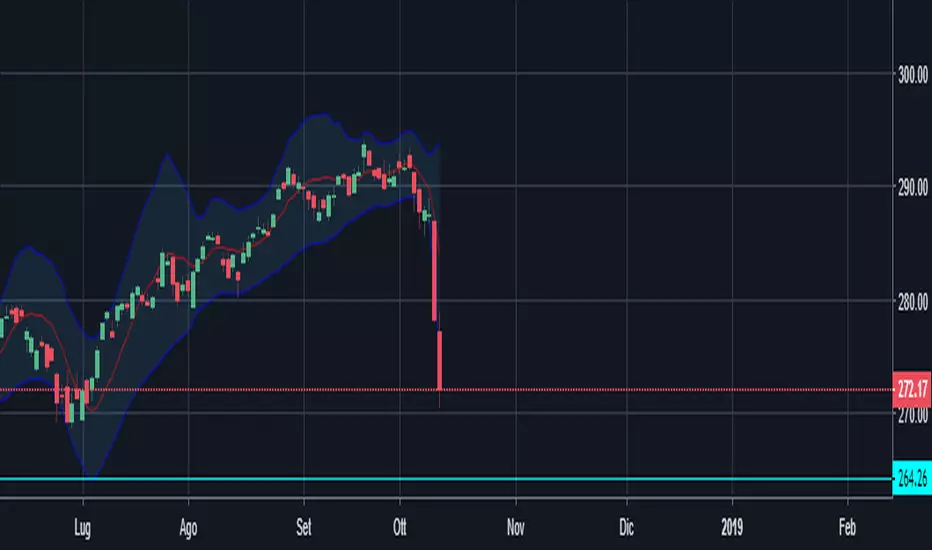
Bollinger Bands Contraction and ExpansionBollinger Bands Contraction and ExpansionChỉ báo Pine Script®của ceyhunCập nhật 66578
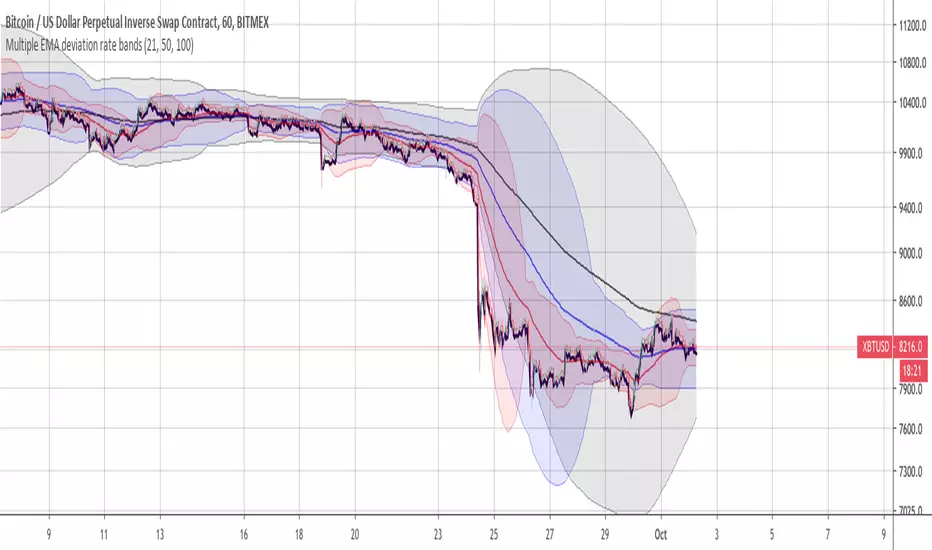
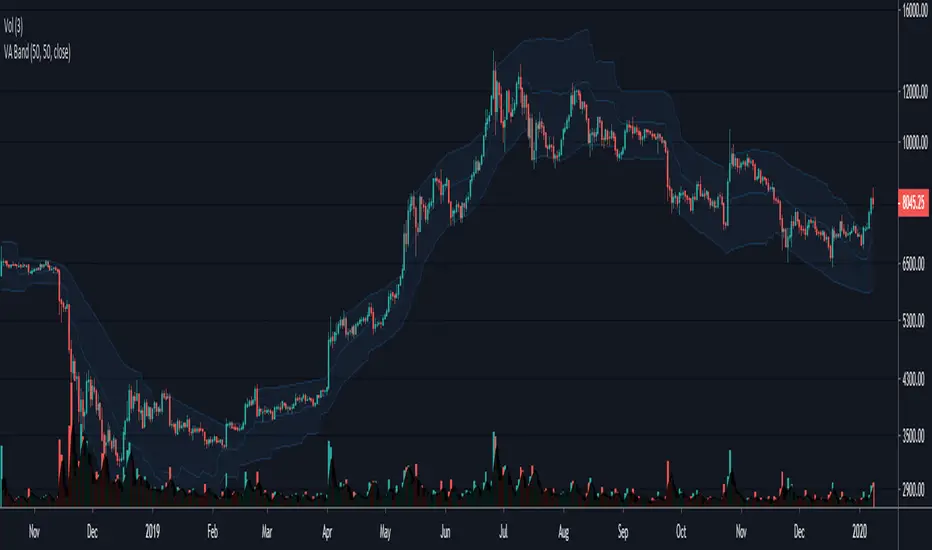
Volatility Adjusted Bands - JD This indicator gives a likely trading range based on the volatility of the past x amount of bars, measured against a certain moving average. The indicator can be used as an alternative for BBands. It gives approx. the same "trend-side" lines (upper line in uptrend, lower line in down trend) as the Bollinger Bands, but the opposite line follows closer on price, Instead of "flying out" to the other direction like in BBands. As a comparison, the BBands for the same length (50 period) are added on the chart. JD. #NotTradingAdvice #DYOR I build these indicators for myself and provide them open source, to use for free to use and improve upon, as I believe the best way to learn is toghether.Chỉ báo Pine Script®của DuyckCập nhật 44178
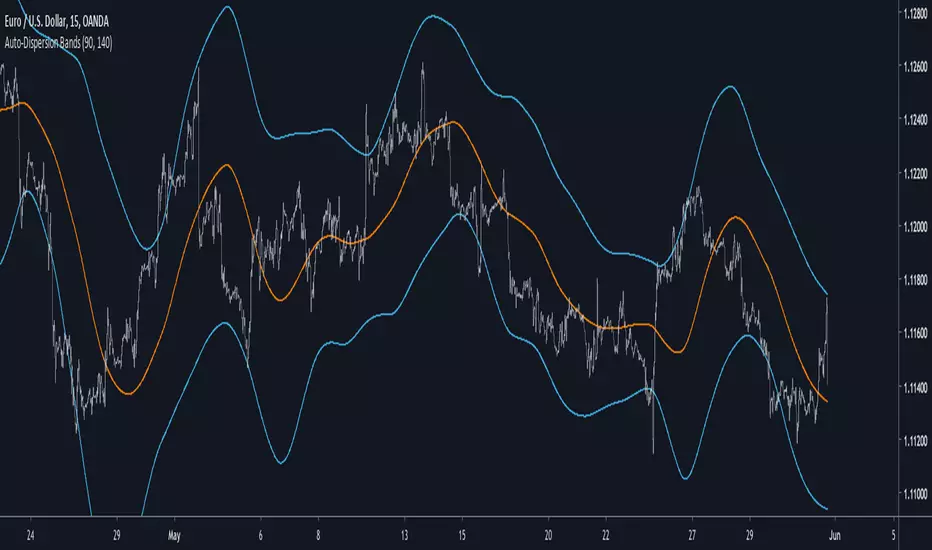
Auto-Dispersion BandsIntroduction A really old indicator as well, thus i have no much ideas of what is going on with it, but i know that those bands returns good reversals points. The indicator don't use standard deviation, instead its a simple differencing of the price and the price length bars back who will provide a dispersion measurement, thus the name auto-dispersion. The Indicator The smooth parameter allow the band to cross the price, if smooth is low the chance of crosses are lower. smooth = 3 Chỉ báo Pine Script®của alexgrover22137
Fibonacci Bollinger Bands VWMAFibonacci Bollinger Bands VWMAChỉ báo Pine Script®của ceyhunCập nhật 87
Bollinger Bands MTF [LonesomeTheBlue]With this script you can follow Bollinger Bands for current and higher time frame together. Higher time frame is calculated by script. if current period 1m => higher period=5m 3m => higher period=5m 5m => higher period=15m 15m => higher period=1h 30m => higher period=1h 45m => higher period=1h 1h => higher period=4h 2h => higher period=4h 3h => higher period=4h 4h => higher period=1day 1day => higher period=1week Chỉ báo Pine Script®của LonesomeTheBlueCập nhật 22763
Trend Trader Bands Strategy This is plots the indicator developed by Andrew Abraham in the Trading the Trend article of TASC September 1998 It was modified, result values wass averages. And draw two bands above and below TT line.Chỉ báo Pine Script®của HPotter99
Percentage BandsA different version of bollinger bands, I use percentage difference instead of standard deviation.Chiến lược Pine Script®của ridvansozen155144
Trend Trader Bands This is plots the indicator developed by Andrew Abraham in the Trading the Trend article of TASC September 1998 It was modified, result values wass averages. And draw two bands above and below TT line.Chỉ báo Pine Script®của HPotter7794
Standard Error Bandswith the best settings - this indicator is a better version of the bollinger bands, because it uses a linear regression . Use this carefully and with other indicators.Chỉ báo Pine Script®của Alex_Chart2282
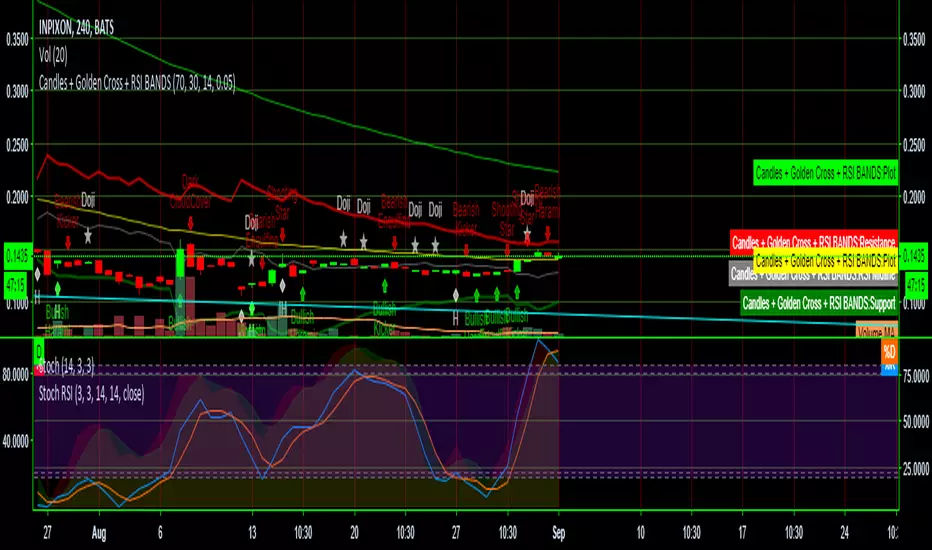
Candles + Golden Cross + RSI BANDSThis script combines three scripts for ease of use RSI Bands LazyBear Golden Cross MichMexTrading Candlestick patterns identified repo32 I combined them because they work exceptionally well together in identifying reversals and other potential changes Chỉ báo Pine Script®của d4wn0ff4731190
Prime Number Bands Strategy Determining market trends has become a science even though a high number or people still believe it’s a gambling game. Mathematicians, technicians, brokers and investors have worked together in developing quite several indicators to help them better understand and forecast market movements. The Prime Number Bands indicator was developed by Modulus Financial Engineering Inc. This indicator is charted by indentifying the highest and lowest prime number in the neighborhood and plotting the two series as a band. WARNING: - This script to change bars colors.Chỉ báo Pine Script®của HPotter67
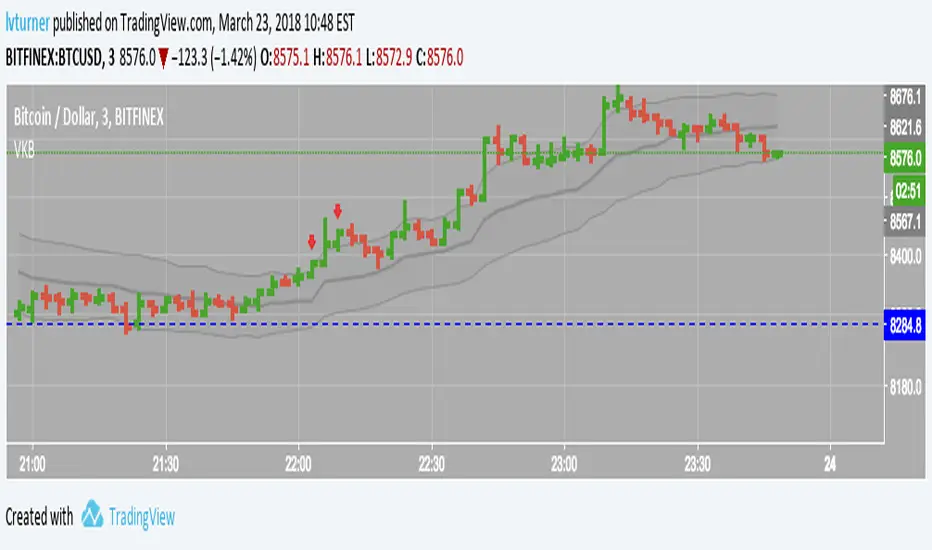
VWMA Keltner BandsKind of like Keltner Channel/Bands (stockcharts.com) but using VWMA instead so that volume is taken in to account. Outside the upper band can considered to be 'overbought' and outside the lower band can be considered to be 'oversold' Has option to highlight signals (i.e. when price closes outside a channel) and also the option to only display signals if the price is on the correct side of VWAP (i.e. no sell signals if price is above VWAP)Chỉ báo Pine Script®của lvturnerCập nhật 22263
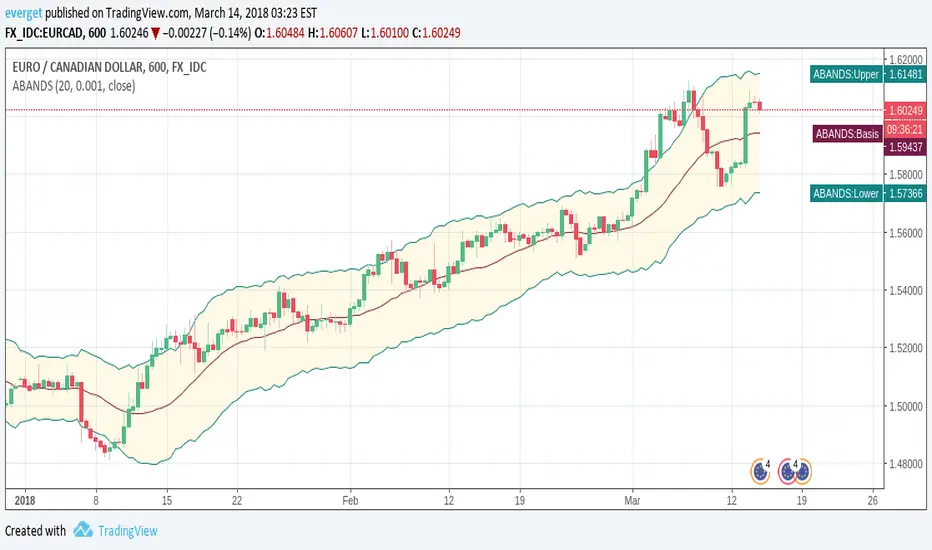
Acceleration BandsAcceleration Bands indicator script. This indicator was originally developed by Price Headley.Chỉ báo Pine Script®của everget66195