Tìm kiếm tập lệnh với "bitcoin"
JackBot Scalper v6Jackbot Scalper v6 Update
In Version 6, Jackbot has improved performance on higher time frames with close to 85% success rate on 1-hour times frames and 70% success rate on 15-minute time frames.
Who
I am Jack Donaghy, a crypto trader and wealth strategist at an international asset management firm. I have traded billions in assets for clients and have grown a portfolio of personal assets by nearly 2200% within the last 1.5 years from trading. I originally invested in cryptocurrencies in November of 2016 and have been catching waves ever since. This bot is for those interested in scalping methods.
What
Jackbot Pro Scalper is a scalping study for Bitcoin that operates on small timeframes. It has a 60-70% success rate and operates with the goal of maximizing gains while minimizing losses. This bot works well with leveraged strategies as it pursues both long and short positions. While I primarily use the bot on BitMex, I have seen good success on Bitfinex with various USDT pairs including VEN and ETH.
When
With v6, the best results have come from 13, 15, and 17-minute charts with incredible success found on the 1-hour charts.
How
The bot works by 1. Defining its entry point. 2. Defining a take profit 3. Defining a stop loss. The magic of the bot is that it will not close a trade at the take profit, if volume and price are increasing, it will hold the exit until another indicator determines a reversal of the trend. More than that would ruin the logic so you will just have to see for yourself.
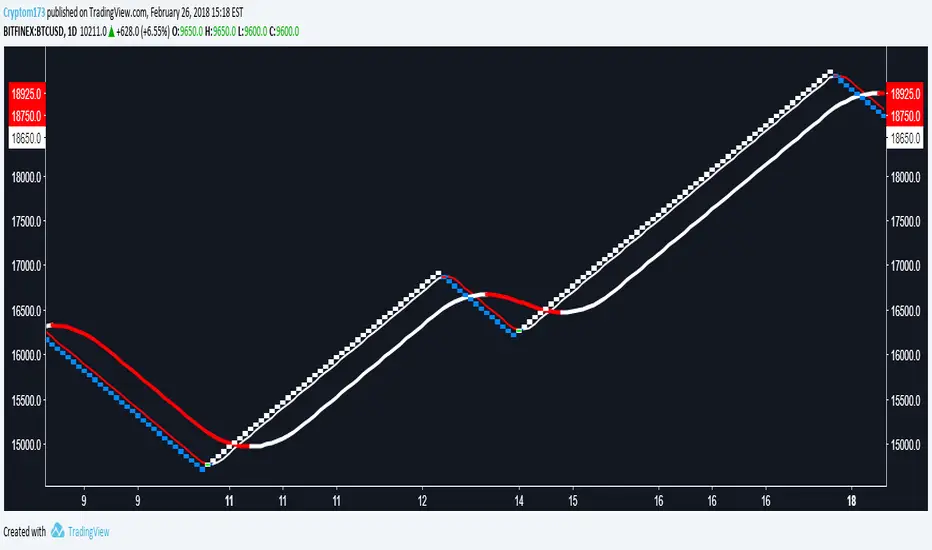
To Trade
Large Spikes = Entries (Green = Long, Red = Short)
Small Spikes = Take Profit (Green = Long Exit, Red = Short Exit)
Medium Spikes = Stop Loss (Purple = Long SL, Yellow = Short SL)
Previous Results
Backtested, Jackbot v6 shows that with 1 Bitcoin (unleveraged) you can make about 12K in a 1.5 month period. My personal experience was trading a test amount of Bitcoin on a particularly good run at 25x leverage using 25% of a test portfolio It went from 0.015 Bitcoin to 0.091 within 10 days. See ibb.co (This test was from V5.4 which V6 has improved upon.)
Disclaimer: This strategy is by no means perfect and not every trade will be a winner. It is a tool in your belt, not a perfect 100% trader. Previously, results show with a 25x leveraged position, the losses are ~20% before it will cut off the trade, however, the gains can be 40%+ (As the bot continues to run in certain conditions, it will often pick up major moves and hold them for longer.) It can have bad runs and a slew of poor entries, especially in tight volatile ranges.
PLEASE NOTE: This strategy can struggle with chop following major moves, if you are manually entering, consider other market conditions before entry if the price is in a tight range.
Cost
Jackbot will be offered for 0.1 Bitcoin and will be limited to the first 100 people who apply.
Taint's Chaikin Money FlowAn adaptation of the standard Chaikin Money Flow. I've added the appropriate ranges to the indicator. Signals between 0.05 and -0.05 are to be disregarded. Signals greater than 0.2 or -0.2 are very strong signals. The addition of a moving average of the the Money Flow line has proven to be quite beneficial through back testing. It's best use case is for confirming trend/momentum changes on larger time frames when trading Bitcoin. I find the VWMA and SMA work best. EMA has it's uses, but I've found a 50 period EMA is more useful on shorter time frames. CMF is a powerful tool if used correctly.

JackBot Scalper V5.4 Who
I am Jack Donaghy, a crypto trader and wealth strategist at an international asset management firm. I have traded billions in assets for clients and have grown a portfolio of personal assets by nearly 2200% within the last 1.5 years from trading. I originally invested in cryptocurrencies in November of 2016 and been catching waves ever since. This bot is for those interested in scalping methods.
What
Jackbot Pro Scalper is scalping study for bitcoin that operates on small timeframes. It has a 60-70% success rate and operates with the goal of maximizing gains while minimizing losses. This bot works well with leveraged strategies as pursues both long and short positions. While I primarily use it on BitMex, I have seen good success on Bitfinex.
When
5-30 minute charts, longer time frames can work but have not been successful enough to warrant publishing. Best results have come from 13 and 17-minute timeframes.
How
The bot works by 1. Defining its entry point. 2. Defining a take profit 3. Defining a stop loss. The magic of the bot is that it will not close a trade at the take profit, if volume and price are increasing, it will hold the exit until another indicator determines a reversal of the trend. More than that would ruin the logic so you will just have to see for yourself.
To Trade
Large Spikes = Entries (Green = Long, Red = Short)
Small Spikes = Take Profit (Green = Long Exit, Red = Short Exit)
Medium Spikes = Stop Loss (Purple = Long SL, Yellow = Short SL)
Previous Results
Backtested, this bot shows that with 1 Bitcoin (unleveraged) you can make about 10K in a 1.5 month period. My personal experience was trading a test amount of bitcoin on a particularly good run at 25x leverage using 25% of a test portfolio It went from 0.015 bitcoin to 0.091 within 10 days. See ibb.co
Disclaimer: This strategy is by no means perfect and not every trade will be a winner. Previously results show with a 25x leveraged position, the losses are ~20% before it will cut off the trade, however, the gains can be 40%+ (As the bot continues to run in certain conditions, it will often pick up major moves and hold them for longer.) It can have bad runs and a slew of poor entries, especially in tight volatile ranges.
PLEASE NOTE: This strategy can struggle with chop following major moves, if you are manually entering, consider other market conditions before entry if the price is in a tight range.

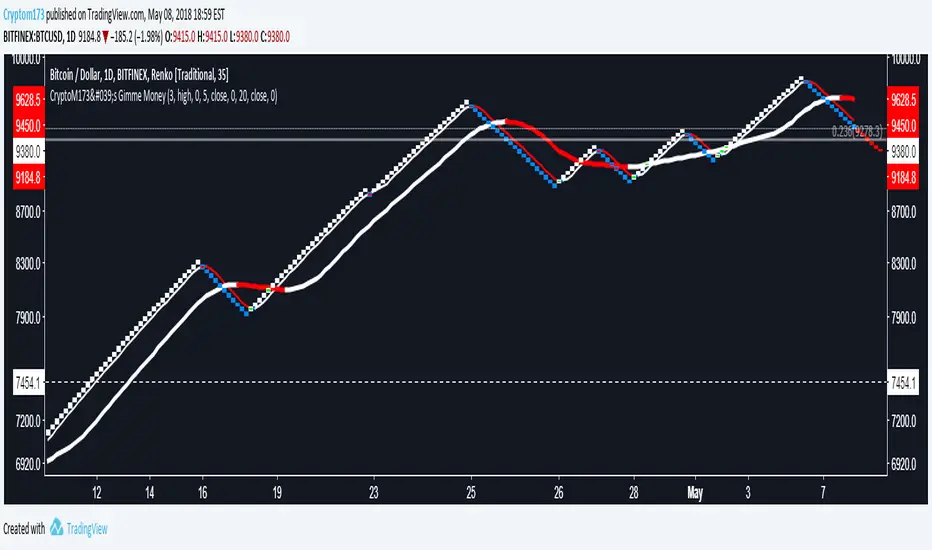
CryptoM173's Gimme MoneyLatest version. Nobody gave me feedback and managing requests to add people became a PITA. Enjoy.
I like money, you like money, this set up has the potential to make a LOT of it. That being said, I do NOTmake any warranties of this making you money, nor do I guarantee you will NOT lose money. In the end, you're the one configuring it and interpreting the results. Providing that you DO set it up correctly and it makes you obscene amounts of money, donations are always welcome (addresses below).
Before you start, it's probably you read EVERYTHING below.
You'll have to do some tweaking of the MA's to find a strat that best suits your needs. It is an indicator you're welcome to use to assist in your trading decisions. I made this script for renko charts and trading bitcoin -1.64% because the standard strat wasn't working out. if you find you're getting a lot of consecutive colored bars or crosses on Renko, you may need to switch from ATR 14 to something like Traditional 50. You will need to adjust the "box value" for traditional renko to fit the asset you're working with, on the time frame you're trading on. Smaller values (i.e. on bitcoin -1.64% I use a box value of 50 on 4hr and 1D with absurd success) but you need to make sure they're not too small, otherwise small moves may appear larger than they are, resulting in a bunch of break-even trades. If you're going to be trading cryptocurrency, it's easiest to switch back to ATR14 to get an idea of the Average Trading range to have a reference point to start from trading btc -1.64% (i.e .000034 rather than 50).
It's a great tool if you're looking to carry both swap and futs positions and keep an eye on the short term swap opportunities while monitoring the status of your futs position and help decide whether or not to close a long at a correction or not and while this strategy has been most effective for me with Renko bars, it's been very useful for monitoring futs positions on traditional charts.
For access, feel free to DM -0.34% me on twitter, @CryptoM173
If you're the generous type, feel free to donate Bitcoin to: 3BMEXWz6Es7iLdi9zAyMWWHHZPNbMKPqrV
CryptoM173's Gimme Money v1.1I like money, you like money, this set up has the potential to make a LOT of it. That being said, I do NOT make any warranties of this making you money, nor do I guarantee you will NOT lose money. In the end, you're the one configuring it and interpreting the results. Providing that you DO set it up correctly and it makes you obscene amounts of money, donations are always welcome (addresses below).
Before you start, it's probably you read EVERYTHING below.
You'll have to do some tweaking of the MA's to find a strat that best suits your needs. It is an indicator you're welcome to use to assist in your trading decisions. I made this script for renko charts and trading bitcoin because the standard strat wasn't working out. if you find you're getting a lot of consecutive colored bars or crosses on Renko, you may need to switch from ATR 14 to something like Traditional 50. You will need to adjust the "box value" for traditional renko to fit the asset you're working with, on the time frame you're trading on. Smaller values (i.e. on bitcoin I use a box value of 50 on 4hr and 1D with absurd success) but you need to make sure they're not too small, otherwise small moves may appear larger than they are, resulting in a bunch of break-even trades. If you're going to be trading cryptocurrency, it's easiest to switch back to ATR14 to get an idea of the Average Trading range to have a reference point to start from trading btc (i.e .000034 rather than 50).
It's a great tool if you're looking to carry both swap and futs positions and keep an eye on the short term swap opportunities while monitoring the status of your futs position and help decide whether or not to close a long at a correction or not and while this strategy has been most effective for me with Renko bars, it's been very useful for monitoring futs positions on traditional charts.
For access, feel free to DM me on twitter, @CryptoM173
If you're the generous type, feel free to donate Bitcoin to: 3BMEXWz6Es7iLdi9zAyMWWHHZPNbMKPqrV
BTC Price Spread - Coinbase & Futs - Premiums & DiscountsThis indicator takes the price of Bitcoin on Coinbase and the futures price on Mex, and compares it the average price of Bitcoin across other major exchanges.
This essentials give us a spread at which Bitcoin is going for.
In turn, this could be a possible tool to help determine market sentiment.
This indicator was created for experimental purposes.
Use at your own digression.

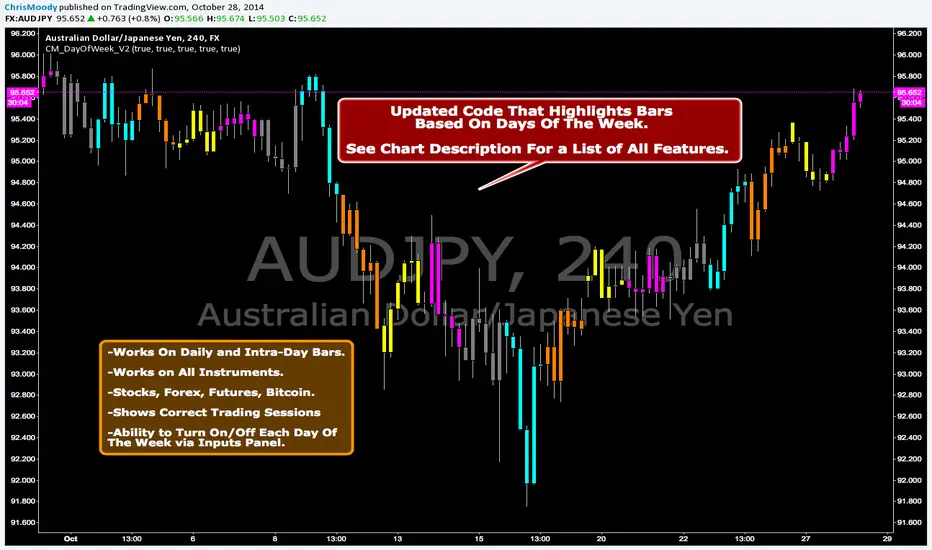
CM_DayOfWeek All Instruments V2Updated Code That Highlights Bars Based On Days Of The Week.
Works On Daily and Intra-Day Bars.
Works on All Instruments. Stocks, Forex, Futures, Bitcoin.
Shows Correct Trading Sessions!!!
Ability to Turn On/Off Each Day Of The Week via Inputs Panel.
Justin's Bitcoin Power Law PredictorJustin's MSTR Powerlaw Price Predictor is a Pine Script v6 indicator for TradingView that adapts Giovanni Santostasi’s Bitcoin power law model to forecast MicroStrategy (MSTR) stock prices. Using the formula Price = A * (daysSinceGenesis)^B, it calculates fair, upper, and floor prices with constants A_fair = 1.16e-17, A_floor = 0.42e-17, and B = 5.82, starting from Bitcoin’s genesis (January 3, 2009). The script plots these prices, displays values in a table.
Source: www.ccn.com

Pi Cycle Top Indicator - mychaelgoPlots the original Pi Cycle Top moving averages and marks bars where the 111DMA is rising and crosses above the 350DMA×2, often coinciding with Bitcoin cycle peaks. Includes a label with the signal price.

Sat Stacking Strategies Simulation (SSSS)Sat Stacking Strategies Simulation (SSSS)
This indicator simulates and compares different Bitcoin stacking strategies over time, allowing you to visualize performance, cost basis, and stacking behavior directly on your chart.
Core Features:
Three Stacking Strategies
• Trend-Based – Stack only when price is above/below a long-term SMA.
• Stack the Dip – Buy during sharp pullbacks or oversold conditions.
• Price Zone – Stack only in “cheap”, “fair”, or “expensive” zones based on a simulated Short-Term Holder (STH) cost basis.
Always Stack Benchmark
Compare your chosen strategy against a simple “Always Stack” approach for a real-world DCA reference.
Performance Metrics Table
Track:
• Total Fiat Added
• Total BTC Accumulated
• Current Value
• Average Cost per BTC
• PnL %
• CAGR
• Sharpe Ratio & Stdev
• Stack Events & Time Underwater
Advanced Options
• Simulate cash-secured puts on unused fiat.
• Simulate covered calls on BTC holdings.
• Roll over unused stacking amounts for future buys.
This tool is designed for Bitcoiners, stackers, and DCA enthusiasts who want to backtest and visualize their stacking plan—whether you keep it simple or go full quant.
Sometimes the best alpha is just showing up every week with your wallet open… and occasionally wearing a helmet. 🪖💰

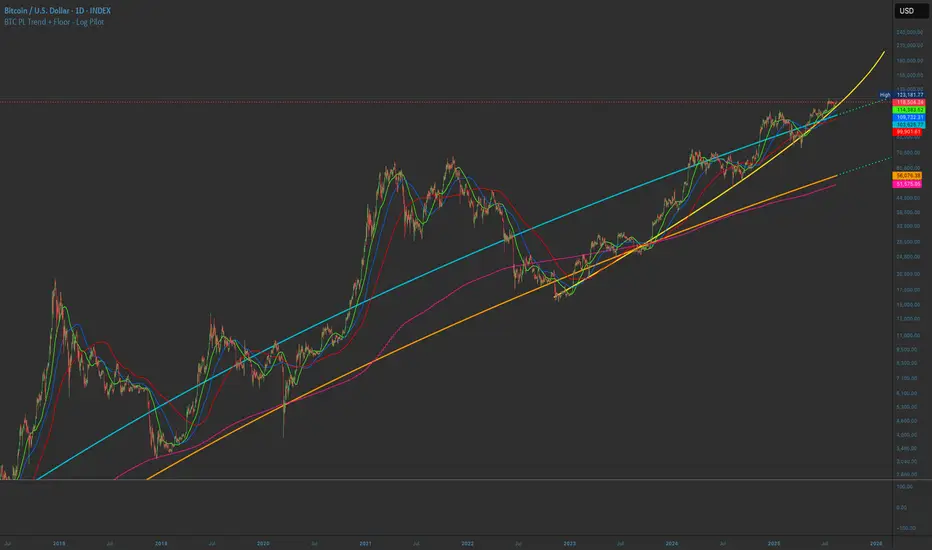
BTC PL Trend + Floor - Log PilotBTC Power Law Trend + Floor with forward projection.
Sky blue for the trend. Neon orange for the floor. Both project forward in dotted green.
Tracks Bitcoin’s long-term arc and structural support through time since Genesis.
HIFI BTC Daily Hashrate Momentum OscillatorThe "HIFI BTC Daily Hashrate Momentum Oscillator" indicator is an oscillator that analyzes the "health" and confidence of miners in the Bitcoin network. It measures the momentum of hashrate changes using its deviation from the 30-day and 60-day moving averages. A rising hashrate is often a leading or confirming bullish trend indicator for the price of BTC.
Main Idea
Hashrate is the total computing power involved in mining. Its growth indicates increased investment in network security and miners' confidence in future profitability.
Blue Oscillator (fast): Shows the short-term dynamics of hashrate growth.
Green Oscillator (slow): Indicates the long-term trend of hash rate changes.
Chart background: The green background signals the acceleration of the hash rate growth (short-term momentum is higher than long-term), which is a positive sign.
How to Read Signals
A Buy signal appears when two fundamental conditions coincide:
Growth acceleration: The short-term hashrate momentum becomes stronger than the long-term one (the blue line crosses the green one from bottom to top). This indicates that miners are actively building capacity.
Exit from stagnation: This acceleration occurs after a period of weak hashrate growth or decline (the green line is below the red dashed line).
This combination indicates the potential start of a new cycle of growth and confidence in the network, which historically has often preceded the rise in the price of Bitcoin itself.
Disclamer: This indicator is an analysis tool and should not be considered as a direct financial recommendation. Always do your own analysis before making trades.

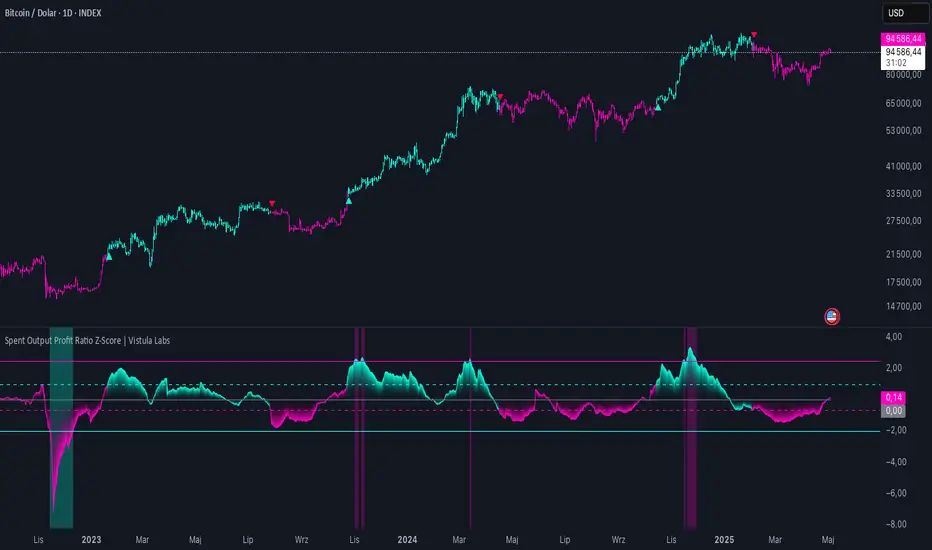
Spent Output Profit Ratio Z-Score | Vistula LabsOverview
The Spent Output Profit Ratio (SOPR) Z-Score indicator is a sophisticated tool designed by Vistula Labs to help cryptocurrency traders analyze market sentiment and identify potential trend reversals. It leverages on-chain data from Glassnode to calculate the Spent Output Profit Ratio (SOPR) for Bitcoin and Ethereum, transforming this metric into a Z-Score for easy interpretation.
What is SOPR?
Spent Output Profit Ratio (SOPR) measures the profit ratio of spent outputs (transactions) on the blockchain:
SOPR > 1: Indicates that, on average, coins are being sold at a profit.
SOPR < 1: Suggests that coins are being sold at a loss.
SOPR = 1: Break-even point, often seen as a key psychological level.
SOPR provides insights into holder behavior—whether they are locking in profits or cutting losses—making it a valuable gauge of market sentiment.
How It Works
The indicator applies a Z-Score to the SOPR data to normalize it relative to its historical behavior:
Z-Score = (Smoothed SOPR - Moving Average of Smoothed SOPR) / Standard Deviation of Smoothed SOPR
Smoothed SOPR: A moving average (e.g., WMA) of SOPR over a short period (default: 30 bars) to reduce noise.
Moving Average of Smoothed SOPR: A longer moving average (default: 180 bars) of the smoothed SOPR.
Standard Deviation: Calculated over a lookback period (default: 200 bars).
This Z-Score highlights how extreme the current SOPR is compared to its historical norm, helping traders spot significant deviations.
Key Features
Data Source:
Selectable between BTC and ETH, using daily SOPR data from Glassnode.
Customization:
Moving Average Types: Choose from SMA, EMA, DEMA, RMA, WMA, or VWMA for both smoothing and main averages.
Lengths: Adjust the smoothing period (default: 30) and main moving average length (default: 180).
Z-Score Lookback: Default is 200 bars.
Thresholds: Set levels for long/short signals and overbought/oversold conditions.
Signals:
Long Signal: Triggered when Z-Score crosses above 1.02, suggesting potential upward momentum.
Short Signal: Triggered when Z-Score crosses below -0.66, indicating potential downward momentum.
Overbought/Oversold Conditions:
Overbought: Z-Score > 2.5, signaling potential overvaluation.
Oversold: Z-Score < -2.0, indicating potential undervaluation.
Visualizations:
Z-Score Plot: Teal for long signals, magenta for short signals.
Threshold Lines: Dashed for long/short, solid for overbought/oversold.
Candlestick Coloring: Matches signal colors.
Arrows: Green up-triangles for long entries, red down-triangles for short entries.
Background Colors: Magenta for overbought, teal for oversold.
Alerts:
Conditions for Long Opportunity, Short Opportunity, Overbought, and Oversold.
Usage Guide
Select Cryptocurrency: Choose BTC or ETH.
Adjust Moving Averages: Customize types and lengths for smoothing and main averages.
Set Thresholds: Define Z-Score levels for signals and extreme conditions.
Monitor Signals: Use color changes, arrows, and background highlights to identify opportunities.
Enable Alerts: Stay informed without constant chart watching.
Interpretation
High Z-Score (>1.02): SOPR is significantly above its historical mean, potentially indicating overvaluation or strong bullish momentum.
Low Z-Score (<-0.66): SOPR is below its mean, suggesting undervaluation or bearish momentum.
Extreme Conditions: Z-Scores above 2.5 or below -2.0 highlight overbought or oversold markets, often preceding reversals.
Conclusion
The SOPR Z-Score indicator combines on-chain data with statistical analysis to provide traders with a clear, actionable view of market sentiment. Its customizable settings, visual clarity, and alert system make it an essential tool for both novice and experienced traders seeking an edge in the cryptocurrency markets.
Global M2 Money Supply Top20 + Offset & WaveThe M2 Top20 is a global aggregation of the M2 money supply from the 20 largest economies in the world , providing a comprehensive view of the total liquidity in the global financial system. It is expressed in trillions of USD.
This script calculates and visualizes the M2 Money Supply of the Top 20 Global Economies, adjusted to various timeframes (4H, 1D, 1W, 1M) with customizable offset adjustments (in days) from -1000 days to +1000 days. This indicator includes data from the Americas, Europe, Africa, and the Asia Middle East , offering a diverse and balanced representation of major economic regions. The M2 of each country has been converted to USD.
Additionally, the user can set a minimum and maximum offset to create a wave around the main offset and expand the comparison.
Combining these options, this indicator enables users to visualize a range of the global money supply, making it useful for market analysis, economic forecasting, and understanding macroeconomic trends. This indicator is particularly valuable for traders and analysts interested in understanding the dynamics of global monetary systems and their potential impact on financial markets.
Key Features:
Global M2 Money Supply calculation from the Top 20 Economies.
Adjustable Offset: Adjust the offset to align the indicator with the best bar. Adjustment in days, usable on different timeframes (1D, 1W, 4H, 1M).
Wave Projection: Displays a "probability cloud"—a smoothed area that shows the probable path of Bitcoin, derived from shifts in global liquidity.
Min/Max Offset Adjustments: Customizable offsets allow you to determine the range of future windows, helping to shape the wave and better identify liquidity-driven turning points.
Use Cases:
Economic Forecasting: Identify trends in global money supply and their potential market impact (e.g., historically leads Bitcoin price by +/- 78 days to +/-108 days).
Market Analysis: Track the growth or contraction of money supply across key economies.
Macro-Economic Analysis: Understand the relationship between monetary policies and market performance.
How to use:
Add the indicator to your chart.
Set the timeframe to 1D to customize the offset.
Set the Offset (in days).
Set the Offset Range Minimum and Maximum.
Show/Hide the Range Wave
.
Use offset = 0 to have the indicator align directly with the current data, without any shift, providing a baseline for comparison with the most recent market conditions.
Countries included in the M2 Top20:
China (CN), Japan (JP), South Korea (KR), Hong Kong (HK), Taiwan (TW), India (IN), Saudi Arabia (SA), Thailand (TH), Vietnam (VN), United Arab Emirates (AE), Malawi (MW) – Africa, United States (US), Canada (CA), Brazil (BR), Mexico (MX), Eurozone (EU), United Kingdom (GB), Russia (RU), Poland (PL), Switzerland (CH).
These countries were selected from the ranking of the World Economy Indicator of Trading View .

Gabriel's Crypto Cycle Master [Multi-Asset]🧠 Gabriel's Crypto Cycle Master
Gabriel’s Crypto Cycle Master is a comprehensive macro valuation tool designed to identify long-term accumulation and distribution zones for any crypto asset using custom on-chain and price-based models.
🔹 Fully Multi-Asset Support
Manually input full tickers from COINMETRICS, GLASSNODE, or INDEX to track:
Realized Market Cap
On-chain Supply
Total Transaction Volume
USD-denominated Price
🔹 Core Metrics Modeled
This script computes major macroeconomic valuation layers based on widely researched concepts:
Realized Price – Network's cost basis
Top Cap – 35× average historical cap
Delta Top – Gap between Realized Price and Average Cap
CVDD – Cumulative Value Days Destroyed
Terminal Price – Network floor based on age and velocity
Balanced Price – Realized minus Terminal (via regression)
🔹 Advanced Bands for Over/Undervaluation
Around Realized Price, this tool dynamically plots:
Golden Ratio Band (×φ) — "Warm Zone" undervaluation
Euler's e Band (×e) — "Caution Zone" deeper value
Pi Band (×π) — "Overheated" zone when crossed upward
🔹 Built-in Alerts
Alerts fire when:
Price crosses below or above any band
Price drops under Terminal Price
Price recovers above the network floor
🔹 Ideal For
Long-term crypto cycle investors
On-chain analysts
DCA accumulation and distribution timing
Macro-level Bitcoin or ETH valuation zones
⚙️ Setup
Manually enter tickers for Market Cap, Supply, Volume, and Price for your preferred crypto asset.
Adjust CVDD cap (21M for BTC, ~120M for ETH) if analyzing a different coin.
Enable/disable specific valuation layers and alert bands via checkboxes.
Built by OneWallStreetQuant | Dynamic adaptation by Gabriel
Published for educational and cycle analysis use — not financial advice.
Ideal for Daily Charts, since the estimate formula was created on that timeframe.

Cash And Carry Arbitrage BTC Compare Month 6 by SeoNo1Detailed Explanation of the BTC Cash and Carry Arbitrage Script
Script Title: BTC Cash And Carry Arbitrage Month 6 by SeoNo1
Short Title: BTC C&C ABT Month 6
Version: Pine Script v5
Overlay: True (The indicators are plotted directly on the price chart)
Purpose of the Script
This script is designed to help traders analyze and track arbitrage opportunities between the spot market and futures market for Bitcoin (BTC). Specifically, it calculates the spread and Annual Percentage Yield (APY) from a cash-and-carry arbitrage strategy until a specific expiry date (in this case, June 27, 2025).
The strategy helps identify profitable opportunities when the futures price of BTC is higher than the spot price. Traders can then buy BTC in the spot market and short BTC futures contracts to lock in a risk-free profit.
1. Input Settings
Spot Symbol: The real-time BTC spot price from Binance (BTCUSDT).
Futures Symbol: The BTC futures contract that expires in June 2025 (BTCUSDM2025).
Expiry Date: The expiration date of the futures contract, set to June 27, 2025.
These inputs allow users to adjust the symbols or expiry date according to their trading needs.
2. Price Data Retrieval
Spot Price: Fetches the latest closing price of BTC from the spot market.
Futures Price: Fetches the latest closing price of BTC futures.
Spread: The difference between the futures price and the spot price (futures_price - spot_price).
The spread indicates how much higher (or lower) the futures price is compared to the spot market.
3. Time to Maturity (TTM) and Annual Percentage Yield (APY) Calculation
Current Date: Gets the current timestamp.
Time to Maturity (TTM): The number of days left until the futures contract expires.
APY Calculation:
Formula:
APY = ( Spread / Spot Price ) x ( 365 / TTM Days ) x 100
This represents the annualized return from holding a cash-and-carry arbitrage position if the trader buys BTC at the spot price and sells BTC futures.
4. Display Information Table on the Chart
A table is created on the chart's top-right corner showing the following data:
Metric: Labels such as Spread and APY
Value: Displays the calculated spread and APY
The table automatically updates at the latest bar to display the most recent data.
5. Alert Condition
This sets an alert condition that triggers every time the script runs.
In practice, users can modify this alert to trigger based on specific conditions (e.g., APY exceeds a threshold).
6. Plotting the APY and Spread
APY Plot: Displays the annualized yield as a blue line on the chart.
Spread Plot: Visualizes the futures-spot spread as a red line.
This helps traders quickly identify arbitrage opportunities when the spread or APY reaches desirable levels.
How to Use the Script
Monitor Arbitrage Opportunities:
A positive spread indicates a potential cash-and-carry arbitrage opportunity.
The larger the APY, the more profitable the arbitrage opportunity could be.
Timing Trades:
Execute a buy on the BTC spot market and simultaneously sell BTC futures when the APY is attractive.
Close both positions upon futures contract expiry to realize profits.
Risk Management:
Ensure you have sufficient margin to hold both positions until expiry.
Monitor funding rates and volatility, which could affect returns.
Conclusion
This script is an essential tool for traders looking to exploit price discrepancies between the BTC spot market and futures market through a cash-and-carry arbitrage strategy. It provides real-time data on spreads, annualized returns (APY), and visual alerts, helping traders make informed decisions and maximize their profit potential.

Ultimate Volatility Scanner by NHBprod - Requested by Client!Hey Everyone!
I created another script to add to my growing library of strategies and indicators that I use for automated crypto and stock trading! This strategy is for BITCOIN but can be used on any stock or crypto. This was requested by a client so I thought I should create it and hopefully build off of it and build variants!
This script gets and compares the 14-day volatility using the ATR percentage for a list of cryptocurrencies and stocks. Cryptocurrencies are preloaded into the script, and the script will show you the TOP 5 coins in terms of volatility, and then compares it to the Bitcoin volatility as a reference. It updates these values once per day using daily timeframe data from TradingView. The coins are then sorted in descending order by their volatility.
If you don't want to use the preloaded set of coins, you have the option of inputting your own coins AND/OR stocks!
Let me know your thoughts.

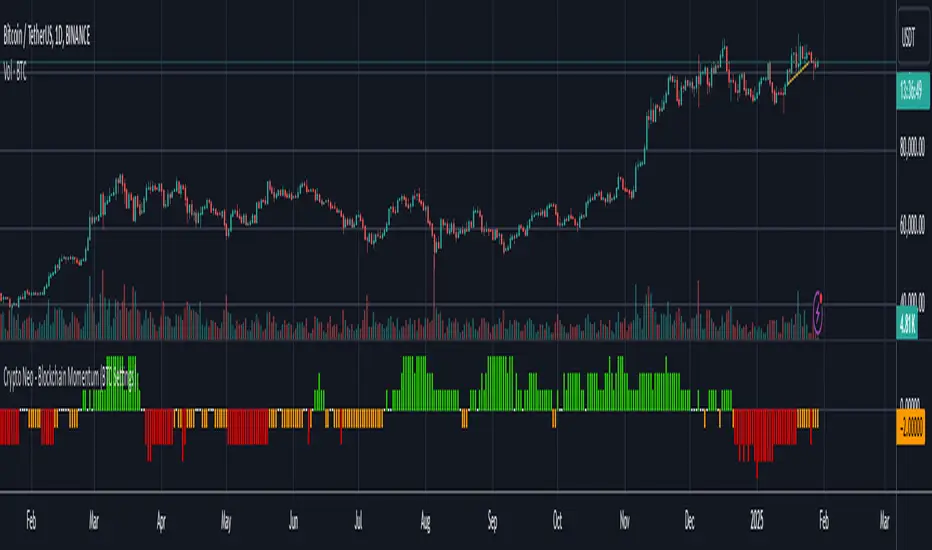
Crypto Neo - Blockchain Momentum (BTC Settings)The Crypto Neo - Blockchain Momentum indicator analyzes Bitcoin’s on-chain activity to gauge bullish or bearish trends. It combines multiple on-chain metrics and applies different moving average strategies to assess Bitcoin’s momentum.
This indicator is designed to track key blockchain data sources, such as:
Hash Rate
Active Addresses
Transactions per Second
New Addresses
Trader Behavior
Long-Term Holders (Cruisers)
Money Flow In/Out
Large Transactions Count
It processes these inputs using various Moving Average (MA) types, including SMA, EMA, DMA, to generate a Bullish Momentum Score, which is visually displayed on the chart.
How to Use:
Select MA Type – Choose between SMA, EMA, MIXMA, or DMA to determine how moving averages are applied.
Set MA Lengths – Adjust MA1 Length and MA2 Length to define short-term vs. long-term trend comparison.
Customize Data Sources – Select different on-chain metrics for the indicator to analyze.
Interpret the Bullish Momentum Score:
🟢 Green (Strong Bullish Momentum) – Bullish on-chain signals dominate.
🟡 Yellow (Moderate Bullish Momentum) – Weak bullish trend forming.
⚪ White (Neutral) – No clear trend.
🟠 Orange (Moderate Bearish Momentum) – Weak bearish signals emerging.
🔴 Red (Strong Bearish Momentum) – Bearish on-chain signals dominate.
Important Notes
This indicator does not generate trading signals but helps interpret blockchain trends for informed decision-making.
Since it relies on daily on-chain data, it is best used on the 1D timeframe for accurate readings.
Real-time calculations may vary slightly due to different bar update behaviors.
This indicator is very useful to confirm market turns early. Here are a few an example setups:
1. Back in 2019 on chain metrics started trending up after the market had dumped signaling a very good opportunity to buy.
2. During the 2021 bull market. When the market was forming a top, the on chain metrics started trending down indicating a risk to the downside.
Log Regression OscillatorThe Log Regression Oscillator transforms the logarithmic regression curves into an easy-to-interpret oscillator that displays potential cycle tops/bottoms.
🔶 USAGE
Calculating the logarithmic regression of long-term swings can help show future tops/bottoms. The relationship between previous swing points is calculated and projected further. The calculated levels are directly associated with swing points, which means every swing point will change the calculation. Importantly, all levels will be updated through all bars when a new swing is detected.
The "Log Regression Oscillator" transforms the calculated levels, where the top level is regarded as 100 and the bottom level as 0. The price values are displayed in between and calculated as a ratio between the top and bottom, resulting in a clear view of where the price is situated.
The main picture contains the Logarithmic Regression Alternative on the chart to compare with this published script.
Included are the levels 30 and 70. In the example of Bitcoin, previous cycles showed a similar pattern: the bullish parabolic was halfway when the oscillator passed the 30-level, and the top was very near when passing the 70-level.
🔹 Proactive
A "Proactive" option is included, which ensures immediate calculations of tentative unconfirmed swings.
Instead of waiting 300 bars for confirmation, the "Proactive" mode will display a gray-white dot (not confirmed swing) and add the unconfirmed Swing value to the calculation.
The above example shows that the "Calculated Values" of the potential future top and bottom are adjusted, including the provisional swing.
When the swing is confirmed, the calculations are again adjusted, showing a red dot (confirmed top swing) or a green dot (confirmed bottom swing).
🔹 Dashboard
When less than two swings are available (top/bottom), this will be shown in the dashboard.
The user can lower the "Threshold" value or switch to a lower timeframe.
🔹 Notes
Logarithmic regression is typically used to model situations where growth or decay accelerates rapidly at first and then slows over time, meaning some symbols/tickers will fit better than others.
Since the logarithmic regression depends on swing values, each new value will change the calculation. A well-fitted model could not fit anymore in the future.
Users have to check the validity of swings; for example, if the direction of swings is downwards, then the dataset is not fitted for logarithmic regression.
In the example above, the "Threshold" is lowered. However, the calculated levels are unreliable due to the swings, which do not fit the model well.
Here, the combination of downward bottom swings and price accelerates slower at first and faster recently, resulting in a non-fit for the logarithmic regression model.
Note the price value (white line) is bound to a limit of 150 (upwards) and -150 (down)
In short, logarithmic regression is best used when there are enough tops/bottoms, and all tops are around 100, and all bottoms around 0.
Also, note that this indicator has been developed for a daily (or higher) timeframe chart.
🔶 DETAILS
In mathematics, the dot product or scalar product is an algebraic operation that takes two equal-length sequences of numbers (arrays) and returns a single number, the sum of the products of the corresponding entries of the two sequences of numbers.
The usual way is to loop through both arrays and sum the products.
In this case, the two arrays are transformed into a matrix, wherein in one matrix, a single column is filled with the first array values, and in the second matrix, a single row is filled with the second array values.
After this, the function matrix.mult() returns a new matrix resulting from the product between the matrices m1 and m2.
Then, the matrix.eigenvalues() function transforms this matrix into an array, where the array.sum() function finally returns the sum of the array's elements, which is the dot product.
dot(x, y)=>
if x.size() > 1 and y.size() > 1
m1 = matrix.new()
m2 = matrix.new()
m1.add_col(m1.columns(), y)
m2.add_row(m2.rows (), x)
m1.mult (m2)
.eigenvalues()
.sum()
🔶 SETTINGS
Threshold: Period used for the swing detection, with higher values returning longer-term Swing Levels.
Proactive: Tentative Swings are included with this setting enabled.
Style: Color Settings
Dashboard: Toggle, "Location" and "Text Size"

Murad Picks Target MCThe Murad Picks Target Market Cap Indicator is a custom TradingView tool designed for crypto traders and enthusiasts tracking tokens in the Murad Picks list. This indicator dynamically calculates and visualizes the price targets based on Murad Mahmudov's projected market capitalizations, allowing you to gauge each token's growth potential directly on your charts.
Indicator support tokens:
- SPX6900
- GIGA
- MOG
- POPCAT
- APU
- BITCOIN
- RETARDIO
- LOCKIN
Key Features :
Dynamic Target Price Lines:
- Displays horizontal lines representing the price when the token reaches its projected market cap.
- Automatically adjusts for the active chart symbol (e.g., SPX, MOG, APU, etc.).
X Multiplier Calculation:
- Shows how many times the current price must multiply to achieve the target price.
- Perfect for understanding relative growth potential.
Customizable Inputs:
- Easily update target market caps and circulating supply for each token.
- Adjust visuals such as line colors and styles.
Seamless Integration:
- Automatically adapts to the token you’re viewing (e.g., SPX, MOG, APU).
- Clean and visually intuitive, with labels marking targets.

Logarithmic Regression AlternativeLogarithmic regression is typically used to model situations where growth or decay accelerates rapidly at first and then slows over time. Bitcoin is a good example.
𝑦 = 𝑎 + 𝑏 * ln(𝑥)
With this logarithmic regression (log reg) formula 𝑦 (price) is calculated with constants 𝑎 and 𝑏, where 𝑥 is the bar_index .
Instead of using the sum of log x/y values, together with the dot product of log x/y and the sum of the square of log x-values, to calculate a and b, I wanted to see if it was possible to calculate a and b differently.
In this script, the log reg is calculated with several different assumed a & b values, after which the log reg level is compared to each Swing. The log reg, where all swings on average are closest to the level, produces the final 𝑎 & 𝑏 values used to display the levels.
🔶 USAGE
The script shows the calculated logarithmic regression value from historical swings, provided there are enough swings, the price pattern fits the log reg model, and previous swings are close to the calculated Top/Bottom levels.
When the price approaches one of the calculated Top or Bottom levels, these levels could act as potential cycle Top or Bottom.
Since the logarithmic regression depends on swing values, each new value will change the calculation. A well-fitted model could not fit anymore in the future.
Swings are based on Weekly bars. A Top Swing, for example, with Swing setting 30, is the highest value in 60 weeks. Thirty bars at the left and right of the Swing will be lower than the Top Swing. This means that a confirmation is triggered 30 weeks after the Swing. The period will be automatically multiplied by 7 on the daily chart, where 30 becomes 210 bars.
Please note that the goal of this script is not to show swings rapidly; it is meant to show the potential next cycle's Top/Bottom levels.
🔹 Multiple Levels
The script includes the option to display 3 Top/Bottom levels, which uses different values for the swing calculations.
Top: 'high', 'maximum open/close' or 'close'
Bottom: 'low', 'minimum open/close' or 'close'
These levels can be adjusted up/down with a percentage.
Lastly, an "Average" is included for each set, which will only be visible when "AVG" is enabled, together with both Top and Bottom levels.
🔹 Notes
Users have to check the validity of swings; the above example only uses 1 Top Swing for its calculations, making the Top level unreliable.
Here, 1 of the Bottom Swings is pretty far from the bottom level, changing the swing settings can give a more reliable bottom level where all swings are close to that level.
Note the display was set at "Logarithmic", it can just as well be shown as "Regular"
In the example below, the price evolution does not fit the logarithmic regression model, where growth should accelerate rapidly at first and then slows over time.
Please note that this script can only be used on a daily timeframe or higher; using it at a lower timeframe will show a warning. Also, it doesn't work with bar-replay.
🔶 DETAILS
The code gathers data from historical swings. At the last bar, all swings are calculated with different a and b values. The a and b values which results in the smallest difference between all swings and Top/Bottom levels become the final a and b values.
The ranges of a and b are between -20.000 to +20.000, which means a and b will have the values -20.000, -19.999, -19.998, -19.997, -19.996, ... -> +20.000.
As you can imagine, the number of calculations is enormous. Therefore, the calculation is split into parts, first very roughly and then very fine.
The first calculations are done between -20 and +20 (-20, -19, -18, ...), resulting in, for example, 4.
The next set of calculations is performed only around the previous result, in this case between 3 (4-1) and 5 (4+1), resulting in, for example, 3.9. The next set goes even more in detail, for example, between 3.8 (3.9-0.1) and 4.0 (3.9 + 0.1), and so on.
1) -20 -> +20 , then loop with step 1 (result (example): 4 )
2) 4 - 1 -> 4 +1 , then loop with step 0.1 (result (example): 3.9 )
3) 3.9 - 0.1 -> 3.9 +0.1 , then loop with step 0.01 (result (example): 3.93 )
4) 3.93 - 0.01 -> 3.93 +0.01, then loop with step 0.001 (result (example): 3.928)
This ensures complicated calculations with less effort.
These calculations are done at the last bar, where the levels are displayed, which means you can see different results when a new swing is found.
Also, note that this indicator has been developed for a daily (or higher) timeframe chart.
🔶 SETTINGS
Three sets
High/Low
• color setting
• Swing Length settings for 'High' & 'Low'
• % adjustment for 'High' & 'Low'
• AVG: shows average (when both 'High' and 'Low' are enabled)
Max/Min (maximum open/close, minimum open/close)
• color setting
• Swing Length settings for 'Max' & 'Min'
• % adjustment for 'Max' & 'Min'
• AVG: shows average (when both 'Max' and 'Min' are enabled)
Close H/Close L (close Top/Bottom level)
• color setting
• Swing Length settings for 'Close H' & 'Close L'
• % adjustment for 'Close H' & 'Close L'
• AVG: shows average (when both 'Close H' and 'Close L' are enabled)
Show Dashboard, including Top/Bottom levels of the desired source and calculated a and b values.
Show Swings + Dot size

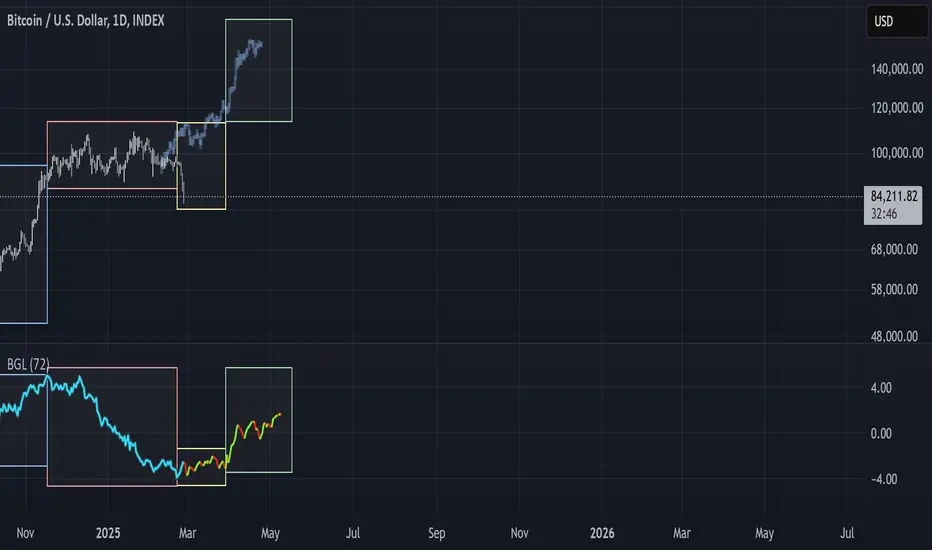
BGL - Bitcoin Global Liquidity Indicator [Da_Prof]This indicator takes global liquidity and shifts it forward by a set number of days. It can be used for any asset, but it is by default set for Bitcoin (BTC). The shift forward allows potential future prediction of BTC trends, especially uptrends. While not perfect, the current shift of 72 days seems to be best for the current cycle.
Sixteen currencies are used to calculate global liquidity.