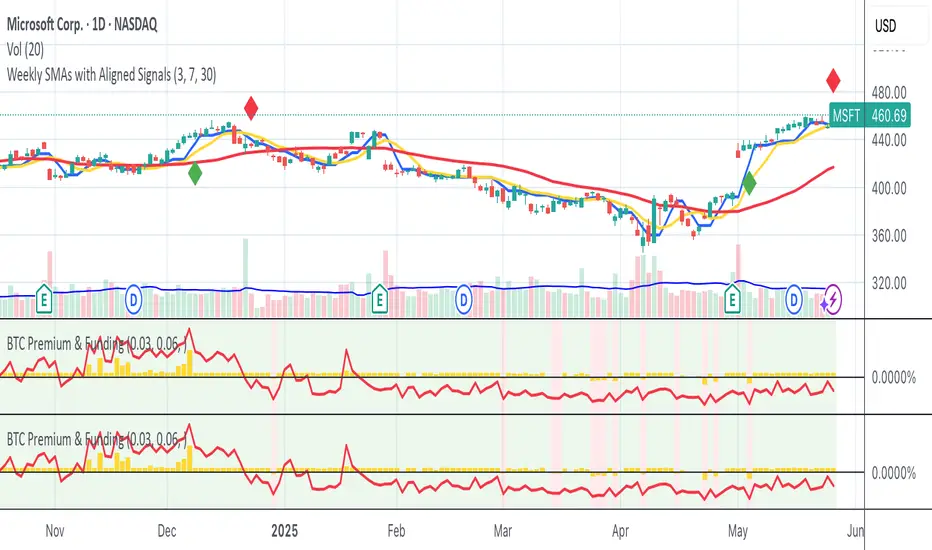
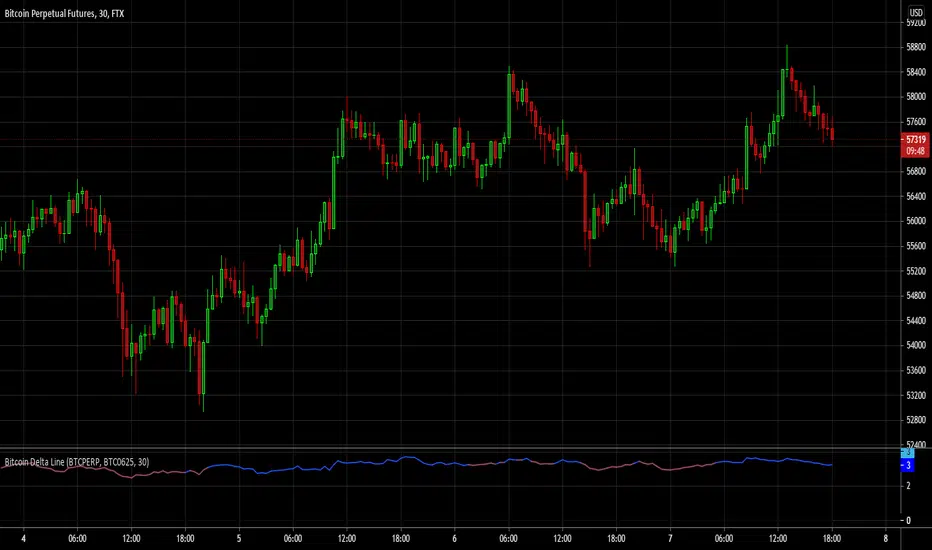
Bitmex BTC Perpetual Premium and FundingThis script tracks the premium (default red line) and the funding rate (default yellow area) of the Bitmex XBTUSD pair perpetual contract.
The calculations are based on the 8H TWAP of interest rates and premium index from Bitmex.
Tìm kiếm tập lệnh với "bitcoin"
Bitcoin Bull Runs Mid Cycle Aligned This script plots 2 lines which are the 2013 and 2016 bull run. The plots are aligned on their mid cycles to the 2021 mid cycle.
Settings:
You can move the plots on the x and y axis in the settings for the Daily, Weekly and Monthly TFs.
The plot is weird on the Monthly TF, best to use the Daily and Weekly.
If it doesn't load at first you have to zoom out fully and go back to 2013 for it to load. Then it will load.

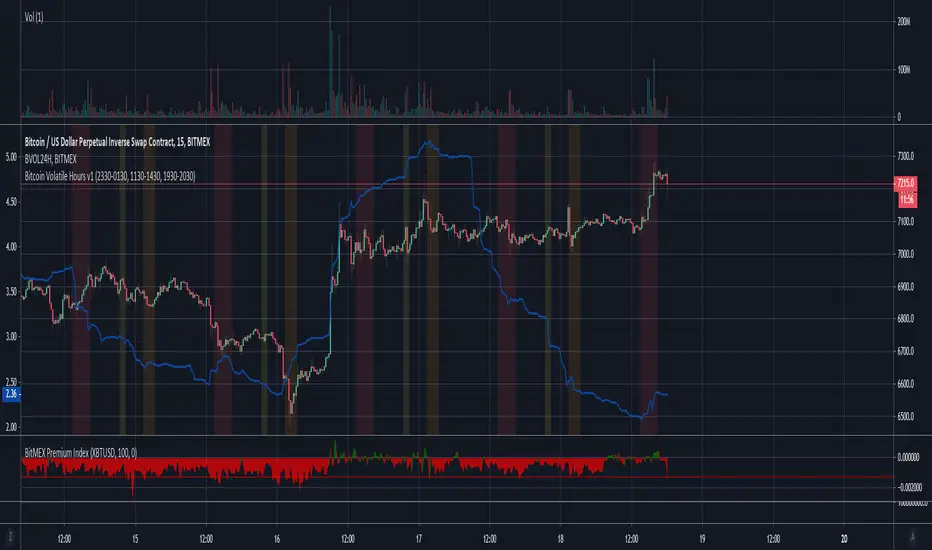
Bitcoin Volatile Hours v1This indicator shows the typical hours in which BTC is volatile hence expected to move, 3 time zones which are UTC
Bitcoin Adjusted 3 Points DiagonalsIt draws Diagonals Support and Resistance on the chart using Pivot points
The values adjust automatically and are optimized for crypto pairs

Bitcoin Adjusted 3 point horizontalsIt draws horizontal support Resistance lines based on pivot points
The values are optimized for crypto currency pairs


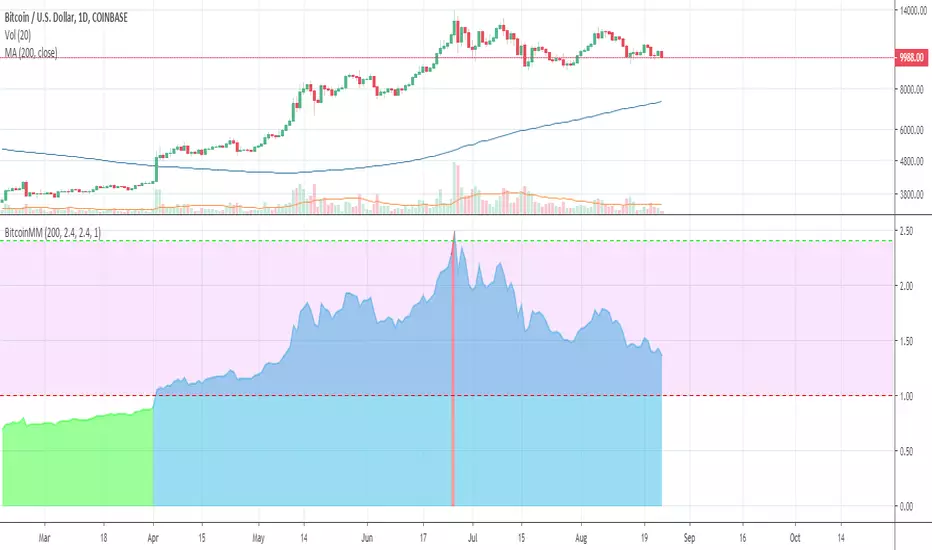
Bitcoin Mayer MultipleSimple mayer mutiple based on Bitstamp BTCUSD.
Use this in a DAILY chart
Will show green when < 1.0: it means cheaper than 200-day moving average,
red when above 2.4: this is considered bubble bursting territory.
If you like it feel free to tip bc1q4vxf6dycmrswqdj03rxd26gpnyu8hmuwnjjt7h


Icould 1stepToWin (Kazanmak o kadar da zor değil)Bitcoin'in 15 dakikalık işlemlerinde min. 40$ karla pozisyon kapatmanıza imkan veren bir indikatör. Sinyal gelir gelmez pozisyon alın sonucu görün.Hayırlı olsun.


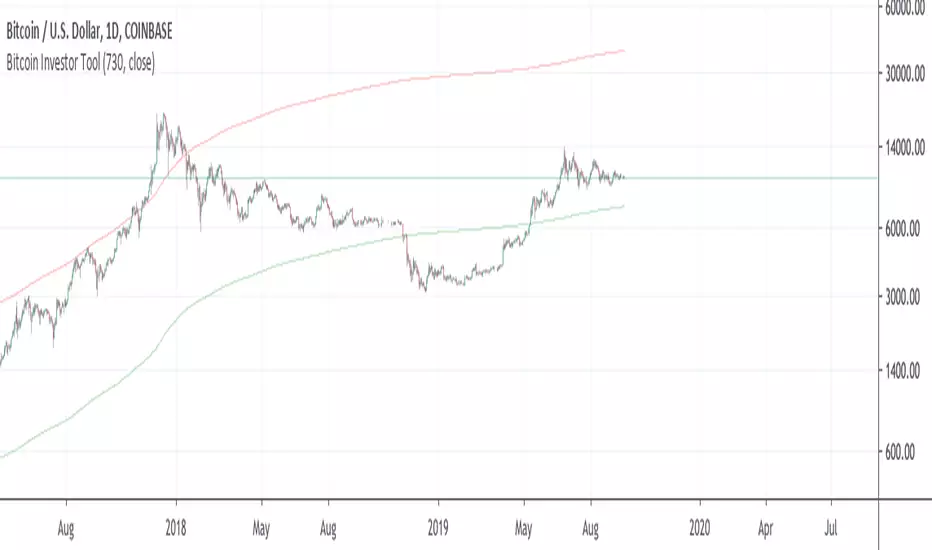
Bitcoin Stock to Flow Multiplethis study plots the price of btc over the Stock to Flow Model value
idea credited to: 100trillionUSD
my data is a bit off compared to the original source but overall it seems correct

Bitcoin HMA Daily - SignalsThis is a simple strategy based on the HMA for BTC with good results. Make sure to set your alerts to "On candle close" to avoid false positives.
Script contains an alert for a Long and Short signal.

Bitcoin Jack Trend Strength Divergence IndicatorHelps spotting divergences in trends. Blue arrows are divergences.

Bitcoin Jack Candlestick LabInstructions:
Indicator spotting trend divergences with certain PA theories.
Signals to long or short an asset.
SL around clear prior S/R zone.
Target around clear next S/R zone, possibly with a trailing stop.
Some false positives are generated from trend divergences, use this in combination with your preferred TA tools.

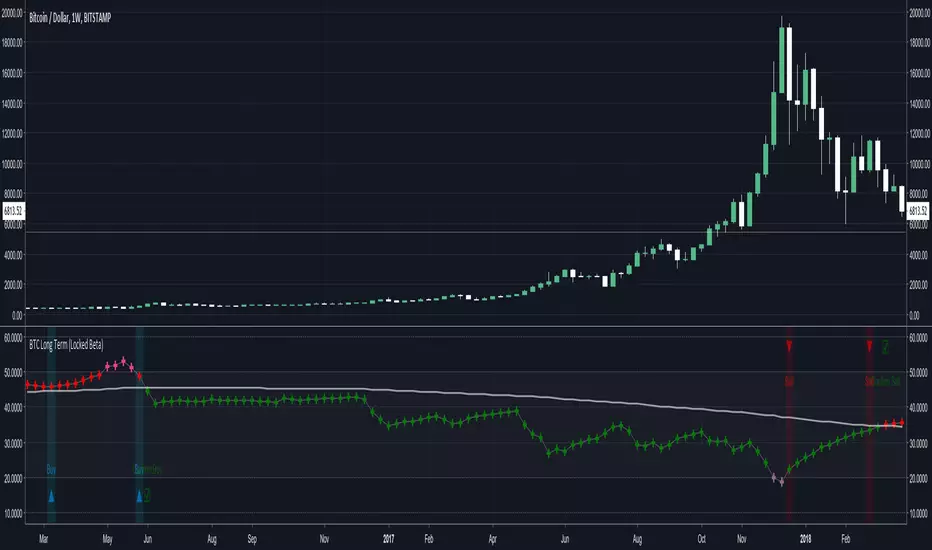
Bitcoin Long Term Trend Signals BetaBeta of a new indicator idea, tuned and locked to weekly btc -2.24% for long term. Access request required
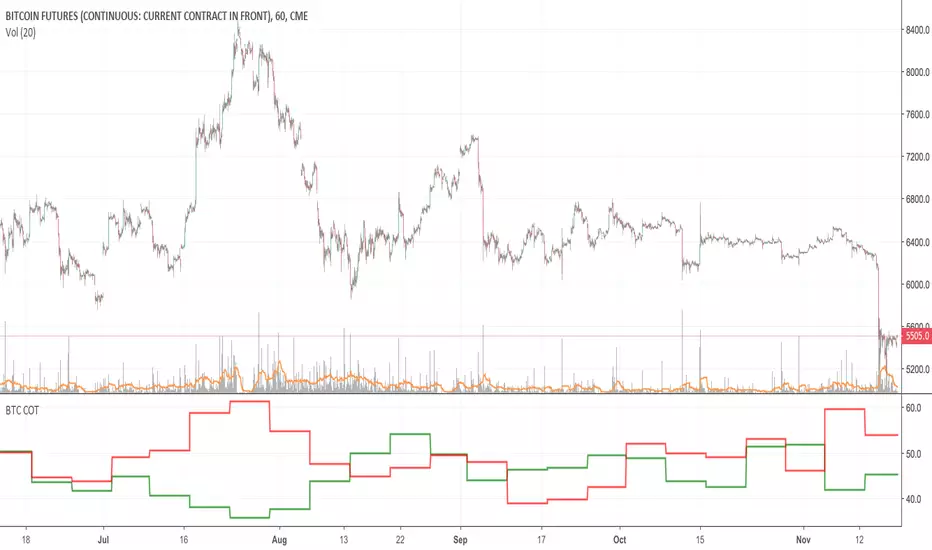
Bitcoin COT (CME)Commitment of Traders report from the CME.
HOW TO INTERPRET:
// 1. Trade in the same direction of institutional money.
// 2. Trade in the opposite direction of retail money.
// 3. Trade in the direction of professional money.
// 4. When %open interest held by largest 4 longs > %open interest held by largest 4 shorts = look to buy
// 5. When %open interest held by largest 4 shorts > %open interest held by largest 4 longs = look to sell