FractalMod for TV with breakout alertsFractalsMod (MT4 → Pine) is a TradingView indicator converted from a custom MT4 (MQL4) fractal indicator.
This script replicates the behavior of the original MT4 version as closely as possible, including:
Confirmation-based fractals using left/right bar logic
Persistent horizontal levels derived from confirmed fractals
MT4-style “buffer-like” behavior using segmented horizontal lines
Key Features
MT4-compatible fractal logic
Uses leftbars and rightbars to confirm fractal highs/lows, equivalent to MT4 custom fractal indicators.
Segmented horizontal lines (MT4 buffer style)
Each confirmed fractal starts a new horizontal line segment from the original pivot bar.
When a new fractal is confirmed, the previous segment is stopped at the new pivot point, closely mimicking MT4 indicator buffers.
Latest fractal tracking
The most recently confirmed Up/Down fractal levels are tracked internally and used for breakout detection.
Breakout alerts (not confirmation alerts)
Alerts are triggered when the current price breaks above the latest Up fractal or below the latest Down fractal.
Breakout detection can be configured to use:
Close price only (confirmation-based), or
High/Low including wicks.
Clean visual control
Single arrow per confirmed fractal (no duplicate markers)
Optional display of fractal markers and horizontal lines
Custom colors and line width for Up/Down fractals
Typical Use Cases
Fractal-based support / resistance visualization
Breakout trading using the most recent confirmed fractal levels
MT4 → TradingView workflow migration while preserving indicator behavior
This script is designed for traders familiar with MT4 fractal indicators who want a faithful and practical TradingView equivalent without repainting on confirmed signals.
FractalsMod (MT4 → Pine) は、
MT4(MQL4)で使用されていた カスタム Fractal インジケーターを TradingView(Pine Script)へ移植したものです。
元の MT4 インジケーターの挙動を可能な限り忠実に再現することを目的としており、以下の特徴を持ちます。
主な特徴
MT4互換のフラクタル判定ロジック
leftbars / rightbars を用いたフラクタル確定方式で、
MT4 のカスタム Fractal インジケーターと同等の確定条件を再現しています。
MT4のバッファ挙動を再現した水平ライン
フラクタルが確定すると、その ピボット位置から水平ラインを開始します。
新しいフラクタルが確定した場合、それまでのラインは新しいピボット位置で停止し、
区間ごとのライン構造で MT4 のバッファ表示に近い見た目を実現しています。
最新フラクタル価格の内部保持
直近で確定した Up / Down フラクタル価格を保持し、
ブレイク判定やアラートに利用します。
ブレイク専用アラート(確定時アラートなし)
フラクタル確定時ではなく、
価格が最新の Up フラクタルを上抜けたとき
価格が最新の Down フラクタルを下抜けたとき
にアラートを出す設計です。
ブレイク判定は
終値ベース(ダマシを減らす)
ヒゲ込み(高値 / 安値)
を設定で切り替えられます。
視認性と制御性を重視した設計
フラクタル矢印は 確定時に1本のみ表示(重複なし)
Up / Down で色分けされたラインと矢印
ライン表示・矢印表示の ON / OFF 切り替え可能
想定される用途
フラクタルを用いた サポート / レジスタンスの可視化
直近フラクタルを基準とした ブレイクアウト戦略
MT4 から TradingView への移行時に、
ロジックと見た目をできるだけ変えずに使いたい場合
本スクリプトは、
MT4のフラクタル系インジケーターに慣れたトレーダーが、
TradingViewでも違和感なく使えることを重視して設計されています。
Tìm kiếm tập lệnh với "breakout"

Momentum & Breakout Confirmationwatch momentum build in real time on the current candle so you can confirm weather a breakout is indeed a breakout or will be a fake out. This is what it does
This is a Momentum & Breakout Confirmation (MBC) indicator that analyzes the current candle in real-time to determine if it's a strong continuation move or possible reversal. Here's the breakdown:
What It Measures:
Momentum Strength - How much % the candle moved:
STRONG = >0.5% move
MEDIUM = 0.2-0.5%
WEAK = <0.2%
Direction - Simply bullish (green candle) or bearish (red candle)
Four Confirmation Factors:
Volume Surge - Is volume 1.5x above the 20-period average?
Move Size - Is the candle body larger than 0.5x ATR (significant)?
Body Strength - Is the body >60% of total candle range (strong conviction, minimal wicks)?
Trend Aligned - Does it align with 9/21 MA trend direction?
The Scoring System:
Adds 1 point for each confirmation factor met (max 4 points)
3-4 points = "STRONG CONTINUATION" 🚀
2 points = "LIKELY CONTINUATION"
1 point = "WEAK SIGNAL"
0 points = "POSSIBLE REVERSAL" ⚠️
Key Difference from TPC:
TPC uses multi-timeframe SuperTrend for strategic entries
MBC focuses on the current candle only - it's asking "Is THIS candle showing real momentum or is it weak/fake?"
Practical Use:
Great for confirming if a breakout or move is "real" with strong conviction behind it, or if it's low-volume/weak-bodied and likely to fail. The table updates live so you can watch momentum build during the candle formation.
Hope it helps. if you guys have any ideas for any indicators you want made please feel free to dm me as i like a good challenge lol ill sit here and try to code anything now im not saying i will be 100 percent successful but i will try for you, thanks for all the support from all you guys i def do appreciate it.

True vs False Breakout (Vol + Body Shape) **Indicator Description: True vs. False Breakout Detector**
This indicator helps identify the quality of a breakout by analyzing price action and volume.
**★ Green Arrow: "True Breakout (Strong Candle)"**
This represents a high-confidence breakout signal.
* **Criteria:** Price Breakout + Volume Surge + Strong Candle Close (minimal to no upper wick).
* **Significance:** Indicates strong bullish momentum.
**● Grey Dot: "Weak Breakout"**
Appears when price breaks resistance but shows signs of weakness.
* **Criteria:** Breakout with low volume OR a long upper wick (rejection).
* **Meaning:** "Price made a new high, but the move is untrustworthy."
* **Action:** Do not chase the long position. Be cautious and look for potential reversals.
**▼ Red Label: "False Breakout (Reversal)"**
* **Signal:** Appears when a Weak Breakout (Grey Dot) is followed by bearish price action.
* **Action:** This indicates a confirmed False Breakout and presents a prime shorting opportunity.
-------------------------------------------------------------------------------------------
★指标描述:真假突破辨别。
★绿色箭头 "真突破 (强K线)":
这是你要的完美信号。
它意味着:价格破位 + 成交量放大 + K线收盘坚决(几乎没有上影线)。
对应刚才的行情: 刚才那根1H大阳线应该会触发这个信号。
灰色圆点 "弱势突破" (新增):
如果价格突破了阻力,但是没量,或者留了长上影线(像你之前描述的那几根15分钟线),指标会标记灰色圆点。
含义: “虽然价格破了新高,但我不信任它”。这时候千万不要追多,反而要准备做空。
红色标签 "假突破 (反转)":
当灰色圆点(弱势突破)出现后,紧接着出现红色标签,就是绝佳的做空点。

BB Breakout-Momentum + Reversion Strategies# BB Breakout-Momentum + Reversion Strategies
## Overview
This indicator combines two complementary Bollinger Band trading strategies that automatically adapt to market conditions. Strategy 1 capitalizes on trending markets with breakout-pullback-momentum setups, while Strategy 2 exploits mean reversion in ranging markets. Advanced filtering using ADX and BB Width ensures each strategy only fires in its optimal market environment.
---
## Strategy 1: Breakout → Pullback → Renewed Momentum (Long B / Short B)
### Best Market Conditions
- **Trending Markets**: ADX ≥ 25
- **High Volatility**: BB Width ≥ 1.0× average
- Directional price action with sustained momentum
### Entry Logic
**Long B (Bullish Breakout):**
1. **Initial Breakout**: Price breaks above upper Bollinger Band with strong momentum
2. **Controlled Pullback**: Price pulls back 1-12 bars but holds above lower band (stays in trend)
3. **Defended Zone**: Pullback creates a support zone based on swing lows (validated by multiple touches)
4. **Renewed Momentum**: Price reclaims with green candle, volume confirmation, bullish MACD
5. **Position Check**: Entry must have cushion below upper band and room to reach targets
**Short B (Bearish Breakdown):**
- Mirror logic for downtrends: breakdown below lower band, pullback stays below upper band, renewed selling pressure
### Risk Management
- **Stop Loss**: Lower of (zone floor/previous low) OR (1.5 × ATR from entry)
- **Targets**:
- T1: Entry + 0.85R (0.85 × 1.5 ATR)
- T2: Entry + 1.40R (1.40 × 1.5 ATR)
- T3: Entry + 2.50R (2.50 × 1.5 ATR)
- T4: Entry + 4.50R (4.50 × 1.5 ATR)
- Risk is calculated using ATR (ATRX = 1.5 ATR), stop uses tighter of structural level (ATRL) or ATRX
---
## Strategy 2: Bollinger Band Mean Reversion (Long R / Short R)
### Best Market Conditions
- **Ranging Markets**: ADX ≤ 20
- **Low Volatility**: BB Width ≤ 0.8× average
- Price oscillating around the mean without sustained trend
### Entry Logic
**Long R (Long Reversion):**
1. **Overextension**: Price breaks below lower Bollinger Band (2 consecutive closes)
2. **Snap Back**: Price crosses back above lower band (re-enters the range)
3. **Entry Window**: Within 2 candles of re-entry, look for:
- **Green candle** (close > open) confirming bullish strength
- Close above previous candle (close > close )
4. **Trigger**: First qualifying candle within 2-bar window executes the trade
**Short R (Short Reversion):**
1. **Overextension**: Price breaks above upper Bollinger Band (2 consecutive closes)
2. **Snap Back**: Price crosses back below upper band (re-enters the range)
3. **Entry Window**: Within 2 candles of re-entry, look for:
- **Red candle** (close < open) confirming bearish pressure
- Close below previous candle (close < close )
4. **Trigger**: First qualifying candle within 2-bar window executes the trade
### Risk Management
- **Stop Loss**: Lower of (previous high/low) OR (1.5 × ATR from entry)
- **Targets**: Same as Strategy 1 (0.85R, 1.4R, 2.5R, 4.5R based on 1.5 ATR)
- Betting on return to Bollinger Band basis (mean)
---
## Advanced Filtering System
### ADX Filter (Average Directional Index)
- **Purpose**: Measures trend strength vs choppy/ranging conditions
- **Trending**: ADX ≥ 25 → Enables Strategy 1 (Breakout)
- **Ranging**: ADX ≤ 20 → Enables Strategy 2 (Reversion)
- **Neutral**: ADX 20-25 → No signals (indecisive market)
### BB Width Filter
- **Purpose**: Confirms volatility expansion/contraction
- **Wide Bands**: Current width ≥ 1.0× 50-bar average → Trending environment
- **Narrow Bands**: Current width ≤ 0.8× 50-bar average → Ranging environment
- **Logic**: Both ADX and BB Width must agree on market state before signaling
### Combined Logic
- **Strategy 1 fires**: When BOTH ADX shows trending AND bands are wide
- **Strategy 2 fires**: When BOTH ADX shows ranging AND bands are narrow
- **Visual Display**: Table at bottom-right shows ADX value, BB Width ratio, and current market state
---
## Visual Elements
### Bollinger Bands
- **Gray line**: 20-period SMA (basis/mean)
- **Green line**: Upper band (basis + 2 standard deviations)
- **Red line**: Lower band (basis - 2 standard deviations)
### Strategy 1 Markers
- **Long B**: Green triangle below bar with "Long B" text
- **Short B**: Orange triangle above bar with "Short B" text
- **Defended Zones**: Green/red boxes showing pullback support/resistance areas
- **Targets**: Green/orange crosses showing T1-T4 and stop loss levels
### Strategy 2 Markers
- **Long R**: Blue label below bar with "Long R" text
- **Short R**: Purple label above bar with "Short R" text
- **Trade Levels**: Horizontal lines extending 50 bars forward
- Blue solid = Entry price
- Red dashed = Stop loss
- Green/Orange dotted = Targets (T1-T4)
### Market State Table
- **ADX**: Current value with color coding (green=trending, orange=ranging, gray=neutral)
- **BB Width**: Ratio vs 50-bar average (e.g., "1.15x" = 15% wider than average)
- **State**: TREND / RANGE / NEUTRAL classification
---
## Settings & Customization
### Bollinger Bands
- **BB Length**: 20 (default) - period for moving average
- **BB Std Dev**: 2.0 (default) - standard deviation multiplier
### ATR & Risk
- **ATR Length**: 14 (default) - period for Average True Range calculation
- All stop losses and targets are derived from 1.5 × ATR
### Trend/Range Filters
- **ADX Length**: 14 (default)
- **ADX Trending Threshold**: 25 (higher = stronger trend required)
- **ADX Ranging Threshold**: 20 (lower = tighter ranging condition)
- **BB Width Average Length**: 50 (period for comparing current width)
- **BB Width Trend Multiplier**: 1.0 (width must be ≥ this × average)
- **BB Width Range Multiplier**: 0.8 (width must be ≤ this × average)
- **Use ADX Filter**: Toggle on/off
- **Use BB Width Filter**: Toggle on/off
### Strategy 1 (Breakout-Momentum)
- **Breakout Lookback**: 15 bars (how far back to search for initial breakout)
- **Min Pullback Bars**: 1 (minimum consolidation period)
- **Max Pullback Bars**: 12 (maximum consolidation period)
- **Show Defended Zone**: Display support/resistance boxes
- **Show Signals**: Display Long B / Short B markers
- **Show Targets**: Display stop loss and target levels
### Strategy 2 (Reversion)
- **Show Signals**: Display Long R / Short R markers
- **Show Trade Levels**: Display entry, stop, and target lines
---
## How to Use This Indicator
### Step 1: Identify Market State
- Check the table in bottom-right corner
- **TREND**: Look for Strategy 1 signals (Long B / Short B)
- **RANGE**: Look for Strategy 2 signals (Long R / Short R)
- **NEUTRAL**: Wait for clearer conditions
### Step 2: Wait for Signal
- Signals only fire when ALL conditions are met (structural + momentum + filters + room-to-target)
- Signals are relatively rare but high-probability
### Step 3: Execute Trade
- **Entry**: Close of signal candle
- **Stop Loss**: Shown as red cross (Strategy 1) or red dashed line (Strategy 2)
- **Targets**: Scale out at T1, T2, T3, T4 or hold for maximum R:R
### Step 4: Management
- Consider moving stop to breakeven after T1
- Trail stop using swing lows/highs in Strategy 1
- Exit full position at T2-T3 in Strategy 2 (mean reversion has limited upside)
---
## Key Principles
### Why This Works
1. **Market Adaptation**: Uses right strategy for right conditions (trend vs range)
2. **Confluence**: Multiple confirmations required (structure + momentum + volatility + room)
3. **Risk-Defined**: Every trade has pre-calculated stop and targets based on ATR
4. **Probability**: Filters reduce noise and increase win rate by waiting for ideal setups
### Common Pitfalls to Avoid
- ❌ Taking signals in NEUTRAL market state (indicators disagree)
- ❌ Overriding the stop loss (it's calculated for a reason)
- ❌ Expecting signals on every swing (quality over quantity)
- ❌ Using Strategy 1 in ranging markets or Strategy 2 in trending markets
- ❌ Ignoring the room-to-target check (signal won't fire if targets are blocked)
### Complementary Analysis
This indicator works best when combined with:
- Higher timeframe trend analysis
- Key support/resistance levels
- Volume analysis
- Market structure (swing highs/lows)
- Risk management rules (position sizing, max daily loss, etc.)
---
## Technical Details
### Indicators Used
- **Bollinger Bands**: 20-period SMA ± 2 standard deviations
- **ATR**: 14-period Average True Range for volatility measurement
- **ADX**: 14-period Average Directional Index for trend strength
- **EMA**: 10 and 20-period exponential moving averages (Strategy 1 filter)
- **MACD**: 12/26/9 settings (Strategy 1 momentum confirmation)
- **Volume**: Compared to 15-bar average (Strategy 1 confirmation)
### Calculation Methodology
- **ATRL** (Structural Risk): Previous swing high/low or defended zone boundary
- **ATRX** (ATR Risk): 1.5 × 14-period ATR from entry price
- **Stop Loss**: Minimum of ATRL and ATRX (tightest protection)
- **Targets**: Always calculated from ATRX (consistent R-multiples)
- **BB Width Ratio**: Current BB width ÷ 50-period SMA of BB width
---
## Performance Notes
### Strengths
- Adapts to changing market conditions automatically
- Clear, objective entry and exit criteria
- Pre-defined risk on every trade
- Filters reduce false signals significantly
- Works across multiple timeframes and instruments
### Limitations
- Signals are infrequent (by design - quality over quantity)
- Requires patience to wait for all conditions to align
- May miss explosive moves if pullback doesn't form properly (Strategy 1)
- Ranging markets can transition to trending (Strategy 2 risk)
- Filters may delay entry in fast-moving markets
### Best Timeframes
- **Strategy 1**: 1H, 4H, Daily (needs time for proper pullback structure)
- **Strategy 2**: 15M, 30M, 1H (mean reversion works best intraday)
- Both strategies can work on any timeframe if market conditions are right
### Best Instruments
- **Liquid markets**: Major stocks, indices, forex pairs, liquid crypto
- **Sufficient volatility**: ATR should be meaningful relative to price
- **Clear trend/range cycles**: Markets that respect technical levels
---
## IMPORTANT DISCLAIMER
### Risk Warning
**TRADING INVOLVES SUBSTANTIAL RISK OF LOSS AND IS NOT SUITABLE FOR ALL INVESTORS.**
This indicator is provided for **educational and informational purposes only**. It does not constitute financial advice, investment advice, trading advice, or any other sort of advice. You should not treat any of the indicator's content as such.
### No Guarantee of Profit
Past performance is not indicative of future results. No trading strategy, including this indicator, can guarantee profits or protect against losses. The market is inherently unpredictable and all trading involves risk.
### User Responsibility
- **Do Your Own Research**: Always conduct your own analysis before making trading decisions
- **Test First**: Backtest and paper trade this strategy before risking real capital
- **Risk Management**: Never risk more than you can afford to lose
- **Position Sizing**: Use appropriate position sizes relative to your account
- **Stop Losses**: Always use stop losses and respect them
- **Market Conditions**: Understand that market conditions change and past behavior may not repeat
### No Liability
The creator of this indicator accepts no liability for any financial losses incurred through the use of this tool. All trading decisions are made at your own risk. You are solely responsible for evaluating the merits and risks associated with the use of any trading systems, signals, or content provided.
### Not Financial Advice
This indicator does not take into account your personal financial situation, investment objectives, risk tolerance, or specific needs. You should consult with a licensed financial advisor before making any investment decisions.
### Technical Limitations
- Indicators can repaint or lag in real-time
- Past signals may look different than real-time signals
- Code bugs or errors may exist despite testing
- TradingView platform limitations may affect functionality
### Market Risks
- Markets can gap, causing stops to be executed at worse prices
- Slippage and commissions can significantly impact results
- High volatility can cause unexpected losses
- Counterparty risk exists in all leveraged products
---
## Version History
- **v1.0**: Initial release combining breakout-momentum and mean reversion strategies
- Includes ADX and BB Width filtering
- ATRL/ATRX risk calculation system
- 2-candle entry window for reversion trades
---
## Credits & License
This indicator combines concepts from classical technical analysis including Bollinger Bands (John Bollinger), ATR (Welles Wilder), and ADX (Welles Wilder). The specific implementation and combination of filters is original work.
**Use at your own risk. Trade responsibly.**
---
*For questions, suggestions, or to report bugs, please comment below or contact the author.*
**Remember: The best indicator is the one between your ears. Use this tool as part of a comprehensive trading plan, not as a standalone solution.**

ADX Breakout Enhanced Signal🥋 Trading Dojo – ADX Breakout Enhanced Signal
This indicator combines the trend-strength power of the ADX with dynamic breakout-based signals, designed for traders who want more frequent and higher-probability entries on timeframes like 1 hour.
The core logic focuses on:
📌 1. Trend Strength Detection with ADX
The indicator evaluates whether the market is showing a strong directional trend using an optimized ADX.
When ADX rises above the configured threshold, the system interprets that price has enough momentum to validate an entry.
📌 2. Breakout Entry Logic
It identifies points where price breaks recent highs or lows, confirming the start or continuation of movement.
This breakout-based approach produces more entries than traditional ADX strategies alone.
📌 3. Clear and Simple Signals
🟩 Long when price breaks a recent high with strong trend confirmation.
🟥 Short when price breaks a recent low with strong trend confirmation.
📌 4. Built-In Automated Alerts
The indicator automatically generates JSON alerts ready for use with automation tools such as trading bots, webhooks, BingX, 3Commas, Discord bots, and more.
🎯 Purpose of the Indicator
To provide more frequent, well-distributed, and momentum-validated entries, while maintaining simplicity and speed — perfect for real-time decision-making.
Perfect For:
Intraday trading
1h, 30m, and 15m timeframes
Breakout-based strategies
Automated trading systems

Nifty Breakout Levels Strategy (v7 Hybrid)Nifty Breakout Levels Strategy (v7 Hybrid – Compounding from Start Date)
Instrument / TF: Designed for current-month NIFTY futures on 1-hour timeframe, with at most 1 trade per day.
Entry logic: Uses a 10-bar breakout box with a 0.3% buffer, plus EMA-based trend + proximity filter.
Longs: price in breakout-high zone, above EMA50/EMA200 and within proximityPts.
Shorts: price in breakout-low zone and strong downtrend (EMA10 < EMA20 < EMA50 < EMA200, price below EMA200).
Trades only when ATR(14) > atrTradeThresh and during regular hours (till 15:15).
Risk / exits: Stop loss is ATR-adaptive – max of slBasePoints (100 pts) and ATR * atrSLFactor; TP is fixed (tpPoints, e.g. 350 pts).
Longs have stepped trailing profit levels (100/150/200/250/320 pts) that lock in gains on pullbacks.
Shorts have trailing loss-reduction levels (80/120/140 pts) to cut improving losses.
Additional exit: 1H EMA50 2-bar reversal against the position, plus optional EOD flatten at 3:15 PM.
Compounding engine: From a chosen start date, equity is rebased to startCapital, and lot size scales dynamically as equity / capitalPerLot, with automatic lot reductions at three drawdown thresholds (ddCut1 / 2 / 3).
Automation: All entries and exits are exposed via alertconditions (long/short entry & exit) so the strategy can be connected to broker/webhook automation.

Swing Traces [BigBeluga]🔵 OVERVIEW
The Swing Traces indicator identifies significant swing points in the market and extends them forward as fading traces. These traces represent the memory of recent highs and lows, showing how price interacts with past turning points over time. Traders can use the fading intensity and breakout signals to gauge when a swing has lost influence or when price reacts to it again.
🔵 CONCEPTS
Swing Detection – Detects recent upper and lower swing points using sensitivity-based highs and lows.
Trace Longevity – Each swing projects a “trace” forward in time, gradually fading with age until it expires.
Trace Size – Each trace is drawn with both a main level and a size extension (half of the bar range) to highlight swing influence.
Longevity Counters – Swings remain active for a customizable number of bars before fading out or being crossed by price.
Swing Retest – Labels appear when price retest above/below an active trace extension levels, confirming potential reversal.
🔵 FEATURES
Adjustable sensitivity length for swing detection.
Separate longevity controls for upper and lower swing traces.
Fading gradient coloring for visualizing how long a trace has been active.
Double-trace plotting: one at the swing level and one offset by trace size.
Clear BUY/SELL signals when price crosses a swing trace after it has matured.
🔵 HOW TO USE
Use blue (upper) traces as resistance zones; lime (lower) traces as support zones.
Watch for fading traces: the longer they persist, the weaker their influence becomes.
Retest dots (●) confirm when price retest a trace, signaling a potential reversal.
Shorter sensitivity values detect faster, smaller swings; longer values capture major swing structures.
Combine with trend indicators or volume to filter false breakout signals.
🔵 CONCLUSION
The Swing Traces indicator is a powerful tool for mapping price memory. By projecting recent swing highs and lows forward and fading them over time, it helps traders see where price may react, consolidate, or break through with strength. Its dynamic traces and breakout labels make it especially useful for swing traders, breakout traders, and liquidity hunters.

ONLY LONG – 4H Breakout → 1H EMA(12/21) [Signals]🔹 ONLY LONG – 4H Breakout → 1H EMA(12/21)
Author: SystemsOverFeelings
Type: Signal-only indicator (non-repainting)
Timeframe: Designed for the 1H chart
Markets: BTCUSDT perpetual& major pairs
📖 Concept
A high-timeframe confirmation model for trend-continuation longs.
It detects:
A 4-Hour breakout candle closing above recent range highs,
With very-high volume confirmation, and
Then waits for a 1-Hour pullback into the EMA(12/21) band or a Break of Structure (BOS) to re-enter.
No repainting — all 4H logic uses request.security(..., lookahead_off) for confirmed data.
🧩 Signal Logic
✅ 4H Trigger: Breakout candle with volume > SMA(20) × user multiplier.
✅ Armed Regime: Green background = system ready for 1H entries.
🟢 LONG Signal: 1H candle consolidates inside or touches the EMA band, or shows BOS confirmation.
❌ EXIT Signal: 4H EMA(12) crosses below EMA(21).
All signals are visually marked and alert-ready.
⚙️ Adjustable Parameters
4H volume multiplier
Range lookback days
Pullback strictness (inside/touch)
1H BOS pivot length & mode
Expiry time for invalidated setups
🔔 Alerts
Built-in alerts for:
4H breakout trigger
1H long entry signal
4H band exit
Use them directly via “Create Alert → Condition → This Script → Choose Signal.”
💡 Notes
Works best on BTC/ETH 1H chart.
Non-repainting, multi-timeframe logic.
Use for directional bias or entry timing — not financial advice.

Liquidity Sweep Breakout - LSBLiquidity Sweep Breakout - LSB
A professional session-based breakout system designed for OANDA:USDJPY and other JPY pairs.
Not guesswork, but precision - built on detailed observation of institutional moves to capture clear trade direction daily.
Master the Market’s Daily Bank Flow.
---
Strategy Detail:
I discovered this strategy after carefully studying how Japanese banks influence the forex market during their daily settlement period. Banks are some of the biggest players in the financial world, and when they adjust or settle their accounts in the morning, it often creates a push in the market. From years of observation, I noticed a consistent pattern, once banks finish their settlements, the market usually continues moving in the same direction that was formed right after those actions. This daily banking flow often sets the tone for the entire trading session, especially for JPY pairs like USDJPY.
To capture this move, I built the indicator so that it follows the bank-driven trend with clear rules for entries, stop-loss (SL), and take-profit (TP). The system is designed with professional risk management in mind. By default, it assumes a $10,000 account size, risks only 1% of that balance per trade, and targets a 1:1.5 reward-to-risk ratio. This means for every $100 risked, the potential profit is $150. Such controlled risk makes the system safer and more sustainable for long-term traders. At the same time, users are not limited to this setup, they can adjust the account balance in the settings, and the indicator will automatically recalculate the lot size and risk levels based on their own capital. This ensures the strategy works for small accounts and larger accounts alike.
🌍 Why It Works
Fundamentally driven: Based on **daily Japanese banking settlement flows**.
Session-specific precision: Targets the exact window when USDJPY liquidity reshapes.
Risk-managed: Always calculates lot size based on account and risk preferences.
Automatable: With webhook + MT5 EA, it can be fully hands-free.
---
✅ Recommended
Pair: USDJPY (best observed behavior).
Timeframe: 3-Minute chart.
Platform: TradingView Premium (for webhooks).
Execution: MT5 via EA.
---
🔎 Strategy Concept
The Tokyo Magic Breakout (TMB) is built on years of session observation and the unique daily rhythm of the Japanese banking system.
Every morning between 5:50 AM – 6:10 AM PKT (09:50 – 10:10 JST), Japanese banks perform daily reconciliation and settlement. This often sets the tone for the USDJPY direction of the day.
This strategy isolates that critical moment of liquidity adjustment and waits for a clean breakout confirmation. Instead of chasing noise, it executes only when price action is aligned with the Tokyo market’s hidden flows.
---
🕒 Timing Logic
Session Start: 5:00 AM PKT (Tokyo market open range).
Magic Candle: The 5:54 AM PKT candle is marked as the reference “breakout selector.”
Checkpoints: First confirmation at 6:30 AM PKT, then every 15 minutes until 8:30 AM PKT.
* If price stays inside the magic range → wait.
* If a breakout happens but the candle wick touches the range → wait for the next checkpoint.
* If by 8:30 AM PKT no clean breakout occurs → the day is marked as No Trade Day (NTD).
👉 Recommended timeframe: 3-Minute chart (3M) for precise signals.
---
📈 Trade Execution
Entry: Clean break above/below the magic candle’s range.
Stop-Loss: Opposite side of the Tokyo session high/low.
Take-Profit: Calculated by Reward\:Risk ratio (default 1.5:1).
Lot Size: Auto-calculated based on your risk model:
* Fixed Dollar
* % of Equity
* Conservative (minimum of both).
Visuals include:
✅ Entry/SL/TP lines
✅ Shaded risk (red) and reward (green) zones
✅ Trade labels (Buy/Sell with lot size & levels)
✅ TP/SL hit markers
---
🔔 Alerts & Automation (AutoTMB)
This strategy is fully automation-ready with EA + MT5:
1. Enable alerts in TMB settings.
2. Insert your PineConnector License Key.
3. Configure your risk management preferences.
4. Create a TradingView alert → in the message box simply type:
Pine Script®
{{alert_message}}
and set the EA webhook.
Now, every breakout trade (with exact entry, SL, TP, and lot size) is sent instantly.
👉 On your MT5:
* Install the EA.
* Use the same license key.
* Run it on a VPS or local MT5 terminal.
You now have a hands-free trading system: AutoTMB.

Recent Range DetectorOverview
The Recent Range Detector is a specialized indicator designed to identify when an asset is currently range-bound, providing traders with clear support and resistance levels for range trading strategies. Unlike traditional indicators that focus on trend detection, this tool specifically answers the question: "Is the price range-bound right now, and what are the exact trading levels?"
Key Features
✅ Smart Range Detection - Uses a multi-factor scoring system to identify legitimate ranges
✅ Dynamic Support/Resistance Levels - Automatically calculates and displays key trading levels
✅ Range Quality Scoring - Provides confidence levels (Strong/Moderate/Weak Range)
✅ Touch Validation - Counts actual price touches to confirm range reliability
✅ Breakout Detection - Alerts when price exits the established range
✅ Visual Clarity - Clean boxes, lines, and labels for easy interpretation
How It Works
The indicator analyses recent price action using three core metrics:
Touch Quality (40%) - How many times price has respected support/resistance levels
Containment Quality (40%) - What percentage of recent bars stayed within the range
Recent Respect (20%) - Whether the latest price action confirms the range
These combine into a Range Score (0-1) that determines range strength and reliability.
Settings & Parameters
Range Lookback Period (Default: 15)
Number of bars to analyse for range detection
Shorter periods = more responsive to recent ranges
Longer periods = more stable, fewer false signals
Range Tolerance (Default: 2.0%)
Tolerance for price touches around exact highs/lows
Lower values = stricter range requirements
Higher values = more flexible range detection
Minimum Touches (Default: 3)
Required number of support/resistance touches for valid range
Higher values = more confirmed ranges, fewer signals
Lower values = more sensitive, earlier detection
Visual Options
Show Range Box: Displays the range boundaries
Show Support/Resistance Lines: Extends levels into the future
Understanding the Output
Range Score (0.000 - 1.000)
0.7+ = Strong Range (Green) - High confidence range trading setup
0.5-0.7 = Moderate Range (Yellow) - Decent range with some caution
0.3-0.5 = Weak Range (Orange) - Low confidence, be careful
<0.3 = Not Ranging - Avoid range trading strategies
Range Status Classifications
Strong Range - Perfect for range trading strategies
Moderate Range - Good range with normal risk
Weak Range - Marginal range, use smaller positions
Not Ranging - Price is trending or too choppy for range trading
Key Metrics in Info Table
Range Size (%) - Size of the range relative to price level
5-15% = Ideal range size for most strategies
<5% = Tight range, lower profit potential
>15% = Wide range, higher profit potential but more risk
Support/Resistance Levels - Exact price levels for entries/exits
Use these as your key trading levels
Support = potential buy zone
Resistance = potential sell zone
Total Touches - Number of times price respected the levels
3-5 touches = Newly formed range
6-10 touches = Well-established range
10+ touches = Very strong, reliable range
Price Position (%) - Current location within the range
0-20% = Near support (potential long opportunity)
80-100% = Near resistance (potential short opportunity)
40-60% = Middle of range (wait for better entry)
Visual Elements
Range Box
Green Box = Strong Range (Score ≥ 0.7)
Yellow Box = Moderate Range (Score 0.5-0.7)
Orange Box = Weak Range (Score 0.3-0.5)
Support/Resistance Lines
- Horizontal lines showing exact trading levels
- Extend into the future for forward guidance
- Colour matches the range strength
Background Colouring
- Subtle background tint during range periods
- Helps quickly identify ranging vs trending markets
Breakout Signals
- 📈 RANGE BREAK UP - Price breaks above resistance
- 📉 RANGE BREAK DOWN - Price breaks below support
- Only appears for confirmed ranges (Score ≥ 0.5)
Trading Applications
Range Trading Strategy
1. Look for Range Score ≥ 0.5
2. Buy near support (Price Position 0-20%)
3. Sell near resistance (Price Position 80-100%)
4. Set stops just outside the range
5. Exit on breakout signals
Breakout Strategy
1. Identify strong ranges (Score ≥ 0.7)
2. Wait for volume-confirmed breakout
3. Enter in breakout direction
4. Use previous resistance as support (or vice versa)
Market Context
- Strong ranges often occur after trending moves
- Use higher timeframes to confirm overall market structure
- Combine with volume analysis for better entries/exits
Best Practices
What to Look For
✅ Range Score ≥ 0.5 for trading consideration
✅ Multiple touches (5+) for confirmation
✅ Clear price rejection at levels
✅ Reasonable range size (5-15% for most assets)
✅ Recent price respect of boundaries
What to Avoid
❌ Trading ranges with Score < 0.3
❌ Very tight ranges (<3% size) - low profit potential
❌ Ranges with only 1-2 touches - not confirmed
❌ Ignoring breakout signals
❌ Trading against the higher timeframe trend
Alerts Available
- Range Detected - New range formation
- Range Break Up - Upward breakout
- Range Break Down - Downward breakout
- Range Ended - Range condition ended
Timeframe Recommendations
- Daily Charts - Best for swing trading ranges
- 4H Charts - Good for intermediate-term ranges
- 1H Charts - Suitable for day trading ranges
- Lower Timeframes - May produce more noise
Conclusion
The Recent Range Detector eliminates guesswork in range identification by providing objective, quantified range analysis. It's particularly valuable for traders who prefer range-bound strategies or need to identify when trending strategies should be avoided.
Remember: No indicator is perfect. Always combine with proper risk management, volume analysis, and broader market context for best results.
Disclaimer
This indicator is for educational purposes only and should not be considered as financial advice. Trading involves risk, and past performance does not guarantee future results. Always conduct your own research and consider your risk tolerance before making any trading decisions.

Clarix 5m Scalping Breakout StrategyPurpose
A 5-minute scalping breakout strategy designed to capture fast 3-5 pip moves, using premium/discount zone filters and market bias conditions.
How It Works
The script monitors price action in 5-minute intervals, forming a 15-minute high and low range by tracking the highs and lows of the first 3 consecutive 5-minute candles starting from a custom time. In the next 3 candles, it waits for a breakout above the 15m high or below the 15m low while confirming market bias using custom equilibrium zones.
Buy signals trigger when price breaks the 15m high while in a discount zone
Sell signals trigger when price breaks the 15m low while in a premium zone
The strategy simulates trades with fixed 3-5 pip take profit and stop loss values (configurable). All trades are recorded in a backtest table with live trade results and an automatically updated win rate.
Features
Designed exclusively for the 5-minute timeframe
Custom 15-minute high/low breakout logic
Premium, Discount, and Equilibrium zone display
Built-in backtest tracker with live trade results, statistics, and win rate
Customizable start time, take profit, and stop loss settings
Real-time alerts on breakout signals
Visual markers for trade entries and failed trades
Consistent win rate exceeding 90–95% on average when following market conditions
Usage Tips
Use strictly on 5-minute charts for accurate signal performance. Avoid during high-impact news releases.
Important: Once a trade is opened, manually set your take profit at +3 to +5 pips immediately to secure the move, as these quick scalps often hit the target within a single candle. This prevents missed exits during rapid price action.

Opening Range Breakout🧭 Overview
The Open Range Breakout (ORB) indicator is designed to capture and display the initial price range of the trading day (typically the first 15 minutes), and help traders identify breakout opportunities beyond this range. This is a popular strategy among intraday and momentum traders.
🔧 Features
📊 ORB High/Low Lines
Plots horizontal lines for the session’s high and low
🟩 Breakout Zones
Background highlights when price breaks above or below the range
🏷️ Breakout Labels
Text labels marking breakout events
🧭 Session Control
Customizable session input (default: 09:15–09:30 IST)
📍 ORB Line Labels
Text labels anchored to the ORB high and low lines (aligned right)
🔔 Alerts
Configurable alerts for breakout events
⚙️ Adjustable Settings
Show/hide background, labels, session window, etc.
⏱️ Session Logic
• The ORB range is calculated during a defined session window (default: 09:15–09:30).
• During this window, the highest high and lowest low are recorded as ORB High and ORB Low.
📈 Breakout Detection
• Breakout Above: Triggered when price crosses above the ORB High.
• Breakout Below: Triggered when price crosses below the ORB Low.
• Each breakout can trigger:
• A background highlight (green/red)
• A text label (“Breakout ↑” / “Breakout ↓”)
• An optional alert
🔔 Alerts
Two built-in alert conditions:
1. Breakout Above ORB High
• Message: "🔼 Price broke above ORB High: {{close}}"
2. Breakout Below ORB Low
• Message: "🔽 Price broke below ORB Low: {{close}}"
You can create alerts in TradingView by selecting these from the Add Alert window.
📌 Best Use Cases
• Intraday momentum trading
• Breakout and scalping strategies
• First 15-minute range traders (NSE, BSE markets)

Bollinger Bands Entry/Exit ThresholdsBollinger Bands Entry/Exit Thresholds
Author of enhancements: chuckaschultz
Inspired and adapted from the original 'Bollinger Bands Breakout Oscillator' by LuxAlgo
Overview
Pairs nicely with Contrarian 100 MA
The Bollinger Bands Entry/Exit Thresholds is a powerful momentum-based indicator designed to help traders identify potential entry and exit points in trending or breakout markets. By leveraging Bollinger Bands, this indicator quantifies price deviations from the bands to generate bullish and bearish momentum signals, displayed as an oscillator. It includes customizable entry and exit signals based on user-defined thresholds, with visual cues plotted either on the oscillator panel or directly on the price chart.
This indicator is ideal for traders looking to capture breakout opportunities or confirm trend strength, with flexible settings to adapt to various markets and trading styles.
How It Works
The Bollinger Bands Entry/Exit Thresholds calculates two key metrics:
Bullish Momentum (Bull): Measures the extent to which the price exceeds the upper Bollinger Band, expressed as a percentage (0–100).
Bearish Momentum (Bear): Measures the extent to which the price falls below the lower Bollinger Band, also expressed as a percentage (0–100).
The indicator generates:
Long Entry Signals: Triggered when the bearish momentum (bear) crosses below a user-defined Long Threshold (default: 40). This suggests weakening bearish pressure, potentially indicating a reversal or breakout to the upside.
Exit Signals: Triggered when the bullish momentum (bull) crosses below a user-defined Sell Threshold (default: 80), indicating a potential reduction in bullish momentum and a signal to exit long positions.
Signals are visualized as tiny colored dots:
Long Entry: Blue dots, plotted either at the bottom of the oscillator or below the price bar (depending on user settings).
Exit Signal: White dots, plotted either at the top of the oscillator or above the price bar.
Calculation Methodology
Bollinger Bands:
A user-defined Length (default: 14) is used to calculate an Exponential Moving Average (EMA) of the source price (default: close).
Standard deviation is computed over the same length, multiplied by a user-defined Multiplier (default: 1.0).
Upper Band = EMA + (Standard Deviation × Multiplier)
Lower Band = EMA - (Standard Deviation × Multiplier)
Bull and Bear Momentum:
For each bar in the lookback period (length), the indicator calculates:
Bullish Momentum: The sum of positive deviations of the price above the upper band, normalized by the total absolute deviation from the upper band, scaled to a 0–100 range.
Bearish Momentum: The sum of positive deviations of the price below the lower band, normalized by the total absolute deviation from the lower band, scaled to a 0–100 range.
Formula:
bull = (sum of max(price - upper, 0) / sum of abs(price - upper)) * 100
bear = (sum of max(lower - price, 0) / sum of abs(lower - price)) * 100
Signal Generation:
Long Entry: Triggered when bear crosses below the Long Threshold.
Exit: Triggered when bull crosses below the Sell Threshold.
Settings
Length: Lookback period for EMA and standard deviation (default: 14).
Multiplier: Multiplier for standard deviation to adjust Bollinger Band width (default: 1.0).
Source: Input price data (default: close).
Long Threshold: Bearish momentum level below which a long entry signal is generated (default: 40).
Sell Threshold: Bullish momentum level below which an exit signal is generated (default: 80).
Plot Signals on Main Chart: Option to display entry/exit signals on the price chart instead of the oscillator panel (default: false).
Style:
Bullish Color: Color for bullish momentum plot (default: #f23645).
Bearish Color: Color for bearish momentum plot (default: #089981).
Visual Features
Bull and Bear Plots: Displayed as colored lines with gradient fills for visual clarity.
Midline: Horizontal line at 50 for reference.
Threshold Lines: Dashed green line for Long Threshold and dashed red line for Sell Threshold.
Signal Dots:
Long Entry: Tiny blue dots (below price bar or at oscillator bottom).
Exit: Tiny white dots (above price bar or at oscillator top).
How to Use
Add to Chart: Apply the indicator to your TradingView chart.
Adjust Settings: Customize the Length, Multiplier, Long Threshold, and Sell Threshold to suit your trading strategy.
Interpret Signals:
Enter a long position when a blue dot appears, indicating bearish momentum dropping below the Long Threshold.
Exit the long position when a white dot appears, indicating bullish momentum dropping below the Sell Threshold.
Toggle Plot Location: Enable Plot Signals on Main Chart to display signals on the price chart for easier integration with price action analysis.
Combine with Other Tools: Use alongside other indicators (e.g., trendlines, support/resistance) to confirm signals.
Notes
This indicator is inspired by LuxAlgo’s Bollinger Bands Breakout Oscillator but has been enhanced with customizable entry/exit thresholds and signal plotting options.
Best used in conjunction with other technical analysis tools to filter false signals, especially in choppy or range-bound markets.
Adjust the Multiplier to make the Bollinger Bands wider or narrower, affecting the sensitivity of the momentum calculations.
Disclaimer
This indicator is provided for educational and informational purposes only.

VWAP & Breakout Volume ConfirmHow the TradingView Indicator Works (Explained Simply)
VWAP Line (Orange)
It plots the Volume Weighted Average Price for the day.
Price above VWAP = bullish zone
Price below VWAP = bearish zone
Volume Spike Detection (Red Triangle)
It calculates the average volume over the last 20 candles.
If the current volume is 1.5× that average, it plots a red triangle under the candle.
Helps confirm if a move has real momentum or not.
Breakout Confirmation (Green Label ‘BO’)
Checks if price breaks above the last 10-bar high (for upside breakout) or below the last 10-bar low (for downside breakout).
If a breakout happens and the volume spike is present, it plots a green “BO” label above the candle.
This tells you the breakout is strong and likely to follow through.

Triangle Breakout Strategy with TP/SL, EMA Filter📌 Triangle Breakout Strategy with TP/SL, EMA Filters, and Backtest – Explained.
✅ 1. Pattern Detection – Triangle Breakout
The script scans for triangle patterns by detecting local pivot highs and pivot lows.
It uses two recent highs and two recent lows to draw converging trendlines (upper and lower boundaries of the triangle).
If the price breaks above the upper trendline, a bullish breakout signal is generated.
🎯 2. TP (Take Profit) & SL (Stop Loss)
When a bullish breakout is detected:
A buy order is placed using strategy.entry.
TP and SL levels are calculated relative to the current close price:
TP = 3% above the entry price
SL = 1.5% below the entry price
These are defined using strategy.exit.
📊 3. EMA Filter
An optional filter checks if:
Price is above both EMA 20 and EMA 50
Only if this condition is met, the strategy allows a long entry.
You can toggle the filter on or off with useEMAFilter.
📈 4. Backtesting with Strategy Tester
This script uses strategy() instead of indicator() to enable TradingView’s built-in backtest engine.
Every buy entry and exit (based on TP or SL) is recorded.
📌 5. Visuals
EMA 20 and EMA 50 lines are plotted on the chart.
A label is shown when a breakout is detected: "Breakout Up"
Results (profit, win rate, drawdown, etc.) can be viewed in the Strategy Tester panel.

VoluTility🌊 VoluTility forecasts trend exhaustion, breakout pressure, and structural inflection by measuring volatility within the effort stream. Built on the concept of ATR applied to volume, it doesn’t read raw volume — it reveals whether that volume is stable, chaotic, or compressing ahead of a move. The goal is to detect structural setups before they resolve. The lower the timeframe, the greater the alpha.
🧠 Core Logic
A zero-centered histogram shows the deviation of smoothed volume from its own volatility baseline. Positive bars indicate expansion; negative bars signal compression. Color reflects rate-of-change in volume volatility. Opacity tracks effort/result strength — showing when moves are real or hollow.
The overlaid ribbon (EMA vs HMA) highlights rhythm shifts. Orange fill signals real expansion; yellow shows decay or absorption. Together, they expose pre-breakout compression and exhaustion tails before price reacts.
🏗️ Structural Read
On the 1H BTC chart shown, price coils into a shallow pullback, compressing within a narrow range marked by shrinking candle bodies and muted wick aggression. A sudden expansion candle breaks the coil cleanly, with no immediate rejection or wick reversion. Price holds above the breakout pivot, establishing a baseline for structural acceptance and shifting bias toward continuation.
🔰 Zone Descriptions
🔴 Volatile blowout
🟠 Clean expansion
🟡 Passive or absorbed effort
🟢 Steady-state rhythm
🔵 Compression coil
🧐 Suggested Use
VoluTility is expressly designed as an overlay for sub-pane indicators, where it acts as a second-order rhythm map — exposing hidden structural pressure within volume or volatility streams. When paired with volume (like ZVOL or OBVX), it highlights when flow is expanding with intent versus fading into noise. When layered over volatility signals (like ATR Turbulence or WIRE), it reveals whether expansion has real effort behind it — or is just structural slack.
It pairs especially well with the Relative Directional Index (RDI), where its histogram and ribbon offer early exhaustion signals before traditional trend or momentum fades appear. On raw momentum tools, it acts as a filter: softening false breaks and confirming pressure-backed continuation.
Run on 15m or lower charts for early entry cues or breakout anticipation. On 1H charts, use it to validate compression resolution or detect fatigue before structure turns. It doesn’t react to price — it forecasts readiness.

Pure Price Action Breakout with 1:5 RR
Description of the Price Action Trading Script (Pine Script v6)
Overview
This script is a pure price action-based breakout strategy designed for TradingView. It identifies key breakout levels and executes long and short trades based on market structure. The strategy ensures a minimum risk-to-reward ratio (RR) of 1:5, aiming for high profitability with well-defined stop-loss and take-profit levels.
How the Script Works
1️⃣ Breakout Identification
The script uses a lookback period to find the highest high and lowest low over the last n bars.
A bullish breakout occurs when the price closes above the previous highest high.
A bearish breakout happens when the price closes below the previous lowest low.
2️⃣ Entry & Exit Strategy
Long Entry: If a bullish breakout is detected, the script enters a long position.
Short Entry: If a bearish breakout is detected, the script enters a short position.
The stop-loss is placed at the recent swing low (for long trades) or recent swing high (for short trades).
The target price is calculated based on a risk-to-reward ratio of 1:5, ensuring profitable trades.
3️⃣ Risk Management
The stop-loss prevents excessive losses by exiting trades when the market moves unfavorably.
The strategy ensures that each trade has a reward potential at least 5 times the risk.
Positions are executed based on price action only, without indicators like moving averages or RSI.
4️⃣ Visual Representation
The script plots breakout levels to help traders visualize potential trade setups.
Entry points, stop-loss, and take-profit levels are labeled on the chart for easy tracking.
Key Features & Benefits
✔ Pure Price Action – No lagging indicators, only real-time price movements.
✔ High Risk-to-Reward Ratio (1:5) – Ensures high-profit potential trades.
✔ Real-time Entry & Exit Signals – Provides accurate trade setups.
✔ Dynamic Stop-loss Calculation – Adjusts based on recent market structure.
✔ Customizable Parameters – Lookback periods and risk ratios can be modified.

ORB opening range breakoutThis indicator plots the opening range high and low for a selected period of time in minutes after the market opens on an intraday chart to allow the user to visualize the high and low of the opening range for use in the Opening Range Breakout (ORB) strategy.
The Opening Range Breakout (ORB) strategy is a trading approach that involves identifying the price range within the first few minutes of a market session and then waiting for the price to break out of that range. This indicator facilitates this strategy through the use of shaded regions and/or price levels.
Features
Able to plot the high and low for any opening range above 1 min on any intraday timeframe
Fully customizable ORB region, price level, price axis, label
The inclusion of the Bollinger band along with it's Moving Average serves multiple purposes to assist the user in the opening range breakout strategy
Highlights to the user the deviation from the Moving Average due to an opening range breakout so that the user is better informed on whether to avoid entering a position, exit a position, or monitor the situation more closely
Highlights area of support or resistance formed by the Moving Average of Bollinger Band
Inform the user of the current trend direction to serve as confluence during an opening range breakout
What sets this indicator apart from others
In other ORB indicators, the opening range must be a multiple of the current chart's timeframe, restricting users on the intraday timeframes that can be used. E.g. if the user is using the 15 minutes opening range, they are restricted to use the 1, 3, 5, 15 minute(s) chart.
This indicator gives the user the flexibility to set any opening range above 1 min on any intraday timeframe. E.g. if the user is using the 15 minutes opening range, they are free to use any intraday timeframe on their chart, such as 1 hour or 2 hours chart.
How to use
Input the opening time range of interest in minutes
Check the "ORB region" checkbox to shade the ORB region
Check the "PRICE LEVEL" checkbox to draw a horizontal line of the high and low
Check the "PRICE AXIS" checkbox to plot the values on the price axis
Check the "LABEL" checkbox to draw a label of the high and low

rsi wf breakoutRSI Breakout Asif
RSI Breakout Asif Indicator
Overview:
The RSI Breakout Asif indicator is a custom script designed to analyze and highlight potential
breakout points using the Relative Strength Index (RSI) combined with Williams Fractals. This
indicator is specifically developed for traders who want to identify key momentum shifts in the
market.
Features:
1. RSI Analysis:
- The RSI is calculated using a user-defined length and price source.
- Horizontal lines are plotted at levels 70 (overbought), 50 (neutral), and 30 (oversold) to visually
aid decision-making.
2. Williams Fractals on RSI:
- Detects fractal highs and lows based on RSI values.
- Highlights these fractal points with dynamic, symmetrical lines for better visibility.
3. Customization:
- Users can adjust the RSI length and price source for personalized analysis.
- Fractal settings (left and right bar length) are also adjustable, making the indicator versatile for
different trading styles.
4. Visual Enhancements:
- Fractal highs are marked in red, while fractal lows are marked in green.
Asif - Page 1
RSI Breakout Asif
- Precise line placement ensures clarity and reduces chart clutter.
5. Practical Utility:
- Use the fractal breakout signals in conjunction with other technical indicators for enhanced
decision-making.
Usage:
- Add the RSI Breakout Asif indicator to your TradingView chart.
- Adjust the settings according to your trading strategy.
- Observe the RSI values and fractal points to identify potential breakout zones.
Disclaimer:
This indicator is a technical analysis tool and should be used in combination with other analysis
methods. It does not guarantee profitable trades.
Watermarked by Asif.
Asif - Page 2

Ultra Volume High Breakoutser Inputs:
length: Defines the period to calculate the moving average of volume.
multiplier: Sets the threshold above the moving average to consider as "Ultra Volume."
breakoutMultiplier: Allows for customization of breakout sensitivity.
Volume Calculation:
The script calculates a simple moving average (SMA) of the volume for a defined period (length).
It then detects if the current volume is higher than the moving average multiplied by the user-defined multiplier.
Breakout Condition:
The script checks if the price has moved above the highest close of the previous length periods while the volume condition for "Ultra Volume" is true.
Visuals:
The script marks the breakout with an upward label below the bar (plotshape), colored green for easy identification.
Ultra volume is highlighted with a red histogram plot.
Alert Condition:
An alert condition is included to trigger whenever an ultra volume high breakout occurs.
Customization:
You can adjust the length, multiplier, and breakoutMultiplier to fit your strategy and asset volatility.
Alerts can be set in TradingView to notify you when this condition is met.
Let me know if you'd like further customization or explanation!

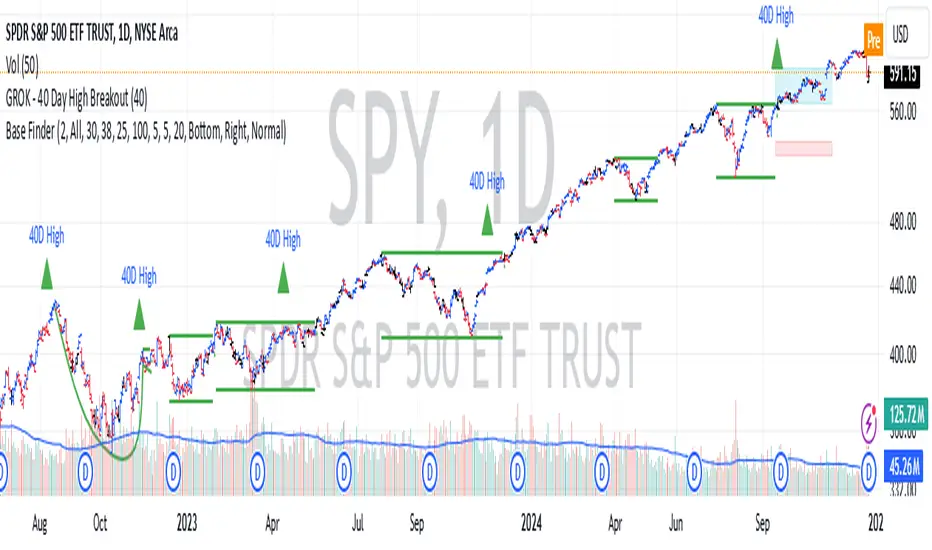
GROK - 40 Day High BreakoutTitle: GROK - Customizable High Breakout Detector
To scan base breakout with Pine Screener
Description:
This Pine Script indicator identifies high breakout patterns based on a user-defined lookback period. By default, it checks for a breakout of the 40-day high, but the period can be adjusted to suit your trading strategy. Key features include:
Custom Lookback Period: Easily modify the number of days for high breakout detection. Lookback period is length of base you want to scan using pine screener.
Visual Alerts: Displays a green triangle above the price bar when a breakout is detected.
Alert Conditions: Built-in alert notifications for automated breakout detection.
Screener Compatibility: Plots breakout signals as a histogram for screener use.
This script is ideal for traders looking to identify strong breakout patterns and incorporate them into their strategies.
How to Use:
Adjust the lookback period in the settings to match your desired breakout criteria.
Add alerts for automated notifications when a breakout is detected.
Use the visual markers and histogram to analyze breakout patterns on your chart.
ADX Breakout Strategy█ OVERVIEW
The ADX Breakout strategy leverages the Average Directional Index (ADX) to identify and execute breakout trades within specified trading sessions. Designed for the NQ and ES 30-minute charts, this strategy aims to capture significant price movements while managing risk through predefined stop losses and trade limits.
This strategy was taken from a strategy that was posted on YouTube. I would link the video, but I believe is is "against house rules".
█ CONCEPTS
The strategy is built upon the following key concepts:
ADX Indicator: Utilizes the ADX to gauge the strength of a trend. Trades are initiated when the ADX value is below a certain threshold, indicating potential for trend development.
Trade Session Management: Limits trading to specific hours to align with optimal market activity periods.
Risk Management: Implements a fixed dollar stop loss and restricts the number of trades per session to control exposure.
█ FEATURES
Customizable Stop Loss: Set your preferred stop loss amount to manage risk effectively.
Trade Session Configuration: Define the trading hours to focus on the most active market periods.
Entry Conditions: Enter long positions when the price breaks above the highest close in the lookback window and the ADX indicates potential trend strength.
Trade Limits: Restrict the number of trades per session to maintain disciplined trading.
Automated Exit: Automatically closes all positions at the end of the trading session to avoid overnight risk.
█ HOW TO USE
Configure Inputs :
Stop Loss ($): Set the maximum loss per trade.
Trade Session: Define the active trading hours.
Highest Lookback Window: Specify the number of bars to consider for the highest close.
Apply the Strategy :
Add the ADX Breakout strategy to your chart on TradingView.
Ensure you are using a 30-minute timeframe for optimal performance.
█ LIMITATIONS
Market Conditions: The strategy is optimized for trending markets and may underperform in sideways or highly volatile conditions.
Timeframe Specific: Designed specifically for 30-minute charts; performance may vary on different timeframes.
Single Asset Focus: Primarily tested on NQ and ES instruments; effectiveness on other symbols is not guaranteed.
█ DISCLAIMER
This ADX Breakout strategy is provided for educational and informational purposes only. It is not financial advice and should not be construed as such. Trading involves significant risk, and you may incur substantial losses. Always perform your own analysis and consider your financial situation before using this or any other trading strategy. The source material for this strategy is publicly available in the comments at the beginning of the code script. This strategy has been published openly for anyone to review and verify its methodology and performance.

Volatility Trend Bands [UAlgo]The Volatility Trend Bands is a trend-following indicator that combines the concepts of volatility and trend detection. Built using the Average True Range (ATR) to measure volatility, this indicator dynamically adjusts upper and lower bands around price movements. The bands act as dynamic support and resistance levels, making it easier to identify trend shifts and potential entry and exit points.
With the ATR multiplier, this indicator effectively captures volatility-based shifts in the market. The use of midline values allows for accurate trend detection, which is displayed through color-coded signals on the chart. Additionally, this tool provides clear buy and sell signals, accompanied by intuitive graphical markers for ease of use.
The Volatility Trend Bands is ideal for traders seeking an adaptive trend-following method that responds to changing market conditions while maintaining robust volatility control.
🔶 Key Features
Dynamic Support and Resistance: The indicator utilizes volatility to create dynamic bands. The upper band acts as resistance, and the lower band acts as support for the price. Wider bands indicate higher volatility, while narrower bands indicate lower volatility.
Customizable Inputs
You can tailor the indicator to your strategy by adjusting the:
Price Source: Select the price data (e.g., closing price) used for calculations.
ATR Length: Define the lookback period for the Average True Range (ATR) volatility measure.
ATR Multiplier: This factor controls the width of the volatility bands relative to the ATR value.
Color Options: Choose colors for the bands and signal arrows for better visualization.
Visual Signals: Arrows ("▲" for buy, "▼" for sell) appear on the chart when the trend changes, providing clear entry point indications.
Alerts: Integrated alerts for both buy and sell conditions, allowing you to receive notifications for potential trade opportunities.
🔶 Interpreting Indicator
Upper and Lower Bands: The upper and lower bands are dynamic, adjusting based on market volatility using the ATR. These bands serve as adaptive support and resistance levels. When price breaks above the upper band, it indicates a potential bullish breakout, signaling a strong uptrend. Conversely, a break below the lower band signals a bearish breakout, indicating a downtrend.
Buy/Sell Signals: The indicator provides clear buy and sell signals at breakout points. A buy signal ("▲") is generated when the price breaks above the upper band, suggesting the start of a bullish trend. A sell signal ("▼") is triggered when the price breaks below the lower band, indicating the beginning of a bearish trend. These signals help traders identify potential entry and exit points at key breakout levels.
Color-Coded Bars: The bars on the chart change color based on the trend direction. Teal bars represent bullish momentum, while purple bars signify bearish momentum. This color coding provides a quick visual cue about the market's current direction.
🔶 Disclaimer
Use with Caution: This indicator is provided for educational and informational purposes only and should not be considered as financial advice. Users should exercise caution and perform their own analysis before making trading decisions based on the indicator's signals.
Not Financial Advice: The information provided by this indicator does not constitute financial advice, and the creator (UAlgo) shall not be held responsible for any trading losses incurred as a result of using this indicator.
Backtesting Recommended: Traders are encouraged to backtest the indicator thoroughly on historical data before using it in live trading to assess its performance and suitability for their trading strategies.
Risk Management: Trading involves inherent risks, and users should implement proper risk management strategies, including but not limited to stop-loss orders and position sizing, to mitigate potential losses.
No Guarantees: The accuracy and reliability of the indicator's signals cannot be guaranteed, as they are based on historical price data and past performance may not be indicative of future results.
