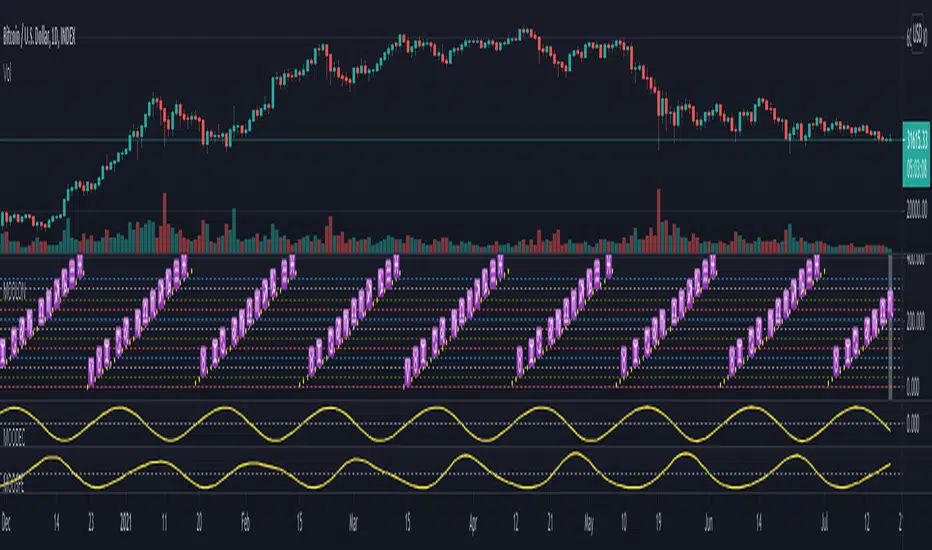
Financial Astrology Moon LongitudeMoon energy represent the masses, crowds, public places, children and emotions. The transit of the Moon through the zodiacal signs will color the crowd emotional responses that fluctuate based on the elemental qualities of the signs: fire (energetic and impulsive), earth (rigid, static, patient), water (assimilation, transformation, humor fluctuations), air (expansion, fervent, germination).
The daily average speed of the Moon is 13 degrees, for this reason the emotional elemental energy is transforming in average every 2 days and few hours, this mood fluctuations produces the short term instinctive and emotional actions performed by traders that forget the precise mathematical / statistical approach in favor of irrational and emotional impulses.
Based on statistical buy/sell frequency analysis we discovered that for BTC-USD, the Moon is usually bullish in zodiac signs: Aries, Libra, Scorpio, Aquarius and Pisces, the most relevant bullish sign is "Aquarius", from 206 observations in all the BTC-USD price history where Moon was in this sign the 60% of those days the price increased compared to the previous day. The bearish zodiac signs for BTC-USD are: Taurus, Cancer, Leo, Sagittarius and Capricorn, the most relevant bearish sign is "Capricorn".
Interestingly this zodiac sign locations tends to fluctuate during some periods of time and from the last 10 observations of the Moon transiting through Aries we noted that 7 of the 10 observations coincide with a dip, sometimes the Moon in Aries indicate the reversal of the short term trend, this is kind of expected considering that when Moon approaches Taurus the fall becomes more likely due to the fact that Moon in Taurus is a bearish signal.
With this indicator there is unlimited possibilities to explore across different markets and complementing with Moon phases this may be the perfect financial astrology indicator for those intraday traders that keep positions only for few hours.
We encourage you to analyze the Moon zodiac sign cycles in different markets and share with us your observations, leave us a comment with your research outcomes. Happy trading!
Note: The Moon longitude indicator is based on an ephemeris array that covers years 2010 to 2030, prior or after this years the longitude is not available, this daily ephemeris are based on UTC time so in order to align properly with the price bars times you should set UTC as your chart reference timezone.
Tìm kiếm tập lệnh với "btc期权交割时间"
Hopper Trigger - Free Cryptohopper WidgetWelcome to our Tradingview cryptohopper trigger widget.
We designed this script to give Cryptohopper users the possibility to set up an alarm when btc is trending down. Cause of the BTCs behavior as the supertrend coin for the market it is better to turn your hopper off or be extremly careful when BTC is trending down. We implemented to types of alarms, because atm its not possible to automate using them to deactivate your hopper. On Alarm setup could be used to send signals every minute to trigger a push notification on your App or to trigger your Alexa. The other type of alarm only sends one single signal for normal purposes.
We recommend using this indicator in the 30 minute or 1 hour timeframe and to deactivate your hopper and deleting all positions when a alarm is signaling. The risk of a larger drop is very high in this marketphase. Never take an drop again using this approach. Little drawdown in bearish or ranging times but high reward in bullish times.
Smartgrow-Trading is a community project with the aim of developing the best and most successful trading strategies and sharing them with the community.
The basic idea of this script is to calculate how far an coin is away from its ATH , to gave warning signals for deactivating coins after they reached there ATH . So it could also be used for other coins and pairs.
If there are questions, write them into the comments or contact us directly over the direct message or social media. Happy Trading!

All Time High Warning - Free Cryptohopper WidgetWelcome to our Tradingview coin prediction filter.
We designed this script to give Cryptohopper users the possibility to set up an alarm when btc is close to All Time High. Cause of the BTCs behavior as the supertrend coin for the market it is better to turn your hopper off or be extremly careful when BTC is close to ATH.
We recommend deactivating the hopper and deleting all positions. The risk of a larger drop is very high in this marketphase.
Smartgrow-Trading is a community project with the aim of developing the best and most successful trading strategies and sharing them with the community.
The basic idea of this script is to calculate how far an coin is away from its ATH, to gave warning signals for deactivating coins after they reached there ATH. So it could also be used for other coins and pairs.
If there are questions, write them into the comments or contact us directly over the direct message or social media. Happy Trading!

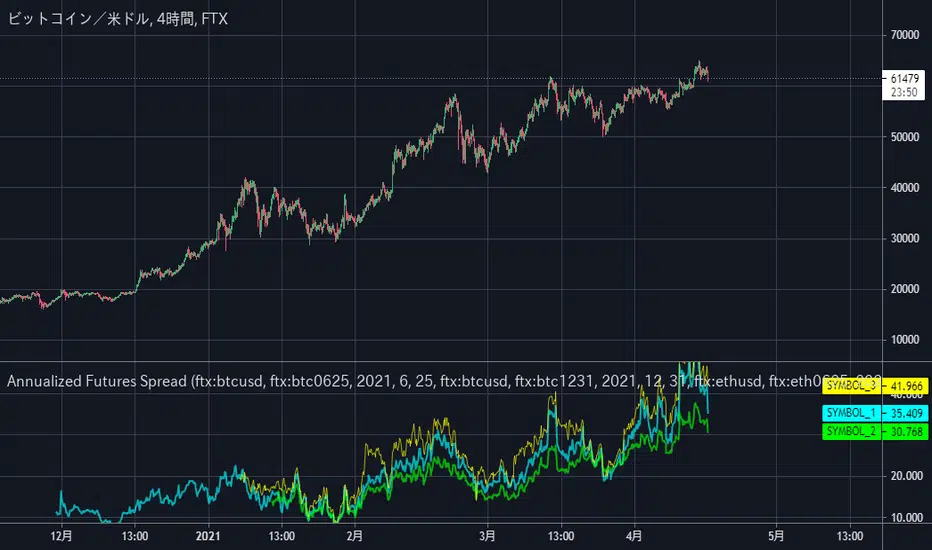
Annualized Futures Spread2つの銘柄間のスプレッドを年率換算してオシレーターの枠に表示するスクリプトです。
(BTCUSD現物とBTC-0625先物契約のような2銘柄間で使用することを想定しています。)
設定で年率換算していない生の乖離率の表示に切り替えることも可能です。
初期設定ではFTXの BTCUSDとBTCUSD-0624、BTCUSDとBTC-1231、ETHUSDとETH-0625 が指定されています。
そのまま使用しても構いませんし、設定やソースコードを編集して活用してくださって構いません。
ーーーーーーーーーーーーー
This custom script can be used to display the annualized spread rate between two specified symbols like BTCUSD and BTC-0625.
It is also possible to display raw spreads that are not annualized. (Just simply clicking the checkbox in setting.)
The default settings are BTC0625 and BTCUSD, BTC1231 and BTCUSD, and ETH0625 and ETHUSD on FTX Exchange.
You may use it as-is, or edit the settings or modify the source code as you like.
(This script was removed due to a violation of the English-Only house rule once, so this is a repost with a revised title and text.)
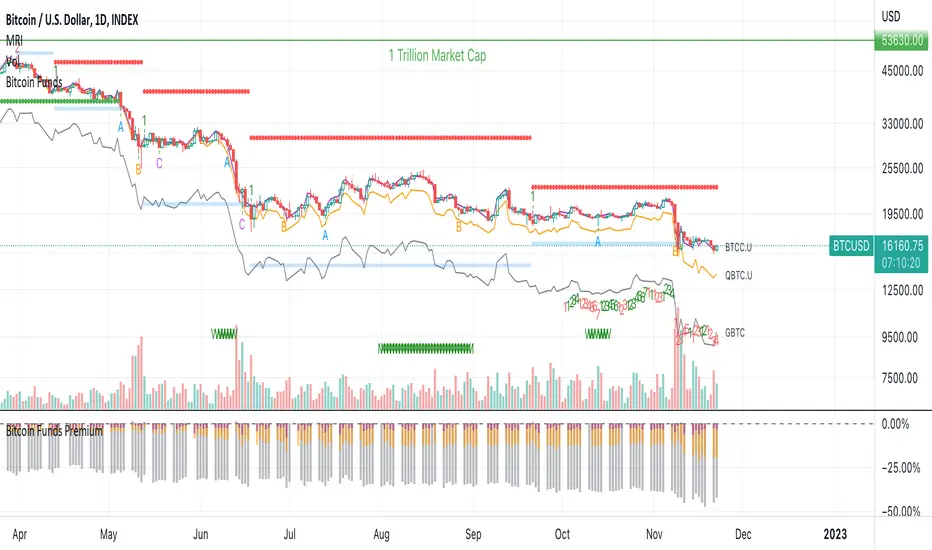
Bitcoin Funds OverlayOverlay the Net Asset Value per Unit (NAVPU) of 4 different Bitcoin Funds on your Bitcoin chart.
BTCC ETF
QBTC Fund
GBTC Trust
VBTC ETN
This indicator uses the metrics from the fund management websites to calculate the "Net Asset Value per Unit (NAVPU)" to display the true underlying value of the fund.
Note that the metrics can change and therefore the graph is not accurate for long past timeframes.
You can update the metrics for each fund in the settings dialogue.
The script will autodetect the currency pairs of your current graph and only display compatible funds:
BTC / USD will show BTCC.U, QBTC.U and GBTC
BTC / CAD will show BTCC and QBTC
BTC / EUR will show VBTC
The script should not show in other currency pairs so it will not mess up other charts you might switch to.
If you find bugs with this logic, please comment below so I can fix them.
Due to TradingViews "no-links in description" policy, you need to google each funds website yourself to find the current metrics. These search terms should help:
BTCC search "Purpose Bitcoin ETF"
QBTC search "3iq The Bitcoin Fund (QBTC)"
GBTC search "Grayscale® Bitcoin Trust"
VBTC search "VanEck Vectors Bitcoin ETN"

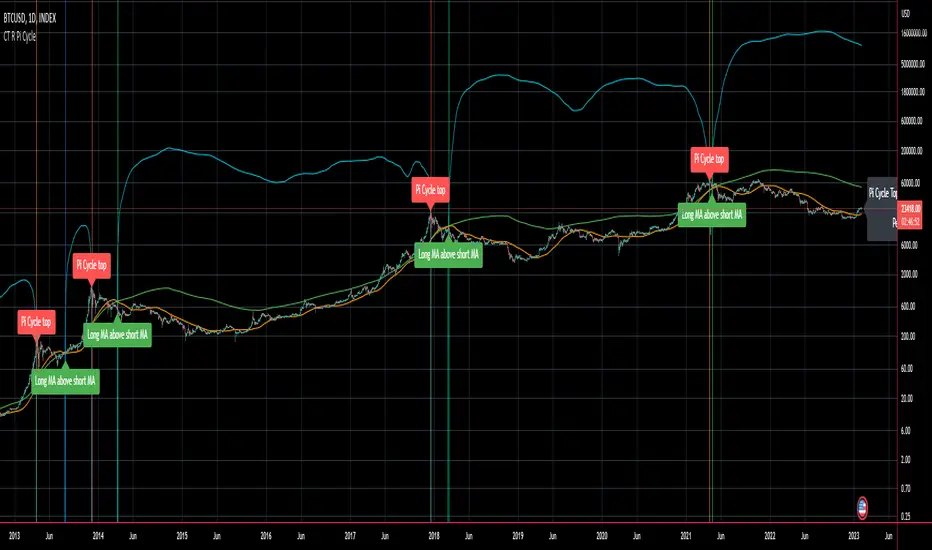
CT Reverse Pi Cycle Bitcoin Top IndicatorIntroducing the Reverse BTC Pi Market Cycle Top indicator
Much respect to Philip Swift the original creator of this idea and big thanks to Tradingview author Ninorigo for sharing the script which this indicator is based on.
Philip Swift has noted that:
Using the x2 multiple of the 350 day moving average along with the 111 day moving average provides an interesting market cycle indicator.
Over the past three market cycles, when the 350DMA x2 crosses below the 111DMA, Bitcoin price peaks in its market cycle, this has been accurate to within three days of Bitcoin price topping out.
Here I have modified an existing script by Tradingview author @Ninorigo which shows the moving averages and gives signals upon crossover by adding the following features:
A function which shows the price at which the 350DMA will Cross Below the 111DMA.
(This is calculated from the prior bar closing data and does not repaint)
An “anticipated cross” function which may give a 1 bar advanced warning of a cross.
(this is calculated from current bar values and may change and repaint)
The crossover levels are shown in an info label to the right of the current price.
When there is a BTC Pi Market Cycle Top anticipated cross on the next bar there will be an orange background signal.
When there is an actual BTC Pi Market Cycle Top cross there will be a red background signal
When there is an anticipated cross back there will be a blue background signal
When there is an actual cross back there will be a green background signal
This indicator will show the appropriate moving averages and crossover information from the daily timeframe regardless of the timeframe you are using.
This should be helpful in more accurately identifying the price level where the Pi Market Cycle moving averages will cross denoting a possible market cycle top.
It is interesting to note:
350 / 111 = 3.153
Which is the closest we can get to Pi when dividing 350 by another whole number.
This is a script to give another view and metric on an interesting experimental idea. This is not financial advice.
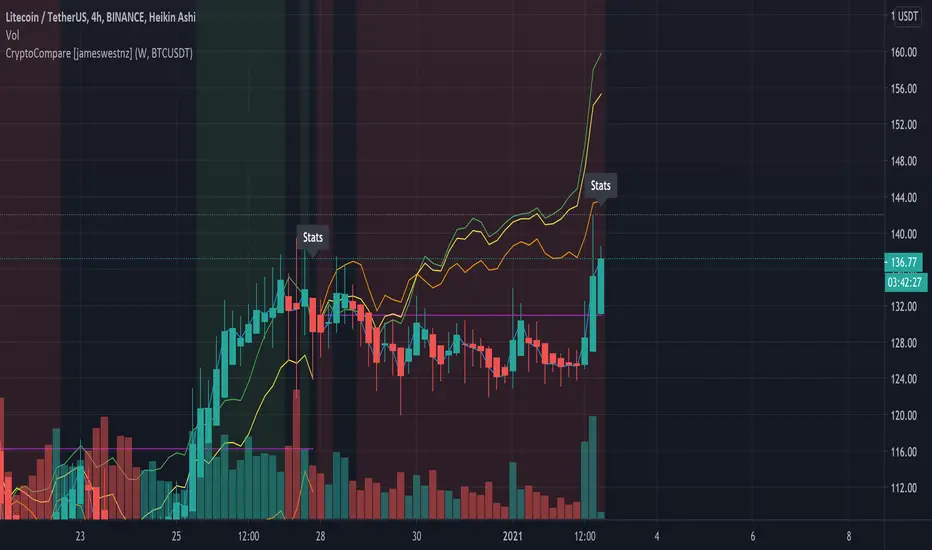
CryptoCompare [jameswestnz]Compares current ticker to the relative price of BTC, crypto total market cap (TOTAL), and crypto total market cap excluding BTC (TOTAL2) over the chosen time period.
e.g. compares what the relative price of BTC would have been based on it's percentage gains against LTC if you had invested in each at the start of the chosen period.
WholvolTotal Volume Of Crypto Pairs Based on TV Top Exchanges
See the whole volume with additional feature and options.
Report volume data in USD, BTC, itSelf.
See each exchange Share and Volume.
Static and Dynamic value filtering.
MAs crosses.
Note.1
Due to the pine limitations, we have selected the most important Exchanges which have valuable volume.
Note.2
When you choose to report stats in BTC unit and you have chart of altcoins, the BTC source price will extract from your pair exchange.
Note.3
When you choose to report stats in USD unit, Historical volume data worth will calculated using your entered source price BUT on Realtime data, script will use latest price(close) as source price.
Note.4
You must only select the exchanges which support your pair, otherwise you will see error.

Alt Season IndicatorThis indicator is a traffic light system to determine the nature of the crypto markets with 4 colour outputs
Colour 1 : Long BTC to USD
Colour 2 : Long Alts to USD (Alt Season)
Colour 3 : Short Alts to USD
Colour 4 : Short BTC to USD
The underlying calculations are based on the BTCUSD 20SMA Daily and the BTC Dominance 20 SMA Daily

Risk Metrics: Crypto VersionRisk Metrics for Crypto.
Market can be set to BTCUSD, BTCEUR, BTCCHF, BTCGBP, BTC1!, BTC2!, SPX, and DTB3
Beta
Correlation
Standard Deviation
Variance
R-squared

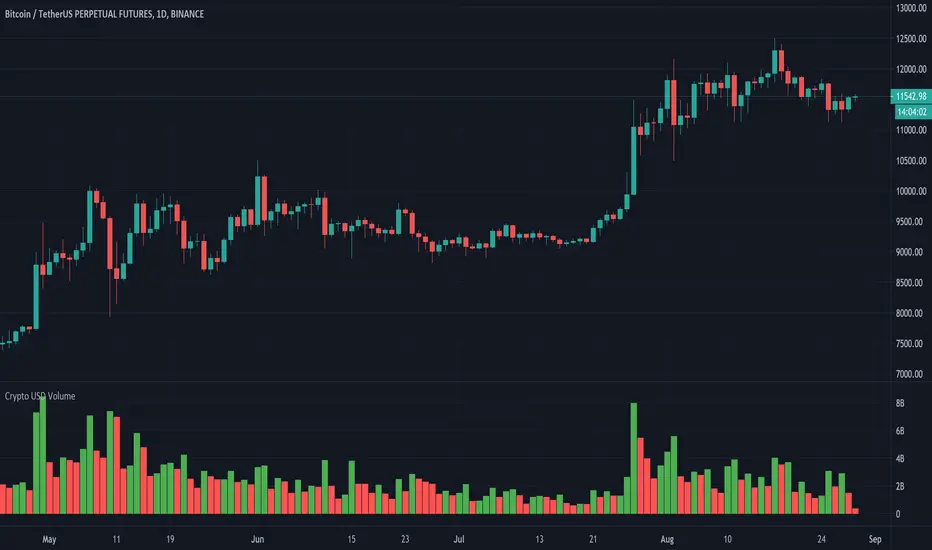
Crypto USD VolumeOften times I need to check the volume in cryptocurrency exchanges and I find myself checking which type of volume I am looking at, I need to manually make sense what the data is and converting it into USD volume which I end up going to CoinMarketCap website to verify whether my calculation is right.
Today I thought it was about time I created an automatic way to find the volume in USD Dollars. This is what this script does.
1 - It removes the base currency from the symbol (e.g., "BTCUSD", it would remove "BTC", leaving us with the "USD" part.). This is important because it helps us identify the currency the pair uses.
2 - It has different pair's variables, each is given a specific currency that the final volume is calculated from. (BTC, ETH, BNB and USD are the default currencies, for other ones, it must be added manually).
This works with all crypto symbols that include BTC, ETH, BNB and USD as currencies. If you modify it, please make sure to compare data with the exchange's one.
Simple Momentum Strategy Based on SMA, EMA and VolumeA simple, non short selling (long positions only, i.e. buy low and sell high) strategy. Strategy makes use of simple SMA, EMA and Volume indicators to attempt to enter the market at the most optimum time (i.e. when momentum and price are moving upwards). Optimum time is defined mainly by picking best timing for price moves higher based on upwards momentum.
This script is targeted / meant for an average/typical trader or investor. This is why a non short selling approach was selected for optimisation for this strategy because "typpical", "average" traders and investors usually use basic (i.e. minimum fees / free membership) exchanges that would not usually offer short selling functionality (at least without additional fees). The assumption used here is that only advanced and sophisticated traders and investors would pay for advanced trading platforms that enable short selling, have a risk appetite for short selling and thus use short selling as a strategy.
The results of the strategy are:
In an overall roughly bearish market (backward testing from beginning to end of 2018) i.e. the market immediately following the highs of around 20k USD per BTC, this strategy made a loss of £3231 USD on trades of a maximum of 1 BTC per long position.
But in an overall bullish market, it makes a profit of about $6800 USD from beginning of 2019 onwards by trading a maximum of 1 BTC per long position.
NOTE: All trading involves high risk. Most strategies use past performance and behaviour as indicators of future performance and that is not necessarily indicative of future results. Hypothetical or simulated performance results have certain inherent limitations too. One limitation is that unlike an actual performance record, simulated results do not represent actual trading and since the trades have not actually been executed, the results of those trades themselves do not have any influence on actual market results, which in real life they would have had (no matter how minor). Additionally, simulated results may have under or over-compensated for the impact, if any, of certain market factors, such as lack of liquidity. Simulated trading programs in general are also, by their nature, designed with the benefit of hindsight. No representation is being made that any account will or is likely to achieve profits or losses similar to those shown.

inwCoin Average Position Price Calculator - For CryptocurrencyEver wonder what is my average entry ?
No need to use excel.
Just use this simple indicator to calculate average entry of your multiple positions.
How to use
--------------
1) Just input your entries into each box. ( Buy price + buy amount )
2) If you don't want to use any input, just uncheck the checkbox.
How to read value
----------------------
- This indicator will calculate the asset amount you got when you purchase it, by asset amount = entry amount / entry price ( Eg. buy BTC at 10,000$ per BTC with 1,000 USD = 1000/10000 = 0.1 BTC )
- It will calculate your current value of the asset you holding and compare it with all of the money you already invested. Also the profit/loss.
- It will show the average entry price with the green line on the chart and in the textbox.

Godmode 4.0.0 [Oscillator]First off, a huge thank you to the following people:
LEGION:
LazyBear: www.tradingview.com
xSilas: www.tradingview.com
Ni6HTH4awK: www.tradingview.com
sco77m4r7and:
SNOW_CITY: www.tradingview.com
oh92: www.tradingview.com
alexgrover: www.tradingview.com
cI8DH: www.tradingview.com
DonovanWall: www.tradingview.com
Since I've been on TradingView I've become somewhat enthralled by Godmode and the collective work that goes in to it, so I decided to publish my own iteration, building off the ideas already present. (This is a great way to get familiar with Pine by the way, just in case there are any beginners reading this)
Changes
The first change I made was to allow the user to select whatever tickerid they wanted as a benchmark. If trading XBTUSD on BitMEX for example, the indicator will react to exchange-specific activity, which means it will respond to all the little whipsaws, whipsaws that can be especially present on a futures exchange. By typing CRYPTOCAP:BTC or CRYPTOCAP:TOTAL we endeavor to remove noise. It can also signal earlier. Less noise and less lag. Another idea would be to choose a benchmark that has a strong inverse relationship with the asset you're trading: try CRYPTOCAP:USDT as the benchmark against BTC to see what I mean.
I also added the ability to smooth the plot, yet again removing noise but adding considerable lag.
The linear regression of the wave-trend is calculated in place of the EMA. This is plotted as columns with the midline (50) as the base. This is just calculating the slope of the wave-trend and can signal a weakening trend before a reversal takes place.
Using cI8DH's True RSI script () as inspiration, I added a function for calculating the True TSI in an attempt to remove any bullish bias. Funnily enough, when I tried to do the same with the RSI I had some problems. I'll try to resolve this in the coming weeks.
Made slight changes to the aesthetics. Tried to bring the two main plots alive by making their bold, opaque colors stand off the subtle tones in the background.
To Do List
1. I would like to sort out the issue with the True RSI.
2. When the plots are smoothed, there's an issue with the green 'Caution!' dots appearing in the lower half of the indicator.
3. I'd like to adjust the code so that if the 'Benchmark' box is empty, that it will automatically register the current tickerid as the 'Benchmark'.
If anyone has any suggestions on other fixes or how to apply the fixes mentioned by me, please don't hesitate to reach out to me here or through other media platforms.
Want to Learn?
If you'd like the opportunity to learn Pine but you have difficulty finding resources to guide you, take a look at this rudimentary list: docs.google.com
The list will be updated in the future as more people share the resources that have helped, or continue to help, them. Follow me on Twitter to keep up-to-date with the growing list of resources.
Suggestions or Questions?
Don't even kinda hesitate to forward them to me. My (metaphorical) door is always open.
BITMEX:XBTUSD
CRYPTOCAP:BTC
CRYPTOCAP:TOTAL
CRYPTOCAP:USDT.D

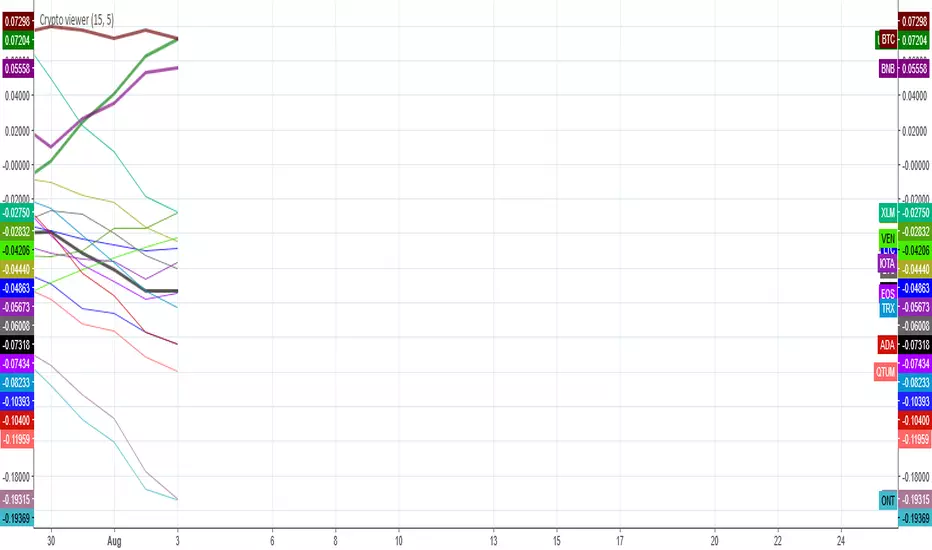
Crypto MeasurerI'm proud to finally announce the Crypto measurer!!!, 20 coins chosen from the selection available at Binance, you're free to modify the code to add your own coins or remove them or if you use another exchange.
This works similar to the SCSM, except it's for cryptos, never miss a PUMP & DUMP scheme again, don't get tricked into buying the losing coins anymore. The stronger coins are at the top while the losing coins at the bottom, works on any TF too, but be careful of volatility in lower TFs.
This picture is only of ETH and BTC, see how ethereum rallies in mid april until mid may, then bitcoin becomes the more dominating coin and remains like that, pushing ETH/BTC lower.
Again, here it's the chart for ETH and BNB, with the corresponding comparison.
And here is LTC/BTC to finish the comparisons.
Noro's Trend MAs Strategy v2.3Don't use on pairs of type "crypto/crypto"!
Only for pairs like "crypto/fiat" ("BTC/USD", "BTC/CNY", "ETH/USD", "ETH/CNY", etc)
Trade strategy which uses only 2 MA.
The slow MA (blue) is used for definition of a trend
The fast MA (red) is used for an entrance to the transaction
For:
- For H1
- For crypto/fiat
- Good for "BTC/USD", "ETH/USD"
Recomended:
Long = true (if it is profitable as a result of backtests)
Short = true (if it is profitable as a result of backtests)
Stops = false
Stop, % = any
Use Fast MA = true
Fast MA Period = 5
Slow MA Period = 21
Bars Q = (2 for "bitcoin/fiat" or 1 for "crypto/fiat")
Extreme = true (if "crypto/fiat")
In the new version 2.3
+ Dates

Noro's Trend MAs Strategy v2.0Don't use on pairs of type "crypto/crypto"!
Only for pairs like "crypto/fiat" ("BTC/USD", "BTC/CNY", "ETH/USD", "ETH/CNY", etc)
Trade strategy which uses only 2 MA.
The slow MA (blue) is used for definition of a trend
The fast MA (red) is used for an entrance to the transaction
For:
- For H1
- For crypto/fiat
- Good for "BTC/USD", "ETH/USD"
Recomended:
Long = true (if it is profitable as a result of backtests)
Short = true (if it is profitable as a result of backtests)
Stops = false
Stop, % = any
OHLC4 = any
Use Fast MA = true
Fast MA Period = 5
Slow MA Period = 21
Bars Q = (2 for "bitcoin/fiat" or 1 for "crypto/fiat")
Extreme = true (if "crypto/fiat")
In the new version 2.0
- CryptoBottom is added

Noro's Trend MAs Strategy v1.9 ExtremeExtreme version of Noro's Trend MAs strategy.
Don't use on pairs of type "crypto/crypto"!
Only for pairs like "crypto/fiat" ("BTC/USD", "BTC/CNY", "ETH/USD", "ETH/CNY", etc)
Trade strategy which uses only 2 MA.
The slow MA (blue) is used for definition of a trend
The fast MA (red) is used for an entrance to the transaction
For:
- For H1
- For crypto/fiat
- Good for "BTC/USD", "ETH/USD"
Recomended:
Long = true (if it is profitable as a result of backtests)
Short = true (if it is profitable as a result of backtests)
Stops = false
Stop, % = any
OHLC4 = any
Use Fast MA = true
Fast MA Period = 5
Slow MA Period = 21
Bars Q = (2 for "bitcoin/fiat" or 1 for "crypto/fiat")
Extreme = true (if "crypto/fiat")
In the new version 1.9
- Extreme is added

FOR CRT SMT – 4 CANDLEFOR CRT SMT – 4 CANDLE Indicator
This indicator detects SMT (Smart Money Technique) divergence by comparing the last 4 candle highs and lows of two different assets.
Originally designed for BTC–ETH comparison, but it works on any market, including Forex pairs.
You can open EURUSD on the chart and select GBPUSD from the settings, and the indicator will detect SMT divergence between EUR and GBP the same way it does between BTC and ETH. This makes it useful for analyzing correlated markets across crypto, forex, and more.
🔴 Upper SMT (Bearish Divergence – Red)
Occurs when:
The main chart asset makes a higher high,
The comparison asset makes a lower high.
This may signal a liquidity grab and potential reversal.
🟢 Lower SMT (Bullish Divergence – Green)
Occurs when:
The main chart asset makes a lower low,
The comparison asset makes a higher low.
This may indicate the market is sweeping liquidity before reversing upward.
📌 Features
Uses the last 4 candles of both assets.
Automatically draws divergence lines.
Shows clear “SMT ↑” or “SMT ↓” labels.
Works on Crypto, Forex, and all correlated assets.

Global Liquidity Index LITEGlobal Liquidity Index (GLI LITE) is an indicator that measures global liquidity by combining the balance sheets of major central banks (FED, ECB, PBOC, BOJ) and the M2 money supply of the world’s largest economies (USA, Europe, China, Japan).
Since liquidity directly influences the price of risk assets (BTC, NASDAQ, SPX, etc.), GLI is one of the most important macro signals for identifying market bull/bear regimes.
What the indicator shows:
GLI momentum line (green = liquidity expansion, orange = contraction)
Fast & Slow MA lines that define the liquidity trend
Bull/Bear background coloring
Green → global liquidity is expanding
Red → liquidity is tightening
Correlation between GLI and the asset price (e.g., BTC)
Macro trend panel (Bull / Bear / Neutral)
How to use the indicator:
Bull regime (Fast MA > Slow MA)
Liquidity is expanding and the market has a natural tailwind. Risk assets tend to perform better.
Bear regime (Fast MA < Slow MA)
Liquidity is tightening — higher risk, increased volatility, and more downside pressure.
GLI ↔ Price Correlation
If correlation is high (e.g., > 0.6), GLI can be an excellent leading indicator for price movement.

Crypto Anchored VWAP (Swing High/Low)Crypto Anchored VWAP (Swing High/Low)
This indicator provides an automatic Anchored VWAP system designed specifically for highly volatile assets such as cryptocurrencies (ETH, BTC, SOL, etc.).
Unlike traditional AVWAP tools that require manual date input, this script automatically anchors VWAP to the most recent swing high and swing low, making it ideal for real-time trend tracking and intraday/4H structure analysis.
How It Works
The script detects local swing lows and swing highs based on user-defined swing length.
When a new swing point appears, an Anchored VWAP is initialized from that specific candle.
As price evolves, the AVWAP dynamically becomes:
A trend boundary
A fair-value line
A mean-reversion attractor
Traders can use these levels to identify:
Trend continuation
Breakout confirmation
Mean reversion pullbacks
Overextended expansions
Included Features
✔ Auto-Anchored VWAP from swing low
✔ Auto-Anchored VWAP from swing high
✔ Standard deviation bands (1σ) for volatility context
✔ Designed for Crypto 4H / 1H / 15m
✔ Works on any asset & any timeframe
How To Use
1. Trend Direction
Price above Swing-Low VWAP → Bullish bias
Price below Swing-High VWAP → Bearish bias
2. Trade Setups
Break → Retest → Hold above AVWAP = Trend continuation long
Reject from AVWAP / σ band = Mean-reversion short setup
AVWAP zone → High probability liquidity reaction
3. Volatility Bands
Price touching +1σ = extension
Price returning to 0σ = mean reversion
Price breaking −1σ = trend weakening
Inputs
Swing Length: determines sensitivity of swing high/low detection
(Default: 5)
Best Use Cases
ETH 4H trend following
BTC structure shifts
Altcoin volatility filtering
Identifying institutional "cost basis" zones
Confirming breakouts / fakeouts
Notes
This is not a trading system by itself but a structural tool meant to help traders understand trend and value location. Always combine AVWAP with market structure, volume, and risk management.
Disclaimer
This script is for educational and informational purposes only. It does not constitute financial advice or a recommendation to buy or sell any asset. Use at your own discretion.

Grok/Claude Quantum Signal Pro * Enhanced v2# QSig Pro+ v2 — Dynamic RSI Enhancement
## Release: Quantum Signal Pro Enhanced v2
**Author:** ralis24 (with Claude assistance)
**Version:** 2.0
**Platform:** TradingView (Pine Script v6)
---
## Overview
Version 2 introduces **Trend-Adaptive RSI Thresholds** — a significant enhancement that dynamically adjusts buy and sell levels based on real-time trend strength. This allows the indicator to more effectively capture dips in uptrends and sell bounces in downtrends, rather than waiting for extreme oversold/overbought conditions that rarely occur during strong directional moves.
---
## The Problem v2 Solves
In the original QSig Pro+, RSI thresholds were fixed at 30 (oversold) and 70 (overbought). While these levels work well in ranging markets, they create issues in trending conditions:
- **Strong Uptrends:** Price rarely drops to RSI 30. Pullbacks typically bottom around RSI 40-50, causing missed buy opportunities.
- **Strong Downtrends:** Relief rallies rarely push RSI above 70. Bounces often exhaust around RSI 55-65, causing missed sell opportunities.
The v2 solution: **Let the market's trend strength dictate the appropriate RSI levels.**
---
## New Feature: Dynamic RSI Thresholds
### How It Works
The indicator now detects three distinct market states and applies corresponding RSI thresholds:
| Market State | Detection Criteria | RSI Buy Level | RSI Sell Level |
|--------------|-------------------|---------------|----------------|
| **Strong Uptrend** | +DI > -DI, ADX > 24, ADX rising | < 40 | > 80 |
| **Strong Downtrend** | -DI > +DI, ADX > 24, ADX rising | < 20 | > 60 |
| **Neutral/Ranging** | ADX < 24 or ADX falling | < 30 | > 70 |
### Trend State Detection Logic
```
Strong Uptrend = (+DI > -DI) AND (ADX > threshold) AND (ADX > ADX )
Strong Downtrend = (-DI > +DI) AND (ADX > threshold) AND (ADX > ADX )
Neutral = Neither condition met
```
### Anti-Whipsaw Protection
To prevent rapid switching between threshold sets during choppy transitions, a **confirmation buffer** requires the trend state to persist for a configurable number of bars (default: 2) before the indicator switches regimes.
---
## New Input Parameters
A new input group "**Dynamic RSI Thresholds**" has been added with the following settings:
| Parameter | Default | Range | Description |
|-----------|---------|-------|-------------|
| Enable Trend-Adaptive RSI Levels | ON | toggle | Master switch for the feature |
| ADX Strong Trend Threshold | 24 | 15-40 | ADX must exceed this to qualify as "strong" trend |
| ADX Rising Lookback (bars) | 3 | 1-10 | ADX must be higher than N bars ago to confirm rising |
| Trend Confirmation Bars | 2 | 1-5 | Bars trend must persist before switching thresholds |
| RSI Buy Level (Strong Uptrend) | 40 | 30-55 | Oversold threshold during confirmed uptrends |
| RSI Sell Level (Strong Uptrend) | 80 | 70-90 | Overbought threshold during confirmed uptrends |
| RSI Buy Level (Strong Downtrend) | 20 | 10-30 | Oversold threshold during confirmed downtrends |
| RSI Sell Level (Strong Downtrend) | 60 | 50-70 | Overbought threshold during confirmed downtrends |
| RSI Buy Level (Neutral/Ranging) | 30 | 20-40 | Standard oversold threshold |
| RSI Sell Level (Neutral/Ranging) | 70 | 60-80 | Standard overbought threshold |
---
## Enhanced Info Panel
The information panel now displays two new rows:
1. **Trend State** — Shows current regime: "STRONG UP" (green), "STRONG DOWN" (red), or "NEUTRAL" (gray)
2. **RSI Levels** — Displays the currently active thresholds (e.g., "40 / 80" during uptrends)
Additionally, the **ADX row** now includes a directional arrow (↑ or ↓) indicating whether ADX is rising or falling.
---
## Enhanced Signal Labels
Buy and sell labels on the chart now include contextual information:
**Before (v1):**
```
BUY: 97,234.50
```
**After (v2):**
```
BUY: 97,234.50
STRONG UP | RSI<40
```
This provides immediate visual confirmation of which threshold regime triggered the signal.
---
## Enhanced Alert System
### New Alert Conditions
Three new alerts have been added for trend state changes:
- **🔼 Strong Uptrend Started** — Fires when market transitions to strong uptrend (thresholds shift to 40/80)
- **🔽 Strong Downtrend Started** — Fires when market transitions to strong downtrend (thresholds shift to 20/60)
- **⚖️ Trend Neutralized** — Fires when trend weakens and thresholds reset to 30/70
### Enhanced Webhook JSON
The JSON alert payload now includes additional fields for bot integration:
```json
{
"action": "BUY",
"symbol": "BTC/USDT",
"price": "97234.50",
"rsi": "38.5",
"rsi_threshold": "40",
"adx": "28.3",
"fisher": "-1.87",
"trend_state": "STRONG UP"
}
```
---
## Bonus Enhancement: Dynamic Fisher Thresholds
As an additional refinement, the Fisher Transform thresholds now adjust slightly based on trend state:
| Trend State | Fisher Buy Level | Fisher Sell Level |
|-------------|------------------|-------------------|
| Strong Uptrend | -1.5 (loosened) | -2.0 (standard) |
| Strong Downtrend | -2.0 (standard) | +1.5 (loosened) |
| Neutral | -2.0 (standard) | +2.0 (standard) |
This allows the indicator to trigger signals in strong trends where momentum oscillators rarely reach extreme levels.
---
## Practical Trading Impact
### Strong Uptrend Example (BTC rally)
- **Before:** Waiting for RSI < 30 means missing most pullback entries
- **After:** RSI < 40 triggers buy signals on normal pullbacks within the trend
### Strong Downtrend Example (Bear market bounce)
- **Before:** Waiting for RSI > 70 means holding through entire relief rallies
- **After:** RSI > 60 triggers sell signals on bounce exhaustion
### Ranging Market
- Thresholds remain at traditional 30/70 levels where mean reversion works best
---
## Backward Compatibility
The dynamic RSI feature can be completely disabled by turning off "Enable Trend-Adaptive RSI Levels" in the settings. When disabled, the indicator behaves identically to v1 using the neutral threshold values (30/70).
---
## Summary of Changes
| Component | v1 | v2 |
|-----------|----|----|
| RSI Thresholds | Fixed 30/70 | Dynamic based on trend state |
| Trend State Detection | Not present | +DI/-DI + ADX + Rising confirmation |
| Whipsaw Protection | Not present | Configurable confirmation bars |
| Info Panel Rows | 10 | 12 (added Trend State, RSI Levels) |
| ADX Display | Value only | Value + direction arrow |
| Signal Labels | Price only | Price + Trend State + Threshold |
| Alert Conditions | 10 | 13 (added 3 trend state alerts) |
| Webhook Fields | 5 | 7 (added rsi_threshold, trend_state) |
| Fisher Thresholds | Fixed | Adaptive (subtle adjustment) |
---
## Recommended Settings by Market Type
### Crypto (High Volatility)
- ADX Strong Trend Threshold: 24
- RSI Buy (Uptrend): 40-45
- RSI Sell (Downtrend): 55-60
### Forex (Medium Volatility)
- ADX Strong Trend Threshold: 22
- RSI Buy (Uptrend): 38-42
- RSI Sell (Downtrend): 58-62
### Stocks/Indices (Lower Volatility)
- ADX Strong Trend Threshold: 20
- RSI Buy (Uptrend): 35-40
- RSI Sell (Downtrend): 60-65
---
## Installation
1. Open TradingView and navigate to Pine Editor
2. Remove or rename existing QSig Pro+ indicator
3. Paste the complete v2 code
4. Click "Add to Chart"
5. Configure Dynamic RSI Thresholds in settings as desired
---
*QSig Pro+ v2 — Smarter entries through trend-aware signal generation*
