Candlestick High/Low Labels📌 Indicator Name:
Candlestick High/Low Labels
🧠 Author:
Precious Life Dynamics (@Precious_Life)
📋 Description:
The Candlestick High/Low Labels indicator highlights recent price extremes by placing labels above highs and below lows of previous candles.
Additionally, it displays a live OHLCV dashboard in the bottom-right corner, offering a quick overview of recent market data.
This tool is especially useful for:
Identifying support/resistance levels
Tracking candle behavior
Visualizing volume trends in context
⚙️ How It Works:
🔸 High/Low Labels:
Each of the most recent candles (based on Candle Lookback) is annotated as follows:
🔹 Red label above each candle’s high
🔹 Green label below each candle’s low
🔹 Price values are rounded (no decimals)
🔹 Labels are dynamically updated; old ones are removed
🔹 Label visibility can be toggled via the Show Labels input
🔸 OHLCV Dashboard:
A real-time data table appears in the bottom-right corner of the chart.
It displays the last N candles (based on Dashboard Lookback) with the following fields:
🔹 Candle Number (1 = most recent)
🔹 Open, High, Low, Close
🔹 Volume
🔹 Values are rounded for readability
🔹 White background with black text ensures high visual clarity
🔧 Customizable Inputs:
✅ Candle Lookback → Number of candles to label (default: 10)
✅ Show Labels → Toggle High/Low label display on/off
✅ Dashboard Lookback → Number of candles shown in the OHLCV table (default: 10)
🎯 Use Cases:
🔹 Identify recent price extremes and reaction zones
🔹 Spot dynamic support and resistance levels
🔹 Observe how candles behave at swing highs/lows
🔹 Monitor volume activity in relation to price
🔹 Use as a clean visual tool for scalping and intraday trading
📝 Notes:
🔹 This indicator is purely visual – it does not generate trade signals
🔹 Best suited for traders who value clear, real-time price structure feedback
Tìm kiếm tập lệnh với "candle"

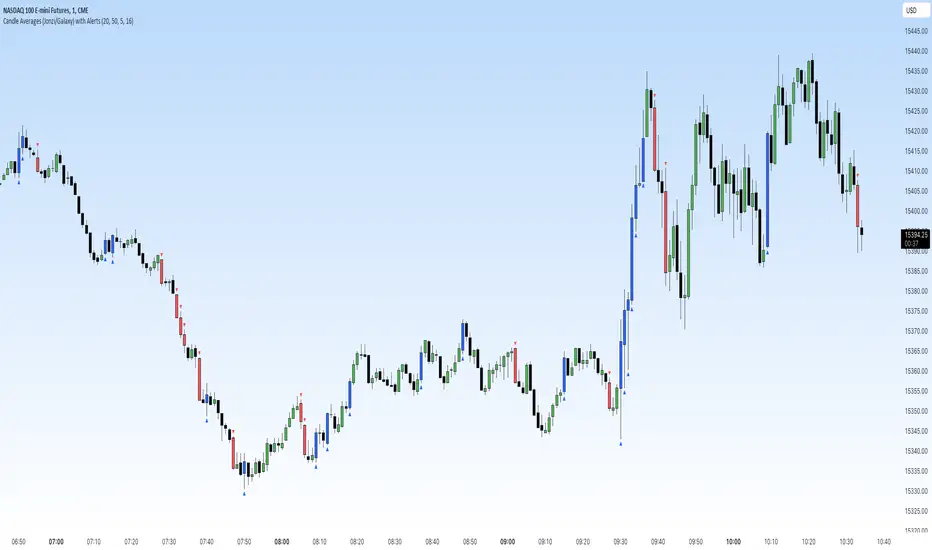
Candle Averages (Jonzi/Galaxy) with AlertsThis indicator is used to highlight outlying candles.
Our script takes the average of the trailing candles and then highlights and/or places a symbol at the candles outside the average.
Example: Your settings use the previous 20 candles and combine the range of each candle.
Divide by 20 and get the average. Let's assume the average is $10
Now if you have your settings at highlighting candles 50% larger than the average, once a candle gets to $15, the indicator would trigger the candle to be highlighted and/or place a symbol of your choice.
In case you don't want to pay attention to the consolidation, you can use the alerts feature. Just go on the timeframe you'd like to be notified on, set an alert for either a down close or up close trigger.
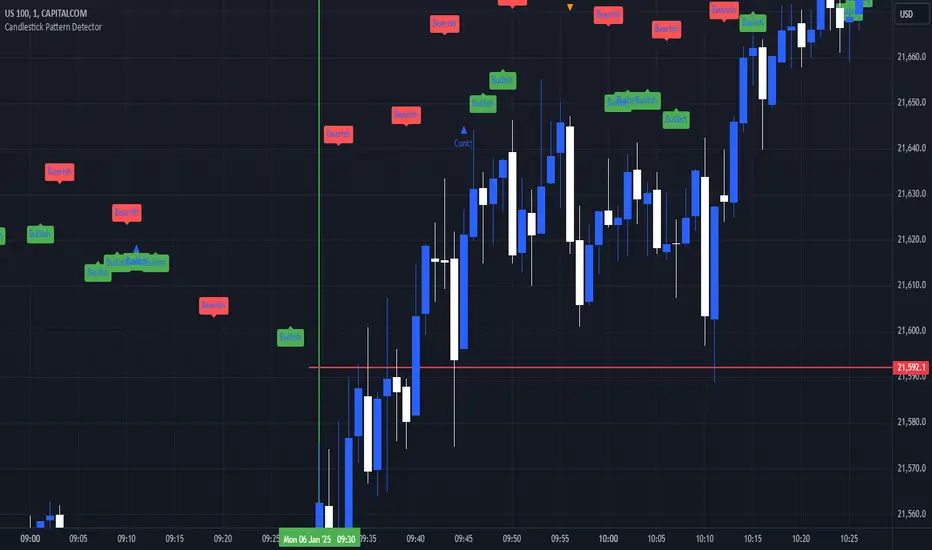
Candlestick Pattern DetectorFeatures
Reversal Patterns:
Bullish Patterns:
Bullish Engulfing: A strong reversal signal when a bullish candle completely engulfs the previous bearish candle.
Hammer: Indicates a potential bottom reversal with a small body and a long lower wick.
Morning Star: A three-candle pattern signaling a transition from a downtrend to an uptrend.
Bearish Patterns:
Bearish Engulfing: A bearish candle fully engulfs the prior bullish candle, indicating a potential downtrend.
Shooting Star: A potential top reversal with a small body and a long upper wick.
Evening Star: A three-candle pattern signaling a shift from an uptrend to a downtrend.
Continuation Patterns:
Bullish Continuation:
Rising Three Methods: A consolidation pattern within an uptrend, indicating the trend is likely to continue.
Bearish Continuation:
Falling Three Methods: A consolidation pattern within a downtrend, suggesting further downside movement.
Visual Highlights:
Bullish Reversal Patterns: Labeled below candles with a green "Bullish" marker.
Bearish Reversal Patterns: Labeled above candles with a red "Bearish" marker.
Bullish Continuation Patterns: Displayed as blue triangles pointing upward.
Bearish Continuation Patterns: Displayed as orange triangles pointing downward.
Real-Time Alerts:
Get notified when a specific candlestick pattern is detected, enabling you to act quickly in dynamic market conditions.
Candle Color RatioThe Candle Color Ratio indicator is designed to analyze the ratio of green (bullish) to red (bearish) candles over a specified lookback period. This ratio can offer insights into the prevailing market sentiment and potential trend reversals. The indicator calculates the number of green and red candles and provides two key metrics: the Green to Red Ratio and the Red to Green Ratio. Additionally, it allows users to set a threshold for these ratios to identify extreme sentiment conditions.
Calculations :
- Green Score and Red Score: The script first checks the color of the candles over a user-defined lookback period (up to 10 bars back). For each bar, it assesses whether the closing price is higher (green) or lower (red) than the opening price. The green and red scores are calculated by counting the number of green and red candles, respectively, within the lookback period.
- Green to Red Ratio: This metric is the ratio of the Green Score to the Red Score. It quantifies the relative prevalence of bullish candles compared to bearish candles within the specified lookback period. A higher Green to Red ratio indicates a stronger bullish sentiment.
- Red to Green Ratio: This metric is the inverse of the Green to Red Ratio. It calculates the relative prevalence of bearish candles compared to bullish candles within the lookback period. A higher Red to Green ratio indicates a stronger bearish sentiment.
Interpretation :
- Green Score and Red Score: These histograms display the raw counts of green and red candles within the lookback period. Traders can use these histograms to observe the recent distribution of bullish and bearish candles.
- Green to Red Ratio: This line graph represents the ratio of bullish candles to bearish candles. When this ratio is above 1, it indicates a predominantly bullish sentiment, suggesting potential upward momentum. Conversely, when it's below 1, it signifies a bearish sentiment, suggesting potential downward pressure.
- Red to Green Ratio: This line graph represents the inverse ratio, indicating the strength of bearish sentiment relative to bullish sentiment. Similar to Green to Red, values above 1 indicate a bearish bias, while values below 1 indicate a bullish bias.
- Ratio Threshold: The white horizontal line on the chart represents the user-defined threshold. Traders can set this threshold to identify extreme sentiment conditions. When either the Green to Red ratio or Red to Green ratio crosses the threshold, it may signal overbought (above threshold) or oversold (below threshold) market conditions.
Potential Applications:
- Trend Confirmation: Traders can use this indicator to confirm the prevailing trend. A strong GRratioScore may validate a bullish trend, while a strong RGratioScore may confirm a bearish trend.
Contrarian Signals: Extreme readings (crossing the threshold) can be interpreted as potential reversal points. For example, a very high GRratioScore followed by a crossover below the threshold might indicate an overbought market and a potential bearish reversal.
Divergence Analysis: Traders can analyze divergences between price movements and the indicator. If price makes higher highs while the indicator shows lower highs, it may signal a weakening bullish trend.
Limitations:
- Lookback Period: The indicator's effectiveness may vary depending on the selected lookback period. Longer periods smooth out fluctuations but may lag in capturing recent changes in sentiment.
- Threshold Sensitivity: The interpretation of extreme readings can be subjective. Traders should carefully select and adjust the threshold based on their trading strategy and market conditions.
- Lack of Context: This indicator solely focuses on candle color ratios and does not consider other factors like volume, market news, or fundamental analysis. It should be used in conjunction with other indicators and analysis techniques.
This indicator provides a simple yet valuable tool for assessing market sentiment and potential trend reversals based on candle color ratios. Traders can use this information to make informed trading decisions, but it's essential to consider its limitations and use it as part of a comprehensive trading strategy.

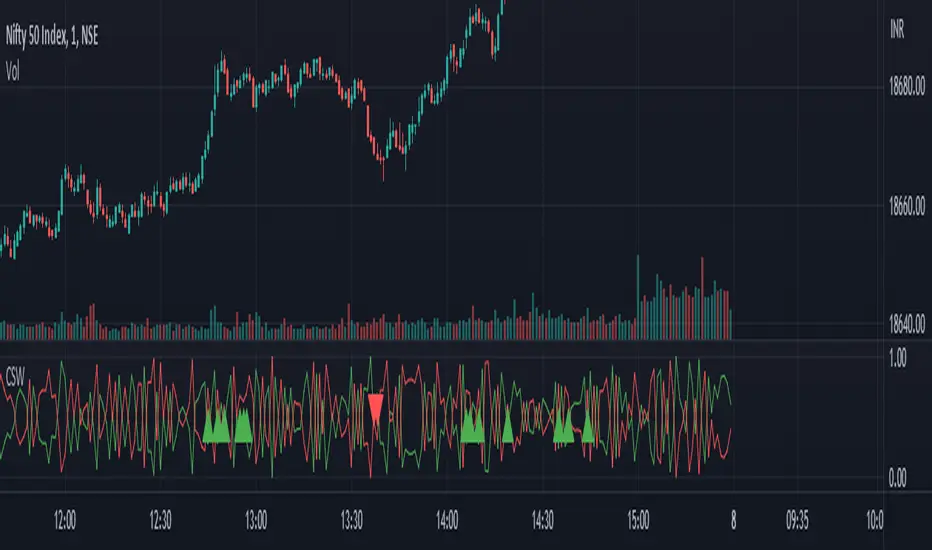
Candlestick Strength and Weakness with RSI and OBVThe "Candlestick Strength and Weakness with RSI and OBV" indicator, denoted as CSW, is a tool designed to assist traders in identifying potential trend reversals in financial markets. The CSW indicator combines the analysis of candlestick patterns, relative strength index (RSI), and on-balance volume (OBV) to provide traders with valuable insights into market dynamics.
The CSW indicator calculates the strength and weakness of each candlestick based on its open, close, high, and low prices. It considers the body range, upper shadow range, and lower shadow range of the candlestick to determine the distribution of strength and weakness within it. By quantifying the candlestick's strength and weakness, the indicator provides a visual representation of the balance between bullish and bearish forces in the market.
In addition to candlestick analysis, the CSW indicator incorporates RSI and OBV calculations to further validate potential trend reversals. The RSI is a widely-used momentum oscillator that measures the speed and change of price movements. The OBV, on the other hand, tracks the cumulative volume flow and helps identify periods of accumulation or distribution. By considering these indicators alongside candlestick strength and weakness, the CSW indicator enhances the accuracy of its signals.
To interpret the CSW indicator effectively, traders should consider the following:
Candlestick Strength and Weakness: The indicator plots two lines, "Candle Strength" and "Candle Weakness," representing the strength and weakness of each candlestick. The strength line indicates the bullish pressure, while the weakness line represents the bearish pressure.
Potential Reversal Signals: The CSW indicator identifies potential trend reversals based on the balance between candlestick strength and weakness, RSI readings, and OBV values. A bullish reversal signal occurs when the strength is higher than weakness, the RSI is below 30 (indicating oversold conditions), and the OBV is below its 20-period simple moving average (SMA). Conversely, a bearish reversal signal occurs when the weakness is higher than strength, the RSI is above 70 (indicating overbought conditions), and the OBV is above its 20-period SMA.
Trend Confirmation: The CSW indicator provides additional confirmation by comparing the closing price with the 20-period exponential moving average (EMA). If the closing price is above the EMA, it suggests an uptrend, while a closing price below the EMA indicates a downtrend.
Traders can add the indicator to their charts and customize its parameters based on their preferences. By monitoring the indicator's plots and observing the occurrence of potential reversal signals in alignment with the trend confirmation, traders can make informed decisions regarding entry or exit points in their trading strategies.
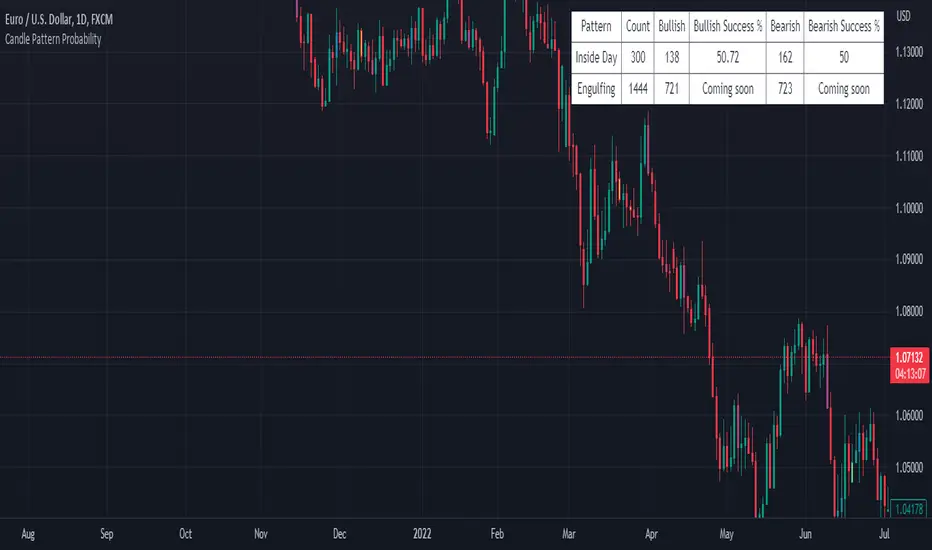
Candle Pattern ProbabilityThe "Candle Pattern Probability" indicator is a technical analysis tool designed specifically for traders who want to assess the probability of success for different candlestick patterns in the financial markets.
Japanese candlesticks, also known as candlesticks, provide valuable information about price action within a specific time period. These candlestick patterns can help identify potential trend reversals as well as signal entry and exit points in the market.
The "Candle Pattern Probability" indicator uses a data-driven approach to calculate the likelihood of a specific candlestick pattern resulting in a successful price movement. It operates on the premise that certain candlestick patterns tend to repeat and have a higher probability of leading to predictable market movements.
The indicator analyzes a wide variety of candlestick patterns such as the hammer, shooting star, bullish/bearish engulfing, doji, hanging man, among others. It employs specific statistics and algorithms to evaluate the frequency and effectiveness of these patterns in the past, thereby estimating the probability of their repetition in the future.
The indicator's output is visually presented as a percentage value or a color scale, facilitating interpretation by traders. The higher the percentage value or the more intensified the color, the greater the estimated probability of success for the analyzed candlestick pattern.
It is important to note that the "Candle Pattern Probability" indicator is a supplementary tool and should not be considered as a definitive signal for trading decisions. It is recommended to use it in conjunction with other technical indicators, fundamental analysis, and a sound understanding of the market before making trades.
Please remember that the analysis of candlestick patterns and the use of this indicator require practice, experience, and trading knowledge. It is always advisable to conduct additional testing and validation before basing decisions solely on the results provided by this indicator.
Candle Statistics | by beidou_123Script Description
Candle Statistics is a quantitative market analysis indicator that provides a structured statistical overview of recent price behavior using candlestick classification.
The script analyzes historical candles over four user-defined lookback periods and classifies each candle into one of three categories:
Bullish candles (close > open)
Bearish candles (close < open)
Doji candles , defined as candles whose real body is less than or equal to 10% of the total candle range
Key Features
Fully customizable lookback periods
Users can define four independent candle windows (e.g., 15, 60, 240, 480 bars).
Standardized Doji definition
A Doji is identified when the candle body is small relative to total price range, ensuring consistency across instruments and timeframes.
Directional dominance calculation
For each lookback period, the script computes the Bullish Percentage, defined as:
Bullish % = Bullish Candles ÷ (Bullish + Bearish Candles)
Doji candles are intentionally excluded from this calculation to avoid diluting directional bias.
Visual dominance highlighting
If Bullish % > 50%, the value is displayed using a user-defined bullish dominance color
If Bullish % ≤ 50%, the value is displayed using a user-defined bearish dominance color
On-chart statistics table
All results are presented in a compact, non-intrusive table displayed directly on the main chart.
Table position is fully configurable.
Intended Use
This indicator is designed for:
Market structure analysis
Trend bias evaluation
Volatility and indecision studies
Systematic filtering in discretionary or rule-based trading systems
It is not a signal generator, but a statistical context tool that helps traders assess whether recent price action is dominated by bullish pressure, bearish pressure, or indecision.
Disclaimer
This indicator is provided for educational and analytical purposes only and does not constitute financial or investment advice.

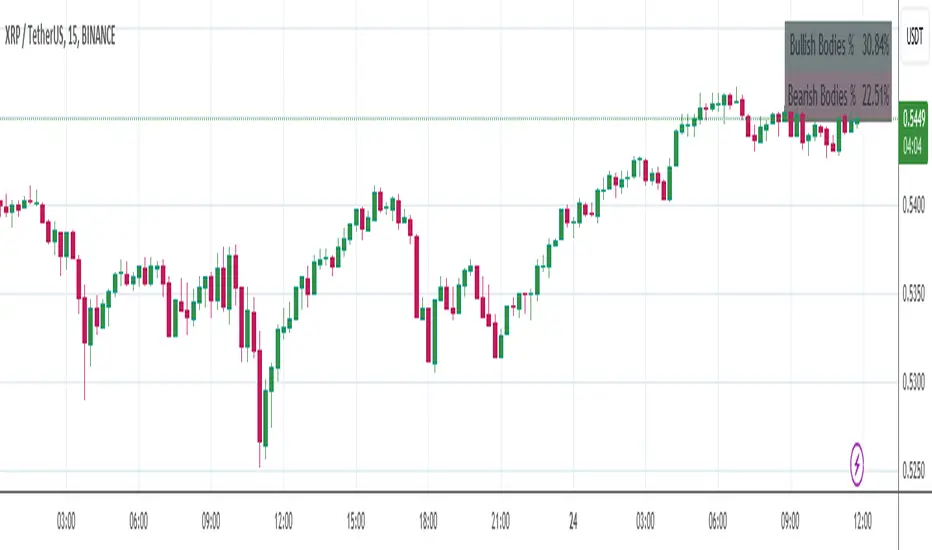
Candle Body Percentages TableThis script is designed as an analysis tool to visually represent the relative strength of bullish and bearish market sentiments over a specified number of candles. It calculates and displays the percentages of bullish and bearish "candle bodies" as part of the total price range observed in the chosen period.
Here's a breakdown of its functionalities:
User-Defined Period Analysis: Users can specify the number of candles they wish to analyze, allowing for flexible and dynamic examination of market trends over different time frames.
Bullish Body Percentage: The script calculates the combined length of all bullish candle bodies (where the closing price is higher than the opening price) within the selected range and expresses this total as a percentage of the combined price range of all candles analyzed.
Bearish Body Percentage: Similarly, it computes the aggregate length of all bearish candle bodies (where the closing price is lower than the opening price) and presents this sum as a percentage of the total price range.
Visual Representation: The results are displayed in a table format on the chart, providing an immediate visual summary of the prevailing market dynamics. The table shows the percentages of price movement dominated by bullish or bearish sentiment.
Market Sentiment Indicator: This tool can be particularly useful for traders and analysts looking to gauge market sentiment. High bullish body percentages might indicate strong buying pressure, while high bearish body percentages could suggest significant selling pressure.
Strategic Decision Making: By providing a clearer picture of market sentiment over a user-defined period, the script aids in making informed trading decisions, potentially enhancing trading strategies that are sensitive to trends and market momentum.
Candle DNA Rejection, Dominance & Confusion By Dany📌 Candle DNA – Rejection, Dominance & Confusion (Danish)
Indicator Description & Trading Guide
🔥 What This Indicator Does
The Candle DNA indicator analyzes each candle to classify it into three powerful market behaviors:
Rejection Candles (STR-REJ)
Dominance Candles (DOM)
Confusion Candles (CONF)
These classifications help traders identify high-probability turning points, trend continuation, and market indecision.
🧬 1. Rejection Candles (STR-REJ)
A rejection candle shows a strong rejection of price in one direction.
It occurs when the candle has a long wick and small body, signaling a strong rejection from buyers or sellers.
✅ How to Use Rejection
Buy Setup:
When a green rejection candle forms near support, it indicates buyers rejected lower prices.
Sell Setup:
When a red rejection candle forms near resistance, it indicates sellers rejected higher prices.
🎯 Profit Tip
Use rejection candles for mean reversion trades (price bouncing back after rejection).
Rejection candles near major support/resistance zones have the highest win rate.
🧠 2. Dominance Candles (DOM)
Dominance candles show strong market control.
They have very large bodies and minimal wick, indicating clear bullish or bearish control.
✅ How to Use Dominance
Buy Setup:
A green dominance candle near support indicates strong bullish control.
Sell Setup:
A red dominance candle near resistance indicates strong bearish control.
🎯 Profit Tip
Dominance candles are excellent for trend continuation trades.
When a dominance candle breaks a key level, the market often follows strongly.
🤝 3. Confusion Candles (CONF)
Confusion candles show indecision in the market.
They have small bodies and almost equal wicks on both sides.
✅ How to Use Confusion
Confusion candles usually appear before big moves.
They indicate the market is deciding its next direction.
🎯 Profit Tip
When CONF appears near support/resistance, wait for the next candle to confirm direction.
📍 Support & Resistance Filter
The indicator only produces strong signals near:
Support zones (low is near 20-period low)
Resistance zones (high is near 20-period high)
This increases the accuracy by filtering out weak signals.
⚠️ Sideways Market Filter
The indicator avoids trading in sideways markets using ATR.
✅ This means:
It only trades when the market has enough momentum
Avoids choppy price action and false signals
🧩 How to Increase Profits Using This Indicator
✔️ Best Profit Strategy
Use the indicator with multiple confirmation steps:
Step 1: Wait for a Strong Signal
STR-REJ or DOM at support/resistance
Step 2: Confirm Trend Direction
Use higher timeframe trend or moving average to confirm.
Step 3: Enter on Confirmation Candle
For more accuracy, enter on the next candle after the signal (Spot mode is recommended).
Step 4: Use Smart Risk Management
Use tight stop loss below/above the candle wick
Use RR 1:3 (recommended)
This ensures you win less but earn more per win.
🧠 Best Trading Rules (Recommended)
✅ BUY RULE
Signal is STR-REJ or DOM near support
Market is not sideways
Confirm bullish trend
Enter on next candle close
✅ SELL RULE
Signal is STR-REJ or DOM near resistance
Market is not sideways
Confirm bearish trend
Enter on next candle close
💡 Extra Profit Tips
✔️ Use it with RSI or MACD for extra confirmation
✔️ Trade only during high liquidity sessions (London/New York)
✔️ Avoid trading before major news
✔️ Combine with order blocks for higher accuracy
🏁 Summary
This indicator is built to:
Detect high-probability reversal zones
Trade trend continuation
Avoid sideways market noise
Help you increase profit with RR 1:3

Candle Intelligence🔹 Candle Intelligence (IM-CI)
Candle Intelligence (IM-CI) is a context-only intraday market behavior indicator designed to help traders understand how price is behaving, not where to buy or sell.
This tool classifies individual candles, detects short-term behavioral patterns, and displays a non-blocking market state to improve decision awareness during live trading.
⚠️ IM-CI does NOT generate buy/sell signals.It is strictly intended for market context, confirmation, and study.
🔍 What This Indicator Does
🧠 Candle Intelligence Layer
Each candle is classified based on volatility-adjusted behavior using ATR:
Strong expansion candles
Normal directional candles
Weak / neutral candles
These classifications are shown as compact candle codes (optional) to quickly read price behavior without clutter.
📐 Pattern Recognition (Context Only)
IM-CI detects short, non-predictive behavioral patterns, such as:
Compression
Absorption
Momentum bursts
Distribution
These patterns are displayed as soft zones, not signals, helping traders visually study how price reacts around key moments.
Cooldown logic is used to prevent repetitive pattern noise.
🌐 Market State Engine
The indicator continuously evaluates recent candle behavior and VWAP positioning to describe the current market condition, such as:
Expansion
Extended
Distribution
Balanced
This state is shown in a small HUD panel and is designed to:
Reduce emotional over-trading
Identify unsuitable market conditions
Improve alignment with higher-probability environments
⚙️ Key Features
ATR-aware candle classification
VWAP extension detection
Timeframe-adaptive candle code visibility
Non-repainting logic
Clean, lightweight HUD panel
Designed for intraday futures & index trading
🛠 How to Use
Use IM-CI as a context filter, not a trigger
Combine with your own execution system
Avoid trading during Extended or unclear states
Best suited for lower timeframes (1–5 min)
⚠️ Disclaimer
This indicator is provided for educational and informational purposes only. It does not constitute financial advice and should not be used as a standalone trading system.
All trading decisions remain the sole responsibility of the user.

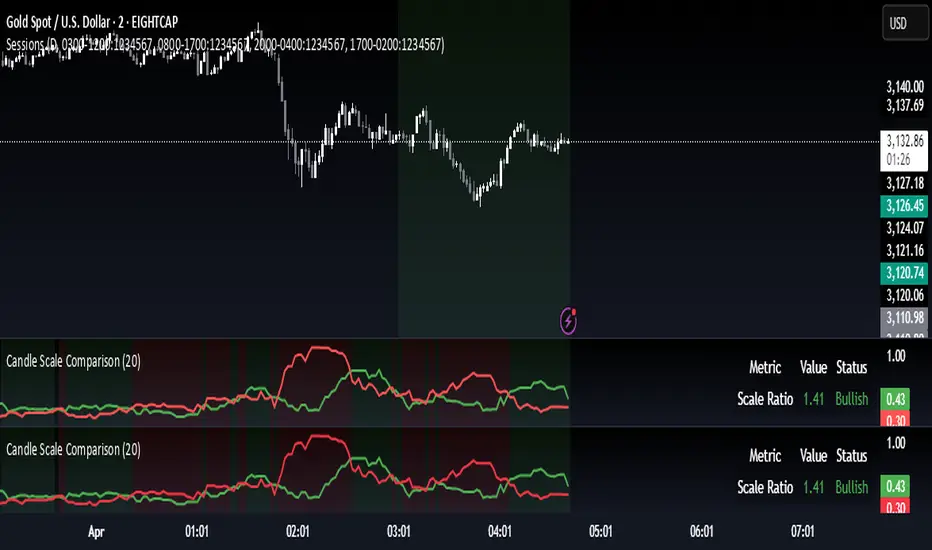
Candle Scale ComparisonCompares the scale of bullish and bearish candles and shows which side is currently dominant. Works in any symbol.
1. Input Parameters:
- LookbackPeriod: Allows you to set how many bars to look back for calculating averages (default: 20)
- showLabels: Toggle to show/hide dominance labels on the chart
2. Calculations:
- Calculates the scale of bullish candles (close - open)
Calculates the scale of bearish candles (open - close)
- Computes moving averages for both scales using the specified lookback period
- Determines which type of candles are dominating based on the averages
3. Visual Elements:
- Plots two lines showing the average scales:
- Green line for bullish candle scales
- Red line for bearish candle scales
- Adds a background color that changes based on dominance:
- Light green when bullish candles dominate
- Light red when bearish candles dominate
- Shows labels above the chart indicating current dominance
- Displays a table in the top-right corner showing:
- The current scale ratio (bullish/bearish)
- The current dominance status
4. Features:
- The indicator is plotted in a separate pane below the main chart
- Uses color coding for easy visual interpretation
- Provides both visual and numerical representation of the dominance
- Updates in real-time as new candles form
Candle Based Trend Reversal (Multi-Timeframe)Candle-Based Trend Reversal (Multi-Timeframe)
Description:
This indicator is designed to help traders identify potential trend reversals by analyzing candle patterns across multiple timeframes. The script uses two sets of conditions to determine bullish and bearish trends:
1. Short-Term Lookback: A shorter lookback period is used to detect initial signs of a trend reversal. The indicator checks for a specific number of bullish or bearish candles within this period. The lookback period for this set can be adjusted according to your preferences.
2. Long-Term Lookback: A longer lookback period is used to confirm the strength of the trend reversal. This additional check ensures that the trend change is significant and not just a short-term fluctuation. The lookback period for this set is also customizable to fit different trading strategies.
When both conditions are met, the script will color the candles accordingly and display a label on the chart to indicate a potential trend reversal. The colors and symbols for bullish and bearish signals are fully customizable in the settings.
How It Works:
* The script examines the closing prices of candles within the specified lookback periods.
* If the conditions for both lookback periods are met, it triggers a signal by changing the color of the candles and displaying a label.
* Once a signal is triggered, the trend (bullish or bearish) will remain active until a new opposing signal is generated.
* The lookback periods for both the short-term and long-term conditions can be modified, allowing you to tailor the indicator to different market conditions and timeframes.
* This helps traders visually identify when a trend reversal might be occurring based on recent price action.
Usage:
* This indicator is particularly effective on monthly, weekly, daily, and hourly charts.
* Simply switch the timeframe, and the indicator will do the rest.
* Look for colored candles and labels to spot potential reversal points.
* The last signal (bullish or bearish) will stay in effect until a contrary signal is given, allowing you to maintain a clear view of the prevailing trend.
* Customize the lookback periods to match your trading style and market conditions.
* This indicator is most effective when used in conjunction with other technical analysis tools.

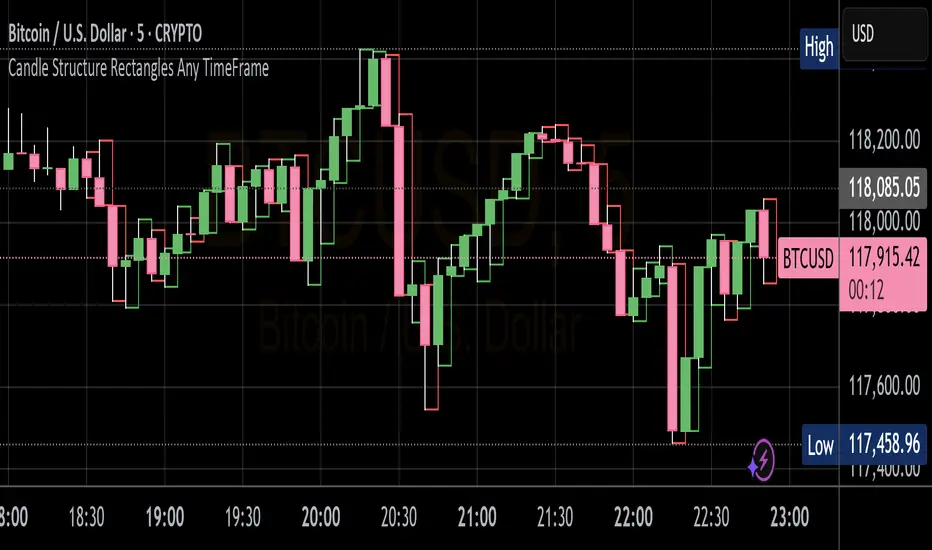
Candle Structure Rectangles Any TimeFrameThis indicator draws the rectangles around the candle wick based on the timeframe selected on the chart.
This will help analyze the candle structure with respect to previous candle and series of candles
Candle Size TableLast 3 Candle Stats – High, Low, Volume & Size
Description:
This intraday trading tool displays the High, Low, Volume, and Size (range) of the last 3 candles on your chart, providing a quick and clear reference for short-term momentum, volatility, and potential trade decisions.
Designed for scalpers and day traders, this indicator helps you:
Gauge momentum shifts by tracking how candle size and volume evolve.
Identify exhaustion or continuation patterns by comparing recent candle ranges.
Define entries and exits with more precision based on real-time market activity.
The candle size is calculated as the absolute difference between the high and low of each candle, making it easy to spot expanding or contracting price action.
Use this as a complementary tool with your price action strategy to enhance timing and confidence in fast-moving markets.

Candle Price % ChangeIf you are using candle bottoms/tops for your stop-loss, this indicator allows you to see the price percentage difference between the current price and the high or low of a candle. This eliminates the need to manually measure the candle every time you need to determine your stop-loss %. It's particularly useful when scalping on small time frames like the 1m.

Candle ClassifierThis indicator uses allows its users to locate classifications of candles based on user defined input.
Using a % of candle range the user can specify,
High Wick %
Candle Body %
Low Wick %
The user can also search for candles within a (user defined) variance range.
A nifty feature of this indicator is the display of your criteria, so that you can be reminded while you're looking through your chart!

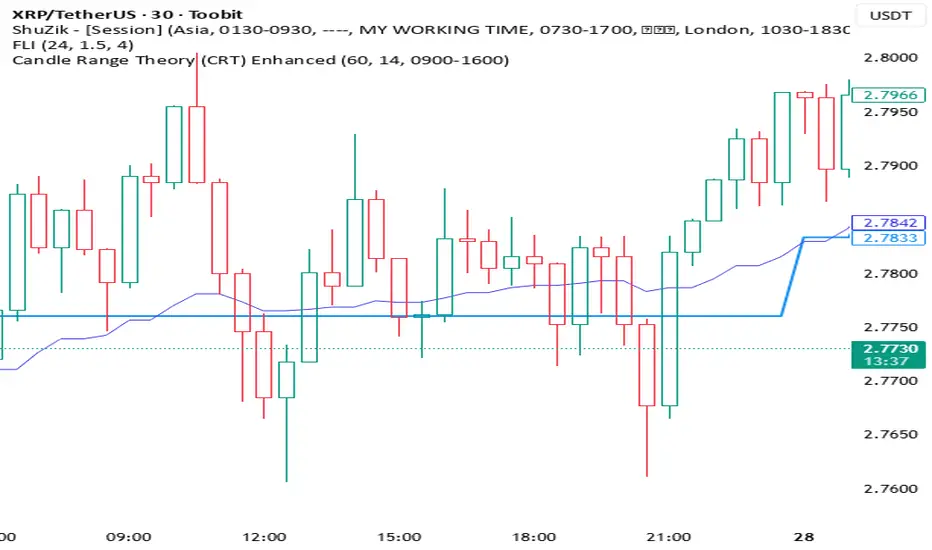
Candle Range Theory (CRT) Enhanced✨ Key upgrades over your version:
Uses multi-timeframe high/low/mid as the reference range.
Adds false breakout candle filter (manipulation logic).
Adds liquidity sweep checks.
Filters out tiny candles (low range = noise).
Adds session filter (only valid during chosen active times).
Plots the HTF midpoint line for reference.
Leaves placeholders for order block / risk management logic.
Candle H-L and C-O PipsPip Value Indicator
Displays whole-number pip distances for forex candles
What it shows:
H-L: The High-Low range in pips
C-O: The Close-Open difference in pips (direction shown via +/-)
Key features:
Auto-detects JPY pairs (uses 0.01 pip size)
All other forex pairs use 0.0001 pip size
Displays only whole numbers (no decimals)
Shows values when hovering over candles
Clean white markers above each bar

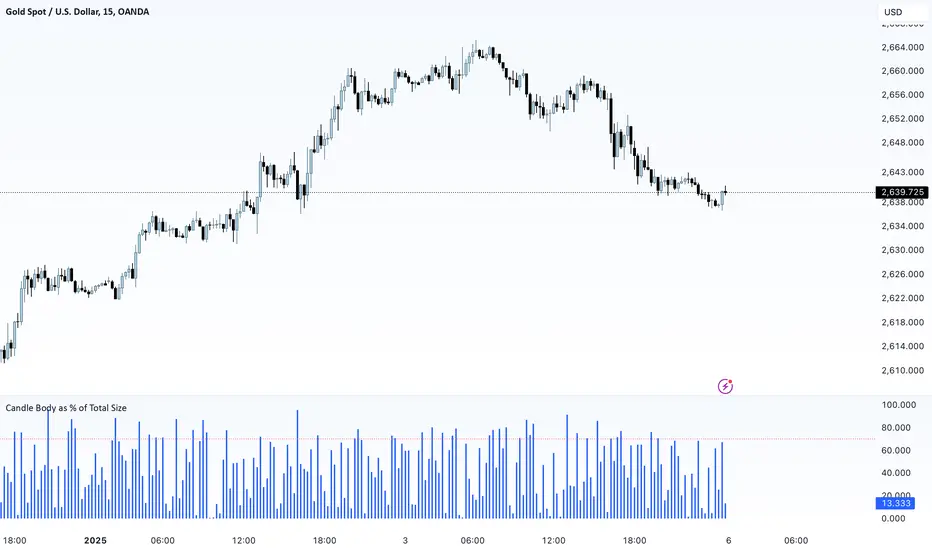
Candle Body Size Of Total SizeThis script calculates the candle body size as a percentage of the total candle size (range from high to low) and plots it as a histogram. It also includes a reference line at 70% to identify candles where the body is significant relative to the total range.
Candle finderInput the open, high, low and close of any candle and this script finds candles that are like it. Deviation input and ability to mark candles that are alike.

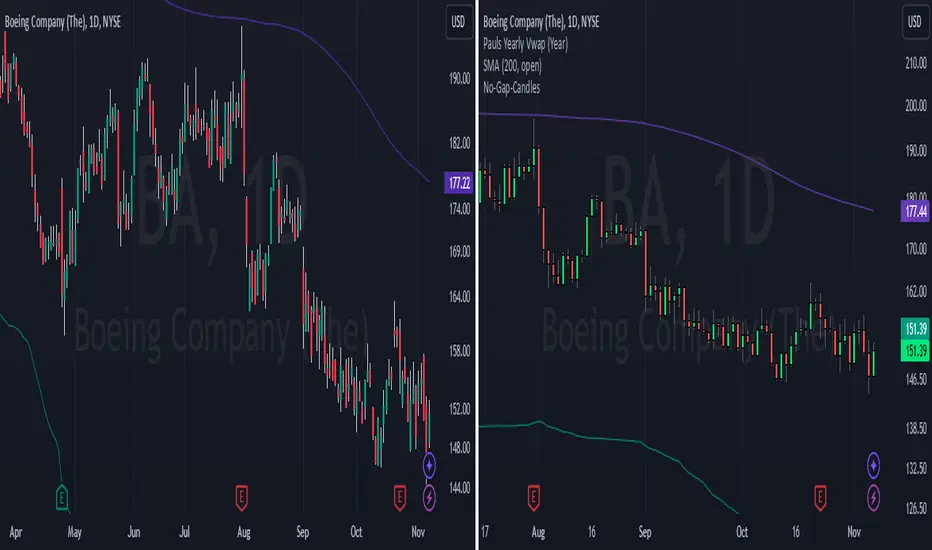
No-Gap-CandlesCandle indicator that makes the chart more readable by removing overnight gaps by using the closing price of the previous day as the opening price of the current day.
Candle Length >= 70This script will highlight candles that have 70 or more points difference between open and close price. It ignores high and low prices.

Candlestick PatternsShort Description: Identify and visualize 16 key candlestick patterns in real-time.
Long Description:
The Candlestick Pattern Detector is a powerful indicator designed to help traders identify and visualize 16 key candlestick patterns in real-time. This indicator overlays the identified patterns on the chart, making it easy for traders to spot potential trend reversals, continuations, or significant price movements.
The indicator detects the following candlestick patterns:
Bullish Engulfing
Bearish Engulfing
Bullish Harami
Bearish Harami
Bullish Piercing
Dark Cloud Cover
Hammer
Hanging Man
Inverted Hammer
Shooting Star
Morning Star
Evening Star
Three White Soldiers
Three Black Crows
Bullish Marubozu
Bearish Marubozu
Each pattern is labeled on the chart with its respective name and color-coded to indicate whether it's a bullish (green) or bearish (red) signal. This makes it easy for traders to quickly spot patterns and make informed decisions based on the detected signals.
To use the Candlestick Pattern Detector, simply add it to your TradingView chart, and it will automatically highlight the identified patterns on the price chart. The patterns are identified based on well-established candlestick pattern recognition techniques, giving traders a reliable tool to aid their technical analysis.
Whether you're a seasoned trader or just starting, the Candlestick Pattern Detector can be a valuable addition to your trading toolkit, helping you to identify potential trading opportunities based on classic candlestick patterns.
