Tìm kiếm tập lệnh với "change"

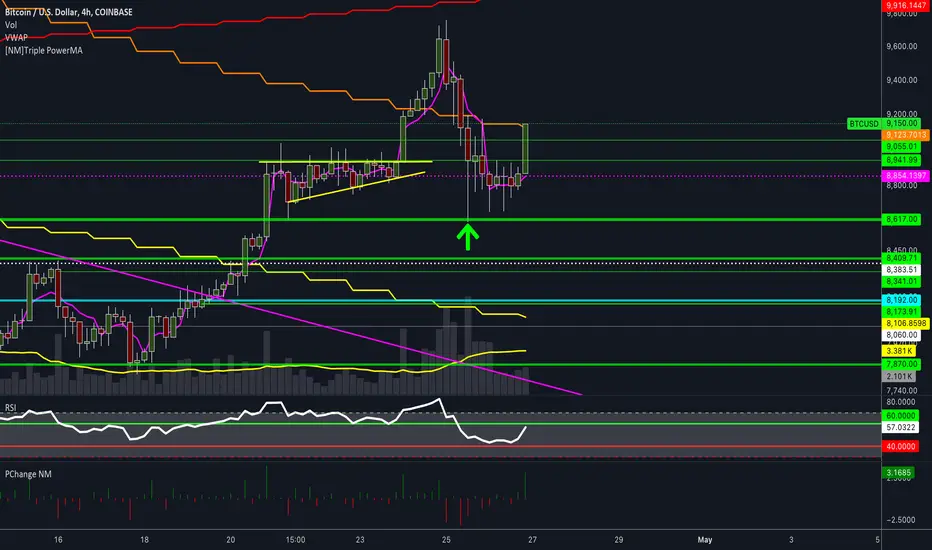
Percentage change by NMSomebody asked me for a script that plotted the percentage change compared to the previous candle, so I made a quick script that does exactly that.
Let me know if you find it useful.
Also do check out my other indicators !
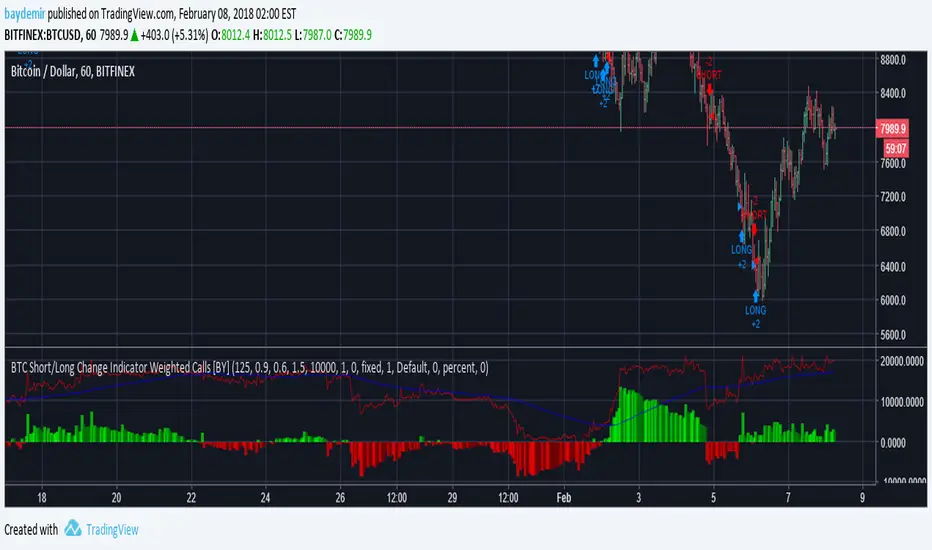
[PW] BITFINEX Shorts ChangeA very simple indicator to show the change of longs between the previous period and the current period on bitfinex, this works for any margin pair on Bitfinex but can also be locked to BITFINEX:BTCUSD, works hand in hand with my "Longs Change" indicator
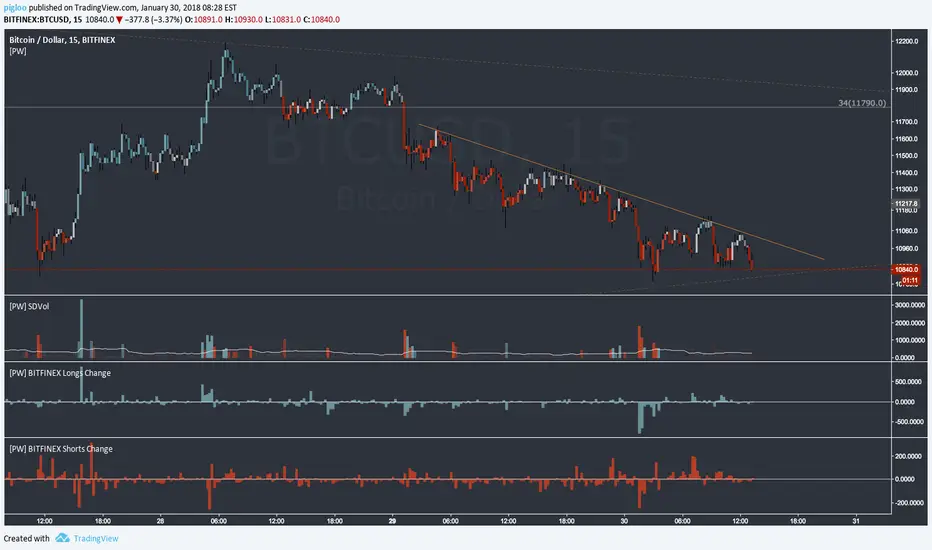
[PW] BITFINEX Longs ChangeA very simple indicator to show the change of longs between the previous period and the current period on bitfinex, this works for any margin pair on Bitfinex but can also be locked to BITFINEX:BTCUSD, works hand in hand with my "Shorts Change" indicator


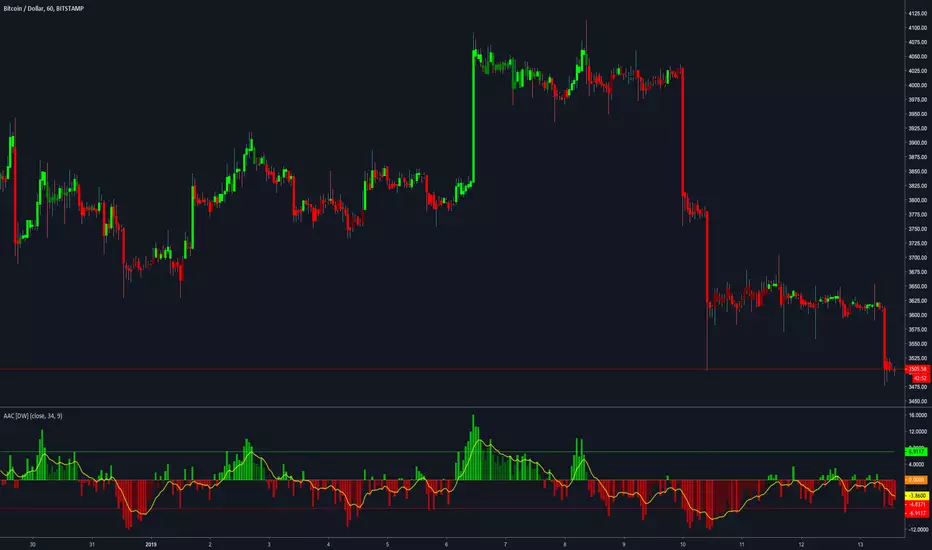
Average Angular Change [DW]This is an experimental study combining the Kaufman Adaptive Moving Average (KAMA) and basic trigonometry to calculate the average angular change of price.
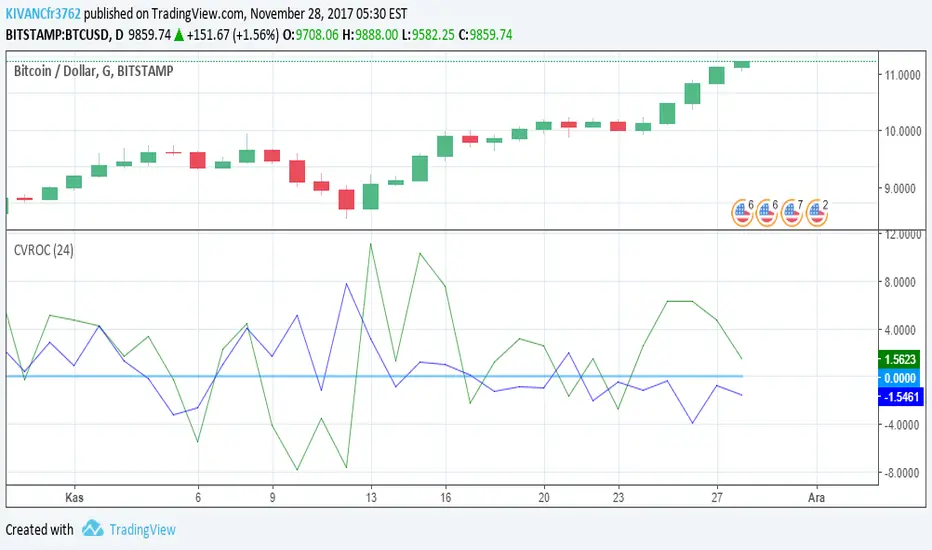
CVROC - Close Volume Rate Of ChangeIndicator designed for cryptotraders to understand whether if the price change is supported by the volume or not
deafult value os SMA of volume is 21 periods
which can be optimized by the user
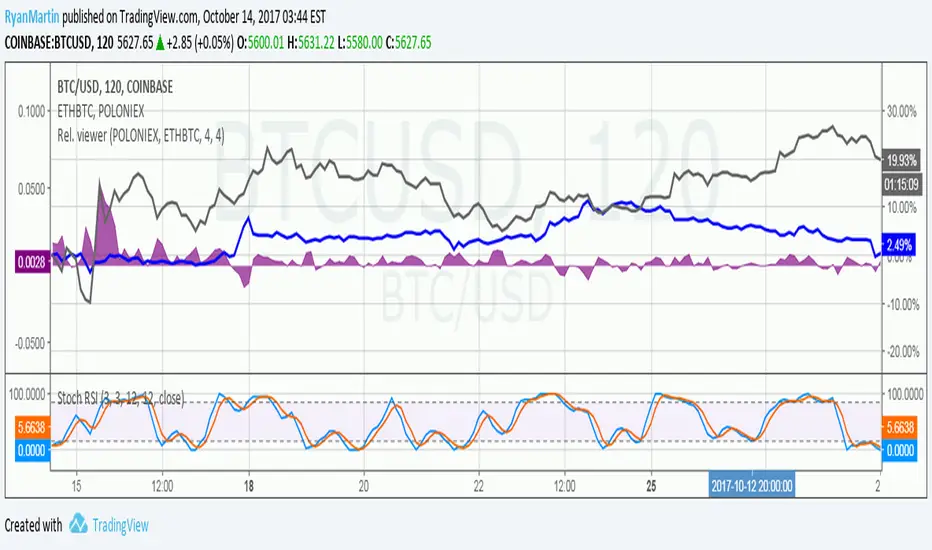
Price relation viewer - add percent change of two symbols (BETA)This script is very much beta!
This is a simple script to visualize how two symbols move in relation to each other. For example if the underlying symbol is a 2x Gold ETF (meaning the ticker moves at 2x the spot price of gold---if gold goes up 3% this ticker should go up 6%) and the comparison symbol is an 2x inverse gold ETF (at gold up 3% this should move down 6%). If these ETFs were 100% accurate at tracking the price of gold then this tool would report a value of zero at all times.
Day 1
Ticker - $10
Comparison - $10
Day 2
Ticker - $12
Comp - $11
This tool value - |20%| + -|10%| = 10%
It uses a short simple moving average to smooth things out a bit (see inputs). It is important to keep your axis scale in mind when using this! Two symbols that are always near zero mean they are offsetting each other very well but the value displayed might range from 0 to 0.005, but the graphed area can make it look extreme if autoscaled.
This is a tool with very specific uses : comparing how one digital currency moves in relation to bitcoin's price, comparing how gold moves in relation to silver, etc.
[RS]Dollar Basket - Bar by Bar Percent ChangeDisplays a horizontal selection of instruments Vs the dollar, value is percent change from bar to bar with option to smooth the data with a simple average.

[RS]Volume Price ChangeEXPERIMENTAL
calculates, price change * volume over a specific time window.
It reflects trend, momentum and volume participation.
It can be used to find divergences.


Session Bar/Candle ColoringChange the color of candles within a user-defined trading session. Borders and wicks can be changed as well, not just the body color.
PREFACE
This script can be used an educational resource for those who are interested in learning Pine Script. Therefore, the script is published open source and is organized in a manner that follows the recommended Style Guide .
While the main premise of the indicator is rather simple, the script showcases various things that can be achieved such as conditional plotting, alignment of indicator settings, user input validation, script optimization, and more. The script also has examples of taking into consideration the chart timeframe and/or different chart types (Heikin Ashi, Renko, etc.) that a user might be running it on. Note: for complete beginners, I strongly suggest going through the Pine Script User Manual (possibly more than once).
FEATURES
Besides being able to select a specific time window, the indicator also provides additional color settings for changing the background color or changing the colors of neutral/indecisive candles, as shown in the image below.
This allows for a higher level of customization beyond the TradingView chart settings or other similar scripts that are currently available.
HOW TO USE
First, define the intraday trading session that will contain the candles to modify. The session can be limited to specific days of the week.
Next, select the parts of the candles that should be modified: Body, Borders, Wick, and/or Background.
For each of the candle parts that were enabled, you can select the colors that will be used depending on whether a candle is bullish (⇧), bearish (⇩), or neutral (⇆).
All other indicator settings will have a detailed tooltip to describe its usage and/or effect.
LIMITATIONS
The indicator is not intended to function on Daily or higher timeframes due to the intraday nature of session time windows.
The indicator cannot always automatically detect the chart type being used, therefore the user is requested to manually input the chart type via the " Chart Style " setting.
Depending on the available historical data and the selected choice for the " Portion of bar in session " setting, the indicator may not be able to update very old candles on the chart.
EXAMPLE USAGE
This section will show examples of different scenarios that the indicator can be used for.
Emphasizing a main trading session.
Defining a "Pre/post market hours background" like is available for some symbols (e.g., NASDAQ:AAPL ).
Highlighting in which bar the midnight candle occurs.
Hiding indecision bars (neutral candles).
Showing only "Regular Trading Hours" for a chart that does not have the option to toggle ETH/RTH. To achieve this, the actual chart data is hidden, and only the indicator is visible; alternatively, a 2nd instance of the indicator could change colors to match the chart background.
Using a combination of Bars and Japanese Candlesticks. Alternatively, this could be done by hiding the main chart data and using 2 instances of the indicator (one with " Chart Style " setting as Bars , and the other set to Candles ).
Using a combination of thin and thick bars on Range charts. Note: requires disabling the "Thin Bars" setting for Bar charts in the TradingView chart settings.
NOTES
If using more than one instance of this indicator on the same chart, you can use the TradingView "Save Indicator Template" feature to avoid having to re-configure the multiple indicators at a later time.
This indicator is intended to work "out-of-the-box" thanks to the behind_chart option introduced to Pine Script in October 2024. But you can always manually bring the indicator to the front just in case the color changes are not being seen (using the "More" option in the indicator status line: More > Visual Order > Bring to front ).
Many thanks to fikira for their help and inspiring me to create open source scripts.
Any feedback including bug reports or suggestions for improving the indicator (or source code itself) are always welcome in the comments section.

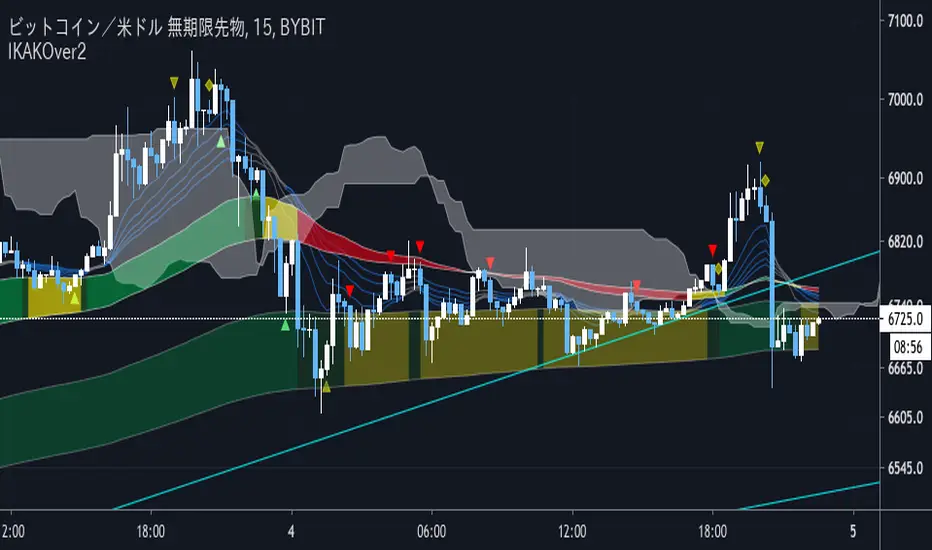
IKAKOver2(LITE雲なし)
change point
I tried to make the operation lighter by removing the display of the Ichimoku balance table.
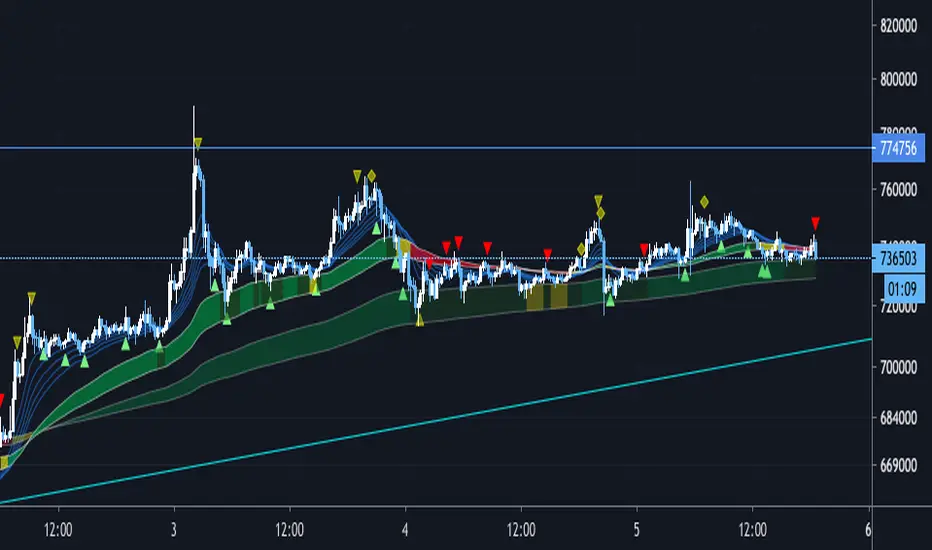
We have set a period such as EMA to use 5 minute bars and the first band is period 60 and 100 EMA . The color of the belt changes according to the position of the period 5EMA-25EMA-50EMA. The second sash is based on a 60- and 100-EMA period of 15 minutes. The change in the color of the obi is also a 15-minute specification.
Since the above period can be changed, I think that there are customs such as 1 hour and 4 hours.
Buying and selling signs are shown in green for buying and red for selling. (More frequent)
For the time being, it is also possible to display the Ichimoku balance table.
As for my usage method, when both the 15-minute and 5-minute bars have an uptrend (downtrend ), when each trading sign is confirmed, spread the limit just below the price. . (Because there is a commission in the market)
If the color of the obi becomes yellow, the trend may be over, so wait for the signature to reach the bundle of 15 minutes instead of 5 minutes, and after the signature is confirmed, it is the same as 5 minutes.
The loss cut line is often the latest low. Or when the obi is broken. .
I am still studying about profitability. Sometimes we use indicators, sometimes we reach the target horizon. I think each way is good.
It is a discretionary aid, and the head and tail are cut off, and the image is about 10 to 100 $.
IKAKOver2change point
Improve the accuracy of reverse sign
Adding a signature using only RCI
変更点
逆張りのサインと順張りのサインを区別し、逆張りのサインは騙しができるだけ少なくなるように精度を上げました。
逆張りか順張りかは10emaと100emaの位置関係だけで区別しています。
また、RCIのみを利用した、レンジ相場用のサインを追加しました。
We have set a period such as EMA to use 5 minute bars and the first band is period 60 and 100 EMA . The color of the belt changes according to the position of the period 5EMA-25EMA-50EMA. The second sash is based on a 60- and 100-EMA period of 15 minutes. The change in the color of the obi is also a 15-minute specification.
Since the above period can be changed, I think that there are customs such as 1 hour and 4 hours.
Buying and selling signs are shown in green for buying and red for selling. (More frequent)
For the time being, it is also possible to display the Ichimoku balance table.
As for my usage method, when both the 15-minute and 5-minute bars have an uptrend (downtrend ), when each trading sign is confirmed, spread the limit just below the price. . (Because there is a commission in the market)
If the color of the obi becomes yellow, the trend may be over, so wait for the signature to reach the bundle of 15 minutes instead of 5 minutes, and after the signature is confirmed, it is the same as 5 minutes.
The loss cut line is often the latest low. Or when the obi is broken. .
I am still studying about profitability. Sometimes we use indicators, sometimes we reach the target horizon. I think each way is good.
It is a discretionary aid, and the head and tail are cut off, and the image is about 10 to 100 $.
Volatility after Momentum/SMA crossChanged default value of average true range, to make changes in volatility more distinct.
