Custom Price Red Line IndicatorCustom Price Red Line Indicator is a tool used in trading platforms to visually represent key price levels on a chart. This indicator typically draws a red line at a specific price, which can serve as a threshold or a level of interest, such as a resistance or support level. It is customizable to allow traders to set the price at which the red line will appear, making it useful for highlighting critical price points that may signal potential trade entries or exits.
Key Features:
• Customizable Price Level: Set the exact price where the red line will be drawn.
• Visual Signal: The red line acts as a visual aid to indicate important price levels.
• Alerts: Traders can set alerts when the price crosses the red line to track market movements.
• Trend Analysis: The red line can represent key support, resistance, or psychological price levels for trend analysis.
This indicator can be used in various timeframes and across different asset classes to assist traders in their technical analysis.
Tìm kiếm tập lệnh với "chart"

Inside/Outside Bar Direction Highlighter
Here’s a trading indicator in Pine Script (v6) that combines the essence of the Inside Bar, Outside Bar, and directional patterns inspired by TT3 Theory. This indicator highlights bars based on their classification as inside, outside, or directional and provides potential trade signals.
Inside Outside Indicator
Explanation:
Bar Classification:
Inside Bar: Current high is less than the previous high, and the low is greater than the previous low.
Outside Bar: Current high exceeds the previous high, and the low breaks below the previous low.
Up/Down Bars: Closing prices relative to the previous high/low.
Visual Highlights:
Bars are visually highlighted with colors for easy identification.
Trade Signals:
Long Signal: When the close crosses above the previous high and it's a directional up bar.
Short Signal: When the close crosses below the previous low and it's a directional down bar.
Customizable Inputs:
Colors for inside, outside, up, and down bars can be modified.
You can copy and paste this script into the Pine Editor on TradingView to see it in action. Adjust the logic to fit your trading strategy as needed.
You said:
summary of how to use this indicator without buy/sell signal
ChatGPT said:
ChatGPT
How to Use the Inside/Outside Bar Direction Highlighter Indicator (Without Buy/Sell Signals)
Understand the Bar Classifications:
Inside Bars: Highlighted in blue (default). These indicate periods of market consolidation. Look for potential breakouts in either direction.
Outside Bars: Highlighted in orange (default). These represent increased volatility, where both higher highs and lower lows are made. Watch for reversals or continuations based on broader trends.
Directional Up Bars: Highlighted in green (default). These occur when the current close is above the previous high, signaling bullish momentum.
Directional Down Bars: Highlighted in red (default). These occur when the current close is below the previous low, indicating bearish momentum.
Identify Key Patterns:
Use the highlighted bars to spot price action setups, such as:
Breakouts from inside bars.
Reversal signals following outside bars.
Continuation patterns when directional bars align with the trend.
Combine with Your Analysis:
Trend Analysis: Match bar classifications with trend direction on larger timeframes (e.g., daily, 4-hour).
Support/Resistance: Use inside and outside bars near key levels for confirmation or reversal signals.
Volume: Higher volume on directional bars strengthens the momentum signal.
Customize the Colors:
Adjust the bar highlight colors to fit your chart theme for better visibility.
No Automatic Signals:
This indicator doesn’t provide explicit buy/sell recommendations. Instead, use the visual highlights to make informed decisions based on your trading strategy.
By interpreting these bar patterns, you can better gauge market behavior and make more confident decisions without relying on preset signals.

Long Position with 1:3 Risk Reward and 20EMA CrossoverThe provided Pine Script code implements a strategy to identify long entry signals based on a 20-EMA crossover on a 5-minute timeframe. Once a buy signal is triggered, it calculates and plots the following:
Entry Price: The price at which the buy signal is generated.
Stop Loss: The low of the previous candle, acting as a risk management tool.
Take Profit: The price level calculated based on a 1:3 risk-reward ratio.
Key Points:
Buy Signal: A buy signal is generated when the current 5-minute candle closes above the 20-EMA.
Risk Management: The stop-loss is set below the entry candle to limit potential losses.
Profit Target: The take-profit is calculated based on a 1:3 risk-reward ratio, aiming for a potential profit three times the size of the risk.
Visualization: The script plots the entry price, stop-loss, and take-profit levels on the chart for visual clarity.
Remember:
Backtesting: It's crucial to backtest this strategy on historical data to evaluate its performance and optimize parameters.
Risk Management: Always use appropriate risk management techniques, such as stop-loss orders and position sizing, to protect your capital.
Market Conditions: Market conditions can change, and strategies that worked in the past may not perform as well in the future. Continuously monitor and adapt your strategy.
By understanding the core components of this script and applying sound risk management principles, you can effectively use it to identify potential long entry opportunities in the market.

20 Pips Candle Finder for XAUUSD20 Pips Candle Finder for XAUUSD
This custom Pine Script indicator is specifically designed for XAUUSD (Gold) price action analysis. It identifies and visually marks candles with a body size of 20 pips or more, which can be important for traders focusing on strong momentum or significant price movement.
Key Features:
Dynamic Detection:
The script dynamically identifies candles whose body size exceeds 20 pips.
Calculations are based on XAUUSD's pip size of 0.1.
Visual Markers:
Candles meeting the 20-pip threshold are labeled with a green marker above the candle for quick identification.
Background Highlighting:
The candles meeting the condition are also visually highlighted with a transparent green background, making them easier to spot on the chart.
Debugging Tools:
The indicator plots:
A blue line showing the size of the candle bodies over time for better visibility.
A red dotted horizontal line showing the 20-pip threshold for quick reference.
Ideal Use Case:
This indicator is particularly useful for:
Traders focusing on momentum-based strategies.
Spotting candles with significant price movement.
Assessing market volatility during key trading hours or events.
By visually spotting these candles, traders can identify entry and exit opportunities, support/resistance breakouts, or potential reversals.
Inputs & Customization:
Currently, the indicator is set for XAUUSD's standard pip value (0.1) but can be adjusted if you plan to use it on other symbols. You can fine-tune the 20 pips threshold or other parameters to align with your trading strategy.

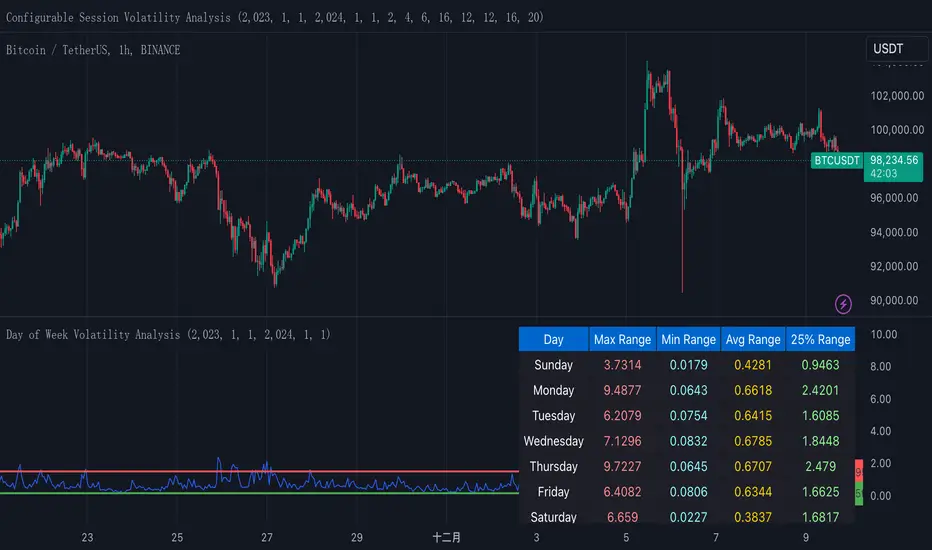
Normalized True Range - Grouped by WeekdaysThis indicator helps traders analyze daily volatility patterns across different days of the week by calculating normalized price ranges.
Unlike traditional volatility measures, it uses a normalized approach by dividing the daily range (high-low) by the midpoint price and multiplying by 100, providing a percentage-based measure that's comparable across different price levels. This normalization makes it particularly useful for comparing volatility patterns across different assets or time periods.
The indicator also includes a statistical overlay that highlights extreme volatility events. By calculating the 5th and 95th percentiles of the normalized ranges within your specified date range, it creates upper and lower bounds that help identify outlier days where volatility was exceptionally high or low.
These bounds appear as horizontal lines on the chart, making it easy to spot when current volatility breaks out of its historical norms.
The data is presented in both visual and tabular formats, with a comprehensive table showing the maximum, minimum, average, and 25th percentile ranges for each day of the week. This dual presentation allows traders to both quickly spot patterns visually and access detailed statistics for deeper analysis.
The user can customize the analysis period through simple date range inputs, making it flexible for different analytical timeframes.
XAUUSD Trend Strategy### Description of the XAUUSD Trading Strategy with Pine Script
This strategy is designed to trade gold (**XAUUSD**) using proven technical analysis principles. It combines key indicators such as **Exponential Moving Averages (EMA)**, the **Relative Strength Index (RSI)**, and **Bollinger Bands** to identify trading opportunities in trending market conditions.
---
#### Objective:
To maximize profits by identifying trend-aligned entry points while minimizing risks through well-defined Stop Loss and Take Profit levels.
---
### How It Works
1. **Indicators Used:**
- **Exponential Moving Averages (EMA):** Tracks short-term and long-term trends to confirm market direction.
- **Relative Strength Index (RSI):** Detects overbought or oversold conditions for potential reversals or trend continuation.
- **Bollinger Bands:** Measures volatility to identify breakout or reversion points.
2. **Entry Rules:**
- **Long (Buy):** Triggered when:
- The short-term EMA crosses above the long-term EMA (bullish trend confirmation).
- RSI exits oversold territory (<30), signaling buying momentum.
- The price breaks above the upper Bollinger Band, indicating a strong trend.
- **Short (Sell):** Triggered when:
- The short-term EMA crosses below the long-term EMA (bearish trend confirmation).
- RSI exits overbought territory (>70), signaling selling momentum.
- The price breaks below the lower Bollinger Band, indicating a strong downtrend.
3. **Risk Management:**
- **Stop Loss:** Automatically calculated based on a percentage of equity risk (customizable via inputs).
- **Take Profit:** Defined using a risk-to-reward ratio, ensuring consistent profitability when trades succeed.
4. **Visualization:**
- The chart displays the EMAs, Bollinger Bands, and entry/exit points for clear analysis.
---
### Key Features:
- **Customizable Parameters:** You can adjust EMAs, RSI thresholds, Bollinger Band settings, and risk levels to suit your trading style.
- **Alerts:** Automatic alerts for potential trade setups.
- **Backtesting-Ready:** Easily test historical performance on TradingView.
---
This strategy is ideal for gold traders looking for a systematic, rule-based approach to trading trends with minimal emotional interference.

HMM Regime IndicatorHMM Regime Indicator
Overview:
The HMM Regime Indicator is designed to help traders identify market regimes by analyzing trend strength, momentum, and price deviation. It uses a combination of the Average Directional Index (ADX), Relative Strength Index (RSI), and Commodity Channel Index (CCI) to classify market conditions into three distinct regimes: Bullish, Bearish, and Sideways.
Key Features:
ADX (Average Directional Index): Measures the strength of a trend. A high ADX value indicates a strong trend, while a low value suggests a weak or non-existent trend.
RSI (Relative Strength Index): Identifies overbought or oversold conditions. An RSI above 70 typically indicates overbought conditions, while an RSI below 30 suggests oversold conditions.
CCI (Commodity Channel Index): Evaluates the price deviation from its average. High CCI values indicate that prices are well above their average, while low values suggest prices are below their average.
Regime Detection:
Bullish Regime: Identified when the ADX indicates a strong trend, and both RSI and CCI suggest overbought conditions. This regime is marked with a green background on the chart.
Bearish Regime: Detected when the ADX shows a strong trend, and both RSI and CCI indicate oversold conditions. This regime is highlighted with a red background.
Sideways Regime: Occurs when neither bullish nor bearish conditions are met, suggesting a lack of strong directional movement. This regime is shown with a blue background.
Usage:
This indicator is useful for traders looking to understand the current market environment and adjust their strategies accordingly. By identifying the prevailing market regime, traders can make more informed decisions about entering or exiting trades.
Customization:
Users can adjust the input parameters for ADX, RSI, and CCI to better fit their trading style and the specific asset being analyzed. The default settings are optimized for general use but can be tailored to suit individual preferences.

Heikin Ashi Buy-Sell Signals [Non-Repainting] @TradingadeThis is a basic indicator that displays Heikin Ashi candles in a simple format. Key features include:
- Unlike most other Heikin Ashi indicators, this one does not repaint, which is crucial when building strategies based on indicators.
- It generates Buy & Sell signals based on consecutive candles of the same color:
BUY Signal: Triggered when there are at least x green candles in a row (adjustable in settings).
SELL Signal: Triggered when there are at least x red candles in a row (also adjustable in settings).
Multiple Signal Option: If activated, the indicator will continue generating signals after the buy or sell condition is met, until a candle of the opposite color appears.
The Buy & Sell signals are shown both in the indicator and on your chart. You can turn them on or off in the style section.
You can set alerts when buy or sell signals are generated.

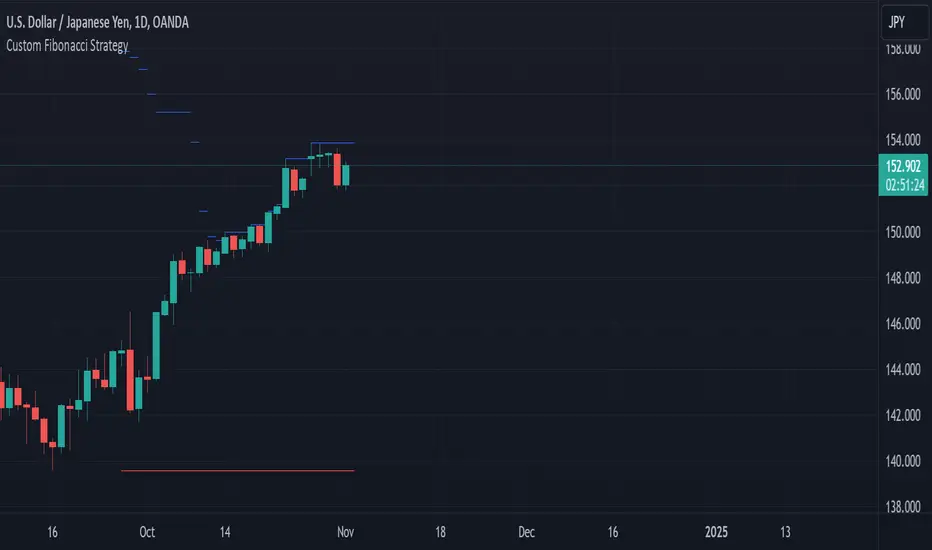
Custom Fibonacci StrategyCustom Fibonacci Strategy:
This strategy relies on analyzing Fibonacci levels to identify entry points for trades. It works by identifying peaks and troughs over a specified time period (50 bars in this code). Here are the steps of the strategy:
Identifying Peaks and Troughs:
The highest peak and lowest trough over the last 50 bars are identified.
If the price exceeds the previous peak, it is considered a break of the peak.
If the price falls below the previous trough after breaking the peak, it is considered a break of the trough.
Calculating Fibonacci Levels:
The 50% level (midway point) between the identified peak and trough is calculated.
Buy Signals:
When a trough is broken, and the price trades at or below the 50% level, the risk-to-reward ratio is evaluated.
If the risk-to-reward ratio is greater than or equal to 2, a buy signal is generated.
Displaying Levels:
Horizontal lines are displayed on the chart to illustrate the peak, trough, and Fibonacci level.
Summary
This strategy provides a systematic approach to trading based on Fibonacci retracement levels and price action, allowing traders to make informed decisions about entry points and manage risk effectively.
Vishnu's Magics**Vishnu's Magics** is a powerful RSI (Relative Strength Index) indicator designed to enhance trading strategies through effective divergence detection and alerting features. This indicator provides the following key functionalities:
1. **RSI Calculation**: Calculates the RSI over a customizable length, allowing traders to identify overbought and oversold conditions.
2. **Customizable Bands**: Users can set multiple upper and lower bands to define different overbought and oversold levels, facilitating precise trading decisions.
3. **Divergence Detection**: The indicator identifies both bullish and bearish divergences by comparing price action with RSI movements. It highlights these divergences on the chart, helping traders anticipate potential reversals.
4. **Visual Alerts**: When divergences are detected, the indicator visually marks the points on the chart with labeled shapes ("Bull" for bullish divergence and "Bear" for bearish divergence) and changes the background color to indicate the condition.
5. **Alert System**: Users can set alerts for significant events, such as crossing specified bands or detecting divergences, ensuring timely notifications for trading opportunities.
6. **Custom Line Values**: Traders can edit the values for the divergence lines, providing flexibility to tailor the indicator according to their trading strategies.
Overall, **Vishnu's Magics** serves as an intuitive tool for traders looking to leverage RSI analysis and divergence strategies for informed trading decisions.

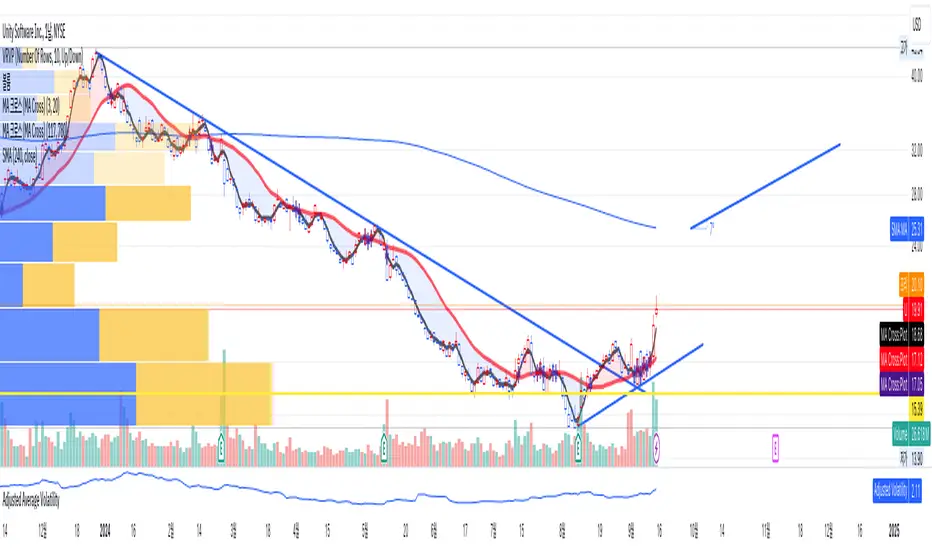
Adjusted Average VolatilityThis Pine Script calculates the average volatility over the past 20 bars by taking the difference between the high and low prices. It then adjusts this volatility based on the previous closing price: if the price is below $20, the volatility is multiplied by 2, and if it’s above $20, the volatility is multiplied by 1.5. The adjusted volatility is then plotted on the chart, helping traders visualize how volatility changes relative to the asset's price level.
5-9-20-100 Day EMAIndicator Name: "5-9-20-100 Day EMA"
Purpose: This indicator plots four key EMAs (5, 9, 20, and 100-day) on a daily chart, providing a clear visualization of both short-term and long-term trends. The EMAs serve as critical triggers for identifying potential entry and exit points based on price interactions with these moving averages.
Technical Details:
Version: Pine Script v5
EMAs Used:
5-Day EMA (Lime): Captures the most recent price trends, useful for identifying short-term momentum.
9-Day EMA (Yellow): Offers a slightly broader view, often used to confirm the short-term trend.
20-Day EMA (Orange): Represents a medium-term trend, commonly used as a signal for trend reversals.
100-Day EMA (Red): Indicates the long-term trend, often serving as strong support or resistance levels.
Trigger Points:
Crossovers: Price crossing above or below these EMAs can trigger potential buy or sell signals.
Convergence/Divergence: The interaction between the EMAs, such as a faster EMA crossing a slower one, can signal trend reversals or continuations.
Utility: This indicator is ideal for traders who rely on EMA crossovers and the relationship between different EMAs to make informed trading decisions.

T-Wave Pattern IdentifierA T-wave might describe a pattern where the price movement forms a "T" shape on the chart, which could involve:
Strong Vertical Movement (The Stem of the T):
This could represent a sharp, decisive move in one direction (up or down), often occurring in a single candle or a few candles. This movement could be seen as the "stem" of the T.
For example, a sudden spike up in price followed by a horizontal consolidation.
Horizontal Movement (The Cross of the T):
Following the sharp move, the price might consolidate sideways, forming a horizontal base or resistance/support level, which creates the top cross of the "T."
This could indicate a pause or a consolidation phase after a significant move, where the price moves within a narrow range.
Contexts Where a T-Wave Pattern Might Be Useful:
Breakout Scenarios: If a T-wave forms after a significant upward or downward movement, it could suggest a potential continuation in the direction of the initial move, especially if the price breaks out of the consolidation range.
Reversal Signals: Alternatively, the T-wave could act as a reversal pattern if the price fails to continue in the direction of the initial move and instead breaks out in the opposite direction.
T-Wave Logic Example:
Stem (Vertical Movement):
Identify a candle or series of candles with a significant price move (e.g., a large-bodied candle with a relatively small wick). This shows momentum in one direction.
Cross (Horizontal Movement):
Following the vertical move, identify a consolidation phase where the price moves sideways in a relatively tight range. This could be visualized as a series of small candles with overlapping highs and lows.

Custom Time HighlighterThis indicator draws a vertical line on the chart at every Sunday opening price.
The indicator is intended to help divide the chart into individual weeks.
You can adjust the time when the line is drawn in the settings.

W and M Pattern with Trend AlertThis script detects W and M patterns in price action and alerts the trader when these patterns occur, providing potential trading opportunities.
W Pattern: A W pattern forms when the price creates two bottoms, separated by a higher low in the middle. It often indicates a reversal from a downtrend to an uptrend. The script plots a green line at the neckline of the W pattern.
M Pattern: An M pattern forms when the price creates two tops, separated by a lower high in the middle. It often indicates a reversal from an uptrend to a downtrend. The script plots a red line at the neckline of the M pattern.
Key Features:
Alerts: The script generates alerts when W or M patterns are detected, allowing traders to stay informed of potential trading opportunities.
Recent Breakout: W and M pattern lines are drawn only after the recent breakout of support or resistance levels, helping traders focus on current market conditions.
Visual Representation: The script visually represents W and M patterns with vertical lines at the neckline, making it easier for traders to identify potential reversal points.
Usage:
Watch for alerts indicating the detection of W or M patterns.
Verify the pattern visually on the chart, paying attention to recent support or resistance levels.
Consider entering a trade based on the direction suggested by the pattern (e.g., long on W pattern, short on M pattern), using additional technical analysis to confirm the trade setup.

Xen's Flag Pattern Scalper1. Input Parameters:
FlagLength: Determines the length of the flag pattern.
TakeProfit1Ratio, takeProfit2Ratio, takeProfit3Ratio: Define the ratios for calculating
the take-profit levels relative to the entry price.
RiskRewardRatio: Specifies the risk-reward ratio for calculating the stop-loss level
relative to the entry price.
2 Flag Conditions:
BullishFlag: Checks if the current bar meets the conditions for a bullish flag pattern. It
evaluates to true if the low of the current bar is lower than the low flagLength bars
ago, and the close of the current bar is higher than the high flagLength bars ago.
BearishFlag: Checks if the current bar meets the conditions for a bearish flag pattern. It evaluates to true if the high of the current bar is higher than the high flagLength bars
ago, and the close of the current bar is lower than the low flagLength bars ago.
3. Entry Price:
EntryPrice: Calculates the entry price based on whether a bullish or bearish flag
pattern is identified. For a bullish flag, the entry price is set to the low of the current bar.
For a bearish flag, the entry price is set to the high of the current bar.
4. Stop Loss:
StopLoss: Determines the stop-loss level based on the entry price and the specified
riskRewardRatio . For a bullish flag, the stop-loss level is calculated by subtracting the
difference between the high and low of the current bar multiplied by the riskRewardRatio from the low of the current bar. For a bearish flag, the stop-loss level
is calculated similarly but added to the high of the current bar.
5. Take Profit Levels:
Three take-profit levels ( takeProfit1, takeProfit2, takeProfit3 ) are calculated based on
the entry price, stop-loss level, and specified take-profit ratios ( takeProfit1Ratio,
takeProfit2Ratio, takeProfit3Ratio ).
6. Plotting Signals and Levels:
Bullish and bearish flag patterns are plotted using triangle shapes ( shape.triangleup for
bullish and shape.triangledown for bearish) above or below the bars, respectively.
Entry, stop-loss, and take-profit levels are plotted using horizontal lines ( line.new )
with different colors and styles. Entry and stop-loss levels are labeled with "Entry" and "SL",
respectively, while take-profit levels are labeled with "TP 1", "TP 2", and "TP 3".
The colors for bullish flags are white for entry, red for stop-loss, and green for take-profit levels. For bearish flags, the colors are the same, but the labels are plotted above the bars.
7. Label Placement:
Labels for entry, stop-loss, and take-profit levels are placed a distance of 4 bars to the right
of the entry price using bar_index + 4 .
This indicator is intended to help traders identify flag patterns on price charts and visualize potential entry, stop-loss, and take-profit levels associated with these patterns.
Please use risk management and when TP1 is hit, move stoploss to breakeven .

Tomorrow CamarillaThis indicator will help you to find the next day camarilla pivots
note: you need to customise the settings use #ENABLE PRICE LINE# then you got the next day line on your chart

NDOG + ASIA CONFLUENCENDOG (New Day Opening Gap) Visualization:
The indicator identifies and visualizes New Day Opening Gaps (NDOGs), which are essentially the differences between the opening price of a new trading day and the closing price of the previous day.
For each NDOG identified, it creates a box on the chart that highlights the high and low price range of the NDOG.
The color of these boxes, as well as the number of NDOGs to be displayed, can be customized by the user.
Asia Session Highlighting:
The indicator includes a feature to highlight the Asia trading session, typically spanning from 18:00 to 00:00, but customizable to suit different time zones or preferences.
It does not dynamically calculate or display the Asia session but uses a fixed time input by the user.
The color for highlighting the Asia session can be chosen by the user.
Additional Lines on NDOGs:
The script draws horizontal lines at the high and low of each NDOG, spanning from 18:00 to 00:00, to visually represent the range of the NDOG during the Asia session.
The color of these lines can be customized.
Customizability:
The indicator provides various input options for users to customize the colors of the NDOG boxes and the lines that represent the high and low of the NDOGs.
Purpose and Usage:
This indicator is useful for traders who focus on price gaps between trading days and are particularly interested in the price action during the Asia trading session.
It helps in identifying potential zones of interest where significant price movements or trading activities could occur, especially at the opening of a new trading day.

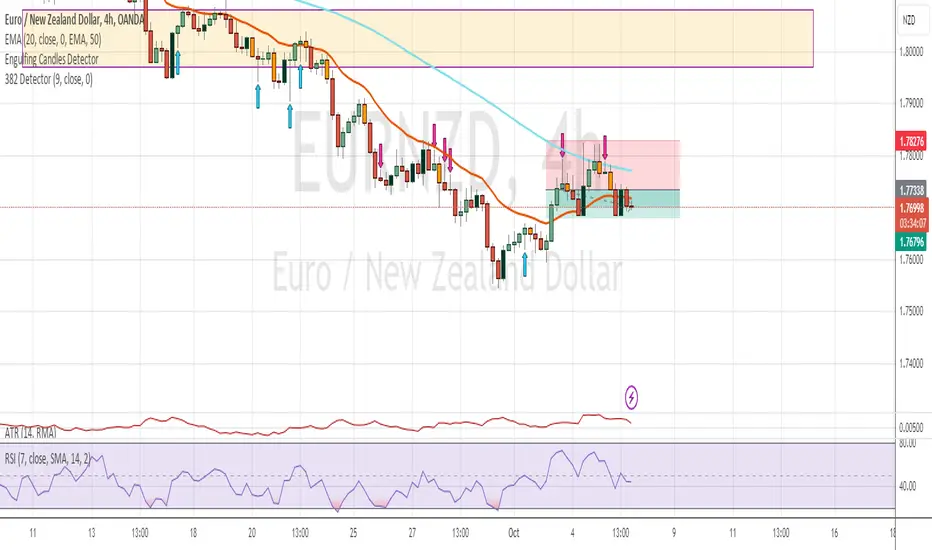
382 Detector with ArrowsThis indicator searches for all 382 candles on the chart.
For a bullish 382 candle, it means that the body of the candle (open to close) are on the top 38.2% of the entire candle (including the wick). Such candlestick pattern displays a bullish pattern because the buyers are in control and pushed for higher prices at the close of the bar.
On the other hand, a bearish 382 candle, the body of the candle (close to open) are on the bottom 38.2% of the entire candle (including the wick). Such candlestick pattern displays a bearish pattern because the sellers are in control and pushed for lower prices at the close of the bar.
If a bullish 382 candle is detected, a light blue arrow will be displayed on the bottom of the candlestick.
If a bearish 382 candle is detected, a pink arrow will be displayed on the top of the candlestick.
Please note that these are only candlestick pattern detectors and are by no means bullish or bearish trade signals. An upward arrow does not represent any long trade opportunity and similarly a downward arrow does not represent any short trade opportunity. These are just visual representation of candlestick patterns. Please trade at your own risk.
Improved EMA & CDC Trailing Stop StrategyImproved EMA & CDC Trailing Stop Strategy
Objective: This strategy seeks to exploit potential trend reversals or continuations using Exponential Moving Averages (EMAs) and a trailing stop based on the Chande Dynamic Convergence Divergence (CDC) ATR method.
Components:
Exponential Moving Averages (EMAs):
60-period EMA (Blue Line): Faster-moving average that reacts more quickly to price changes.
90-period EMA (Red Line): Slower-moving average that provides a smoother indication of long-term price direction.
MACD Indicator:
Utilized to confirm the trend direction. When the MACD line is above its signal line, it may indicate a bullish trend. Conversely, when the MACD line is below its signal line, it may indicate a bearish trend.
CDC Trailing Stop ATR:
Used to set dynamic stop-loss levels that adjust with market volatility. This stop is based on the Average True Range (ATR) with a user-defined multiplier, providing the strategy with a flexible way to protect against adverse price movements.
Profit Targets:
Based on a multiple of the ATR, this sets an objective level at which to take profits, ensuring gains are captured while potentially still leaving room for further profitable movement.
Trading Rules:
Entry:
Long (Buy) Entry Conditions:
Price is above the 60-period EMA.
The 60-period EMA is above the 90-period EMA.
The MACD line is above its signal line.
Price is above the calculated CDC Trailing Stop ATR level.
Short (Sell) Entry Conditions:
Price is below the 60-period EMA.
The 60-period EMA is below the 90-period EMA.
The MACD line is below its signal line.
Price is below the calculated CDC Trailing Stop ATR level.
Exit:
Long (Buy) Exit Conditions:
Price reaches the predetermined profit target based on the ATR.
Price drops below the CDC Trailing Stop ATR level.
Short (Sell) Exit Conditions:
Price reaches the predetermined profit target based on the ATR.
Price rises above the CDC Trailing Stop ATR level.
Visualization:
The strategy displays the 60-period and 90-period EMAs on the chart.
The CDC Trailing Stop ATR levels for both long and short trades are also plotted for clarity.
The MACD Histogram is shown to visualize the difference between the MACD line and its signal line.
Recommendations: Before deploying this strategy, traders should backtest it across various historical data sets and market conditions. Regularly reviewing and potentially adjusting the strategy is recommended as market dynamics evolve.

Southern Star Shadows with AlertThe "Southern Star Shadows with Alert" indicator in Pine Script is designed to identify and visually represent a specific candlestick pattern known as the "Southern Star Shadows" pattern on a TradingView chart. This pattern can provide traders with potential signals for both bullish and bearish market conditions.
Here's a short description of how the indicator works:
Pattern Identification: The indicator scans price data to identify the conditions that constitute a "Southern Star Shadows" pattern. It checks for a combination of factors, including the relationship between the current and previous candle's high, low, open, and close prices.
Signal Generation: The indicator assigns a signal based on the identified pattern. It generates a "1" for a bullish signal and "-1" for a bearish signal. If the pattern conditions are not met, it assigns a "0," indicating no clear signal.
Visualization: The indicator visually represents the signals by coloring the price bars. Bullish signals are typically colored in blue, while bearish signals are colored in red.
Triangle Plots: Additionally, the indicator plots small triangle shapes above the respective candles to highlight where the pattern occurred. Green triangles are used for bullish signals, and red triangles are used for bearish signals.
Alerts: Traders can set up alerts based on the indicator. When the pattern is detected and a signal is generated, the indicator sends an alert message, providing traders with a timely notification of potential trading opportunities.
Overall, the "Southern Star Shadows with Alert" indicator helps traders identify and react to potential trend reversal or continuation opportunities in the market by recognizing specific candlestick patterns and providing visual and alert-based signals.

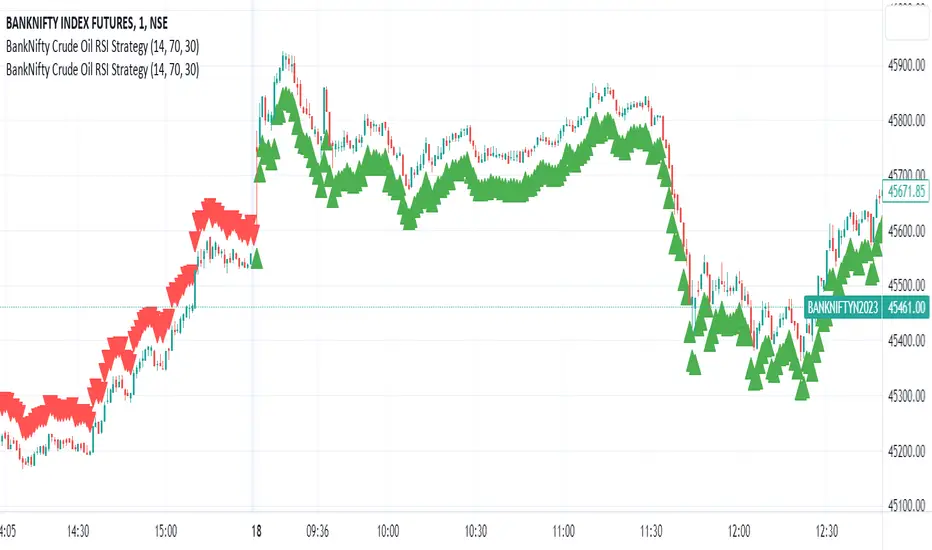
BankNifty Crude Oil RSI Strategy
The "BankNifty Crude Oil RSI Strategy" is a trading strategy that combines the BankNifty index with the WTI Crude Oil price index using the Relative Strength Index (RSI) as the primary indicator. The strategy aims to generate buy and sell signals based on the RSI of the Crude Oil price index, which might influence the BankNifty index.
Here's how the strategy works step by step:
Data Fetching:
The strategy fetches the daily closing prices of WTI Crude Oil from the provided TradingView link "TVC:USOIL" using the request.security function.
RSI Calculation:
The Relative Strength Index (RSI) is calculated using the closing prices of WTI Crude Oil. The RSI is a momentum oscillator that measures the speed and change of price movements. It oscillates between 0 and 100, indicating overbought conditions when above a specified threshold (overbought level) and oversold conditions when below a specified threshold (oversold level).
Buy and Sell Conditions:
The strategy defines two conditions based on the RSI values:
Buy Signal: When the Crude Oil RSI falls below a specified rsiOversold level (default is 30), the strategy generates a buy signal. This implies that the Crude Oil is in an oversold condition, and there might be a potential buying opportunity in the BankNifty index.
Sell Signal: When the Crude Oil RSI rises above a specified rsiOverbought level (default is 70), the strategy generates a sell signal. This implies that the Crude Oil is in an overbought condition, and there might be a potential selling opportunity in the BankNifty index.
Buy and Sell Signal Visualization:
The strategy uses the plotshape function to plot triangular shapes (upward for buy and downward for sell) below and above the price bars, respectively, to indicate the buy and sell signals on the chart visually.
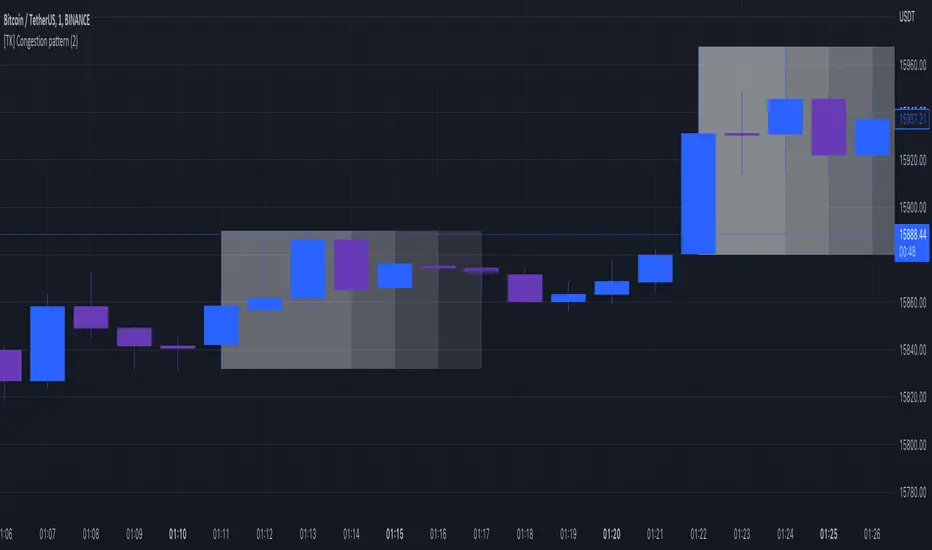
[TK] Congestion patternDraw on your chart the congestion zone.
The exit of the congestion zone is an interesting time for trading.
How is calculated the congestion zone ?
If the candle close in the range of the previous candle : this is a continuation of the congestion zone
if the candle close out of the range of the previous candle : the congestion zone is over