cashdata by farashahThis indicator is designed to generate wave charts following the NeoWave method.
NeoWave, developed by Glenn Neely in 1990, offers a scientific and objective approach to wave analysis.
A Cash Data is essential for accurate analysis, requiring highs and lows to be plotted in the exact order they occurred—a process that can be complex and time-consuming.
The indicator automates this process by identifying highs and lows for any symbol and timeframe, plotting them in real-time.
For instance, on a monthly timeframe, it finds yearly highs and lows and arranges them sequentially, forming a "Yearly Wave Chart" for NeoWave analysis.
•Generates Wave Charts for multiple timeframes(yearly, monthly, weekly, daily, hourly, minutely).
• Provides real-time auto-updating Wave Charts.
• Supports plotting based on calendar time, bar count, or equal distances.
• Compatible with all account types.
Tìm kiếm tập lệnh với "chart"

Mile Runner - Swing Trade LONGMile Runner - Swing Trade LONG Indicator - By @jerolourenco
Overview
The Mile Runner - Swing Trade LONG indicator is designed for swing traders who focus on LONG positions in stocks, BDRs (Brazilian Depositary Receipts), and ETFs. It provides clear entry signals, stop loss, and take profit levels, helping traders identify optimal buying opportunities with a robust set of technical filters. The indicator is optimized for daily candlestick charts and combines multiple technical analysis tools to ensure high-probability trades.
Key Features
Entry Signals: Visualized as green triangles below the price bars, indicating a potential LONG entry.
Stop Loss and Take Profit Levels: Automatically plotted on the chart for easy reference.
Stop Loss: Based on the most recent pivot low (support level).
Take Profit: Calculated using a Fibonacci-based projection from the entry price to the stop loss.
Trend and Momentum Filters: Ensures trades align with the prevailing trend and have sufficient momentum.
Volume and Volatility Confirmation: Verifies market interest and price movement potential.
How It Works
The indicator uses a combination of technical tools to filter and confirm trade setups:
Exponential Moving Averages (EMAs):
A short EMA (default: 9 periods) and a long EMA (default: 21 periods) identify the trend.
A bullish crossover (EMA9 crosses above EMA21) signals a potential upward trend.
Money Flow Index (MFI):
Confirms buying pressure when MFI > 50.
Average True Range (ATR):
Ensures sufficient volatility by checking if ATR exceeds its 20-period moving average.
Volume:
Confirms market interest when volume exceeds its 20-period moving average.
Pivot Lows:
Identifies recent support levels (pivot lows) to set the stop loss.
Ensures the pivot low is recent (within the last 10 bars by default).
Additional Trend Filter:
Confirms the long EMA is rising, reinforcing the bullish trend.
Inputs and Customization
The indicator is highly customizable, allowing traders to tailor it to their strategies:
EMA Periods: Adjust the short and long EMA lengths.
ATR and MFI Periods: Modify lookback periods for volatility and momentum.
Pivot Lookback: Control the sensitivity of pivot low detection.
Fibonacci Level: Adjust the Fibonacci retracement level for take profit.
Take Profit Multiplier: Fine-tune the aggressiveness of the take profit target.
Max Pivot Age: Set the maximum bars since the last pivot low for relevance.
Usage Instructions
Apply the Indicator:
Add the "Mile Runner - Swing Trade LONG" indicator to your TradingView chart.
Best used on daily charts for swing trading.
Look for Entry Signals:
A green triangle below the price bar signals a potential LONG entry.
Set Stop Loss and Take Profit:
Stop Loss: Red dashed line indicating the stop loss level.
Take Profit: Purple dashed line showing the take profit level.
Monitor the Trade:
The entry price is marked with a green dashed line for reference.
Adjust trade management based on the plotted levels.
Set Alerts:
Use the built-in alert condition to get notified of new LONG entry signals.
Important Notes
For LONG Positions Only : Designed exclusively for swing trading LONG positions.
Timeframe: Optimized for daily charts but can be tested on other timeframes.
Asset Types: Works best with stocks, BDRs, and ETFs.
Risk Management: Always align stop loss and take profit levels with your risk tolerance.
Why Use Mile Runner?
The Mile Runner indicator simplifies swing trading by integrating trend, momentum, volume, and volatility filters into one user-friendly tool. It helps traders:
Identify high-probability entry points.
Establish clear stop loss and take profit levels.
Avoid low-volatility or low-volume markets.
Focus on assets with strong buying pressure and recent support.
By following its signals and levels, traders can make informed decisions and enhance their swing trading performance. Customize the inputs and test it on your favorite assets—happy trading!

Motivational Text TableRelease Notes - Motivational Text Table Indicator v1.0
Standalone Indicator:
A new, standalone Pine Script v6 indicator that displays a motivational text table directly on the chart.
Customizable Text:
Users can set their own motivational message through the "Custom Motivational Text" input.
Configurable Appearance:
Change the text color and background color of the table.
Adjust the text size by choosing from "tiny", "small", "normal", "large", or "huge".
Select the table’s position on the chart from multiple preset locations (e.g., top_left, middle_center, bottom_right, etc.).
Static Display:
The table is drawn on the last bar, ensuring that the motivational text remains static during realtime updates.
User-Friendly Design:
The interface is simple and easy to customize, making it perfect for users who need a daily dose of motivation directly on their TradingView charts.
Enjoy your motivational boost on every chart!

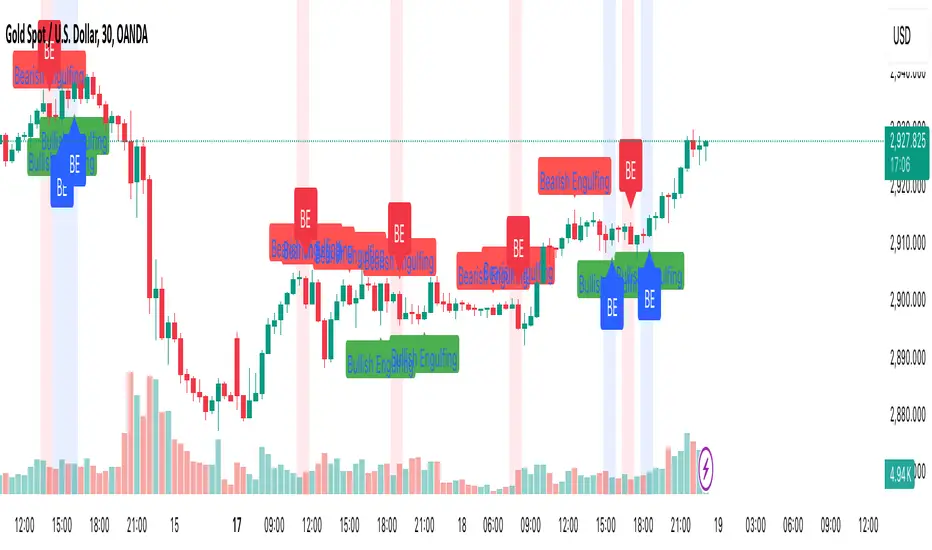
Engulfing Candle PatternIndicator Overview
This indicator identifies Bullish and Bearish Engulfing candlestick patterns on a price chart. These patterns are reversal signals:
Bullish Engulfing: Occurs during a downtrend, where a bullish candle fully engulfs the body of the previous bearish candle.
Bearish Engulfing: Occurs during an uptrend, where a bearish candle fully engulfs the body of the previous bullish candle.
Key Features
1. Pattern Detection:
Detects Bullish Engulfing and Bearish Engulfing patterns based on candle body comparisons.
Uses the current and previous candle's open/close prices to determine engulfing conditions.
2. Visualization:
Plots labels on the chart:
" Bullish Engulfing " below the candle for bullish patterns.
" Bearish Engulfing " above the candle for bearish patterns.
3. Alerts:
Triggers alerts when either pattern is detected, allowing traders to take action.
How It Works
Bullish Engulfing Condition:
Current candle is bullish (close > open).
Previous candle is bearish (close < open).
Current candle's body fully engulfs the previous candle's body.
Bearish Engulfing Condition:
- Current candle is bearish (close < open).
- Previous candle is bullish (close > open).
- Current candle's body fully engulfs the previous candle's body.
Usage
- Apply the script to any chart in TradingView.
- Look for " Bullish Engulfing " or " Bearish Engulfing " labels on the chart.
- Set up alerts to get notified when these patterns form.
This indicator is a simple yet effective tool for identifying potential trend reversals using engulfing candlestick patterns.
Previous HTF Highs, Lows & Equilibriums [dani]Previous HTF Highs, Lows & Equilibriums
Indicator Description
This powerful and user-friendly indicator is designed to help traders visualize key levels from multiple higher timeframes directly on their chart. It plots the previous session's high, low, and equilibrium (EQ) levels for up to 4 customizable timeframes, allowing you to analyze price action across different time horizons simultaneously.
Key Features
Multi-Timeframe Support:
Choose up to 4 higher timeframes (e.g., 1H, 4H, 1D, 1W) to plot levels on your chart.
Each timeframe's levels are displayed with clear, customizable lines.
Previous Session Levels:
Plots the previous session's high, low, and EQ (EQ = (high + low) / 2) for each selected timeframe.
Levels are dynamically updated at the start of each new session.
Customizable Line Styles:
Choose between solid, dashed, or dotted lines for each level.
Customize colors for high, low, and EQ levels to suit your preferences.
Dynamic Labels:
Each level is labeled with the corresponding timeframe (e.g., "1D - H" for daily high, "4H - L" for 4-hour low).
Labels are positioned dynamically to avoid clutter and ensure readability.
Toggle On/Off:
Easily toggle the visibility of all levels with a single button, making it simple to declutter your chart when needed.
Compatible with All Markets:
Works seamlessly across all instruments (stocks, forex, crypto, futures, etc.) and timeframes.
How to Use?
Add the indicator to your chart.
Select up to 4 higher timeframes to plot levels.
Customize line styles and colors to match your trading style.
Use the levels as reference points for support/resistance, breakout zones, or confluence areas.
Toggle levels on/off as needed to keep your chart clean and focused.
Disclaimer & Chat
This indicator is not a trading signal generator. It does not predict market direction or provide buy/sell signals. Instead, it is a tool to help you visualize key levels from higher timeframes, enabling you to make more informed trading decisions. Always combine this tool with your own analysis, risk management, and trading strategy.
Thank you for choosing this indicator! I hope it becomes a valuable part of your trading toolkit. Remember, trading is a journey, and having the right tools can make all the difference. Whether you're a seasoned trader or just starting out, this indicator is designed to help you stay organized and focused on what matters most—price action. Happy trading, and may your charts be ever in your favor! 😊
From, Dani.

the rainbow unicornScript Name: The Rainbow Unicorn
Description:
The Rainbow Unicorn is a unique visual indicator designed to add a touch of color and fun to your trading charts. This indicator colors the bars, wicks, and borders using rainbow colors, making technical analysis more enjoyable and visually appealing.
Features:
Rainbow Colors: Bars, wicks, and borders are colored in red, orange, yellow, green, blue, and purple, creating a dynamic rainbow effect.
Customization: Colors are applied cyclically, offering a continuous and smooth visualization of market data.
Ease of Use: No complex configuration is required. Simply add the indicator to your chart to see the rainbow colors in action.
How It Works:
The indicator uses a function to generate rainbow colors and applies them to the bars on the chart based on their index. The colors are defined in an array and are applied cyclically, meaning each bar receives a different rainbow color.
Usage:
Add the "The Rainbow Unicorn" indicator to your chart.
Observe the rainbow-colored bars for a more visual and fun trading experience.
Use this indicator in conjunction with your other technical analysis tools for better visualization of trends and price movements.
Underlying Concepts:
This indicator is primarily designed to enhance the visual experience of traders by adding vibrant and dynamic colors to the charts. It does not rely on complex calculations or trend detection methods but aims to make technical analysis more enjoyable and engaging.

Dynamic Customizable 50% Line & Daily High/Low + True Day OpenA Unique Indicator for Precise Market-Level Analysis
This indicator is a fully integrated solution that automates complex market-level calculations and visualizations, offering traders a tool that goes beyond the functionality of existing open-source alternatives. By seamlessly combining several trading concepts into a single script, it delivers efficiency, accuracy, and customization that cater to both novice and professional traders.
Key Features: A Breakdown of What Makes It Unique
1. Adaptive Daily Highs and Lows
Automatically detects and plots daily high and low levels based on the selected time frame, dynamically updating in real time.
Features session-based adjustments, allowing traders to focus on levels that matter for specific trading sessions (e.g., London, New York).
Fully customizable styling, visibility, and alerts tailored to each trader’s preferences.
How It Works:
The indicator calculates daily high and low levels directly from price data, integrating session-specific time offsets to account for global trading hours. These levels provide traders with clear visual markers for key liquidity zones.
2. Automated ICT 50% Range Line
A pioneering implementation of ICT’s mid-range concept, this feature dynamically calculates and displays the midpoint of the daily range.
Offers traders a visual guide to identify premium and discount zones, aiding in determining market bias and potential trade setups.
How It Works:
The script calculates the range between the day’s high and low, dividing it by two to generate the midline. This line updates in real-time, ensuring that traders always see the most current premium and discount levels as price action evolves.
3. Dynamic Market Open Levels
Plots session opens (e.g., Asia, London, New York) and the True Day Open to provide actionable reference points for intra-day trading strategies.
Enhances precision in identifying liquidity shifts and aligning trades with institutional price movements.
How It Works:
The indicator uses predefined session times to calculate and display the opening levels for key trading sessions. It dynamically adjusts for time zones, ensuring accuracy regardless of the trader’s location.
4. Custom Watermark for Enhanced Visualization
Includes an optional watermark feature that allows users to display custom text on their charts.
Ideal for personalization, branding, or highlighting session notes without disrupting the clarity of the chart.
Why This Indicator Stands Out
First-to-Market Automation:
While the ICT 50% range line is a widely recognized concept, this is the first script to automate its calculation, combining it with other pivotal trading levels in a single tool.
All-in-One Functionality:
Unlike open-source alternatives that focus on individual features, this script integrates daily highs/lows, mid-range levels, session opens, and customizable watermarks into one cohesive system. The consolidation reduces the need for multiple indicators and ensures a clean, efficient chart setup.
Dynamic Customization:
Every feature can be adjusted to align with a trader’s strategy, time zone, or aesthetic preferences. This level of adaptability is unmatched in existing tools.
Proprietary Logic:
The indicator’s underlying calculations are built from scratch, leveraging advanced programming techniques to ensure accuracy and reliability. These proprietary methods differentiate it from similar open-source scripts.
How to Use This Indicator
Apply the Indicator:
Add it to your TradingView chart from the library.
Configure Settings:
Use the intuitive settings panel to adjust plotted levels, colors, styles, and visibility. Tailor the indicator to your trading strategy.
Incorporate into Analysis:
Combine the plotted levels with your preferred trading approach to identify liquidity zones, establish market bias, and pinpoint potential reversals or entries.
Stay Focused:
With all key levels automated and updated in real time, traders can focus on execution rather than manual plotting.
Originality and Justification for Closed Source
This script is closed-source due to its unique combination of features and proprietary logic that automates complex trading concepts like the ICT 50% range line and session-specific levels. Open-source alternatives lack this level of integration and customization, making this indicator a valuable and original contribution to the TradingView ecosystem.
What Sets It Apart from Open-Source Scripts?
Unlike open-source tools, this indicator doesn’t just replicate individual features—it enhances and integrates them into a seamless, all-in-one solution that offers traders a more efficient and effective way to analyze the market.

Comprehensive Trading Toolkit [BigBeluga]Trading Toolkit is a comprehensive indicator inspired by the trading strategies of the renowned crypto influencer Michaël van de Poppe . This tool combines RSI divergences, correction zones, and advanced support/resistance levels to provide traders with a robust framework for analyzing market movements.
🔵 Key Features:
RSI Divergences on Chart:
Automatically identifies and plots RSI divergences (bullish and bearish) directly on the main price chart.
Green lines indicate bullish divergences, suggesting potential upward reversals.
Red lines indicate bearish divergences, signaling possible downward movements.
Correction Boxes:
Traders typically define a correction as a drop in value of 10% or more. This drop can happen over a few hours or a few days. Also, it can last for less than 24 hours or many months.
This indicator visualizes corrections with blue shaded boxes, triggered by a percentage decline defined in the settings.
The boxes highlight sharp price drops, helping traders identify significant market movements quickly.
Advanced Support and Resistance Levels:
Dynamically detects key support and resistance levels based on price pivots.
When the price is above a level, it plots a green shaded area from the cross point, marking support.
When the price drops below a level, it plots a red shaded area, highlighting resistance.
Dashed lines indicate weaker levels, while solid lines represent stronger, more reliable levels.
🔵 Usage:
Identify Divergences: Use plotted RSI divergences to detect potential market reversals and align them with price action.
Analyze Correction Zones: Utilize correction boxes to evaluate significant price declines and find potential buying opportunities during these corrections.
Leverage Support and Resistance Levels: Confirm breakouts, reversals, or consolidation zones with the color-coded areas.
Enhance Risk Management: Combine divergences and correction zones to set informed stop-loss or take-profit levels.
Trading Toolkit empowers traders with actionable insights into market trends, corrections, and support/resistance dynamics, making it an invaluable tool for crypto and forex markets.

HOD/LOD/PMH/PML/PDH/PDL Strategy by @tradingbauhaus This script is a trading strategy @tradingbauhaus designed to trade based on key price levels, such as the High of Day (HOD), Low of Day (LOD), Premarket High (PMH), Premarket Low (PML), Previous Day High (PDH), and Previous Day Low (PDL). Below, I’ll explain in detail what the script does:
Core Functionality of the Script:
Calculates Key Price Levels:
HOD (High of Day): The highest price of the current day.
LOD (Low of Day): The lowest price of the current day.
PMH (Premarket High): The highest price during the premarket session (before the market opens).
PML (Premarket Low): The lowest price during the premarket session.
PDH (Previous Day High): The highest price of the previous day.
PDL (Previous Day Low): The lowest price of the previous day.
Draws Horizontal Lines on the Chart:
Plots horizontal lines on the chart for each key level (HOD, LOD, PMH, PML, PDH, PDL) with specific colors for easy visual identification.
Defines Entry and Exit Rules:
Long Entry (Buy): If the price crosses above the PMH (Premarket High) or the PDH (Previous Day High).
Short Entry (Sell): If the price crosses below the PML (Premarket Low) or the PDL (Previous Day Low).
Long Exit: If the price reaches the HOD (High of Day) during a long position.
Short Exit: If the price reaches the LOD (Low of Day) during a short position.
How the Script Works Step by Step:
Calculates Key Levels:
Uses the request.security function to fetch the HOD and LOD of the current day, as well as the highs and lows of the previous day (PDH and PDL).
Calculates the PMH and PML during the premarket session (before 9:30 AM).
Plots Levels on the Chart:
Uses the plot function to draw horizontal lines on the chart representing the key levels (HOD, LOD, PMH, PML, PDH, PDL).
Each level has a specific color for easy identification:
HOD: White.
LOD: Purple.
PDH: Orange.
PDL: Blue.
PMH: Green.
PML: Red.
Defines Trading Rules:
Uses conditions with ta.crossover and ta.crossunder to detect when the price crosses key levels.
Long Entry: If the price crosses above the PMH or PDH, a long position (buy) is opened.
Short Entry: If the price crosses below the PML or PDL, a short position (sell) is opened.
Long Exit: If the price reaches the HOD during a long position, the position is closed.
Short Exit: If the price reaches the LOD during a short position, the position is closed.
Executes Orders Automatically:
Uses the strategy.entry and strategy.close functions to open and close positions automatically based on the defined rules.
Advantages of This Strategy:
Based on Key Levels: Uses important price levels that often act as support and resistance.
Easy to Visualize: Horizontal lines on the chart make it easy to identify levels.
Automated: Entries and exits are executed automatically based on the defined rules.
Limitations of This Strategy:
Dependent on Volatility: Works best in markets with significant price movements.
False Crosses: There may be false crosses that generate incorrect signals.
No Advanced Risk Management: Does not include dynamic stop-loss or take-profit mechanisms.
How to Improve the Strategy:
Add Stop-Loss and Take-Profit: To limit losses and lock in profits.
Filter Signals with Indicators: Use RSI, MACD, or other indicators to confirm signals.
Optimize Levels: Adjust key levels based on the asset’s behavior.
In summary, this script is a trading strategy that operates based on key price levels, such as HOD, LOD, PMH, PML, PDH, and PDL. It is useful for traders who want to trade based on significant support and resistance levels.

Weekly and daily separators - MKThis indicator is designed to provide easier usability and greater customization for traders. The update brings enhanced stability and reliability in detecting day, week, and month changes across various timeframes, ensuring consistent and accurate visuals on your charts.
Key Features:
Time Zone Customization: Select the time zone to determine when session changes are marked.
Adjustable Line Coverage: Lines can now be customized to only partially cover the top and bottom of the chart, offering a cleaner look.
Optional Labels: Enable labels to display the starting month, calendar week, or day. Day formats include:
Weekday name
Date in formats: dd.MM or MM.dd
Visual Enhancements:
Default line widths and colors now use an orange hue for better visibility.
Added a monthly separator line for better long-term trend tracking.
Higher time frame color options for clarity.
Independent customization of line styles and widths.
Additional Improvements:
Ability to hide daily lines on daily charts and higher timeframes. Similarly, weekly lines can be hidden on weekly charts and higher.
Secondary line width for weekly separators on daily and higher timeframes, ensuring cleaner chart aesthetics.
Updated color selection and default values for better readability.

Fibonacci Time-Price Zones🟩 Fibonacci Time-Price Zones is a chart visualization tool that combines Fibonacci ratios with time-based and price-based geometry to analyze market behavior. Unlike typical Fibonacci indicators that focus solely on horizontal price levels, this indicator incorporates time into the analysis, providing a more dynamic perspective on price action.
The indicator offers multiple ways to visualize Fibonacci relationships. Drawing segmented circles creates a unique perspective on price action by incorporating time into the analysis. These segmented circles, similar to TradingView's built-in Fibonacci Circles, are derived from Fibonacci time and price levels, allowing traders to identify potential turning points based on the dynamic interaction between price and time.
As another distinct visualization method, the indicator incorporates orthogonal patterns, created by the intersection of horizontal and vertical Fibonacci levels. These intersections form L-shaped connections on the chart, derived from key Fibonacci price and time intervals, highlighting potential areas of support or resistance at specific points in time.
In addition to these geometric approaches, another option is sloped lines, which project Fibonacci levels that account for both time and price along the trendline. These projections derive their angles from the interplay between Fibonacci price levels and Fibonacci time intervals, creating dynamic zones on the chart. The slope of these lines reflects the direction and angle of the trend, providing a visual representation of price alignment with market direction, while maintaining the time-price relationship unique to this indicator
The indicator also includes horizontal Fibonacci levels similar to traditional retracement and extension tools. However, unlike standard tools, traders can display retracement levels, extension levels, or both simultaneously from a single instance of the indicator. These horizontal levels maintain consistency with the chosen visualization method, automatically scaling and adapting whether used with circles, orthogonal patterns, or slope-based analysis.
By combining these distinct methods—circles, orthogonal patterns, sloped projections, and horizontal levels—the indicator provides a comprehensive approach to Fibonacci analysis based on both time and price relationships. Each visualization method offers a unique perspective on market structure while maintaining the core principle of time-price interaction.
⭕ THEORY AND CONCEPT ⭕
While traditional Fibonacci tools excel at identifying potential support and resistance levels through price-based ratios (0.236, 0.382, 0.618), they do not incorporate the dimension of time in market analysis. Extensions and retracements effectively measure price relationships within trends, yet markets move through both price and time dimensions simultaneously.
Fibonacci circles represent an evolution in technical analysis by incorporating time intervals alongside price levels. Based on the mathematical principle that markets often move in circular patterns proportional to Fibonacci ratios, these circles project potential support and resistance zones as partial circles radiating from significant price points. However, traditional circle-based tools can create visual complexity that obscures key market relationships. The integration of time into Fibonacci analysis reveals how price movements often respect both temporal and price-based ratios, suggesting a deeper geometric structure to market behavior.
The Fibonacci Time-Price Zones indicator advances these concepts by providing multiple geometric approaches to visualize time-price relationships. Each shape option—circles, orthogonal patterns, slopes, and horizontal levels—represents a different mathematical perspective on how Fibonacci ratios manifest across both dimensions. This multi-faceted approach allows traders to observe how price responds to Fibonacci-based zones that account for both time and price movements, potentially revealing market structure that purely price-based tools might miss.
Shape Options
The indicator employs four distinct geometric approaches to analyze Fibonacci relationships across time and price dimensions:
Circular : Represents the cyclical nature of market movements through partial circles, where each radius is scaled by Fibonacci ratios incorporating both time and price components. This geometry suggests market movements may follow proportional circular paths from significant pivot points, reflecting the harmonic relationship between time and price.
Orthogonal : Constructs L-shaped patterns that separate the time and price components of Fibonacci relationships. The horizontal component represents price levels, while the vertical component measures time intervals, allowing analysis of how these dimensions interact independently at key market points.
Sloped : Projects Fibonacci levels along the prevailing trend, incorporating both time and price in the angle of projection. This approach suggests that support and resistance levels may maintain their relationship to price while adjusting to the temporal flow of the market.
Horizontal : Provides traditional static Fibonacci levels that serve as a reference point for comparing price-only analysis with the dynamic time-price relationships shown in the other three shapes. This baseline approach allows traders to evaluate how the incorporation of time dimension enhances or modifies traditional Fibonacci analysis.
By combining these geometric approaches, the Fibonacci Time-Price Zones indicator creates a comprehensive analytical framework that bridges traditional and advanced Fibonacci analysis. The horizontal levels serve as familiar reference points, while the dynamic elements—circular, orthogonal, and sloped projections—reveal how price action responds to temporal relationships. This multi-dimensional approach enables traders to study market structure through various geometric lenses, providing deeper insights into time-price symmetry within technical analysis. Whether applied to retracements, extensions, or trend analysis, the indicator offers a structured methodology for understanding how markets move through both price and time dimensions.
🛠️ CONFIGURATION AND SETTINGS 🛠️
The Fibonacci Time-Price Zones indicator offers a range of configurable settings to tailor its functionality and visual representation to your specific analysis needs. These options allow you to customize zone visibility, structures, horizontal lines, and other features.
Important Note: The indicator's calculations are anchored to user-defined start and end points on the chart. When switching between charts with significantly different price scales (e.g., from Bitcoin at $100,000 to Silver at $30), adjustment of these anchor points is required to ensure correct positioning of the Fibonacci elements.
Fibonacci Levels
The indicator allows users to customize Fibonacci levels for both retracement and extension analysis. Each level can be individually configured with the following options:
Visibility : Toggle the visibility of each level to focus on specific areas of interest.
Level Value : Set the Fibonacci ratio for the level, such as 0.618 or 1.000, to align with your analysis needs.
Color : Customize the color of each level for better visual clarity.
Line Thickness : Adjust the line thickness to emphasize critical levels or maintain a cleaner chart.
Setup
Zone Type : Select which Fibonacci zones to display:
- Retracement : Shows potential pull back levels within the trend
- Extension : Projects levels beyond the trend for potential continuation targets
- Both : Displays both retracement and extension zones simultaneously
Shape : Choose from four visualization methods:
- Circular : Time-price based semicircles centered on point B
- Orthogonal : L-shaped patterns combining time and price levels
- Sloped : Trend-aligned projections of Fibonacci levels
- Horizontal : Traditional horizontal Fibonacci levels
Visual Settings
Fill % : Adjusts the fill intensity of zones:
0% : No fill between levels
100% : Maximum fill between levels
Lines :
Trendline : The base A-B trend with customizable color
Extension : B-C projection line
Retracement : B-D pullback line
Labels :
Points : Show/hide A, B, C, D markers
Levels : Show/hide Fibonacci percentages
Time-Price Points
Set the time and price for the points that define the Fibonacci zones and horizontal levels. These points are defined upon loading the chart. These points can be configured directly in the settings or adjusted interactively on the live chart.
A and B Points : These user-defined time and price points determine the basis for calculating the semicircles and Fibonacci levels. While the settings panel displays their exact values for fine-tuning, the easiest way to modify these points is by dragging them directly on the chart for quick adjustments.
Interactive Adjustments : Any changes made to the points on the chart will automatically synchronize with the settings panel, ensuring consistency and precision.
🖼️ CHART EXAMPLES 🖼️
Fibonacci Time-Price Zones using the 'Circular' Shape option. Note the price interaction at the 0.786 level, which acts as a support zone. Additional points of interest include resistance near the 0.618 level and consolidation around the 0.5 level, highlighting the utility of both horizontal and semicircular Fibonacci projections in identifying key price areas.
Fibonacci Time-Price Zones using the 'Sloped' Shape option. The chart displays price retracing along the sloped Fibonacci levels, with blue arrows highlighting potential support zones at 0.618 and 0.786, and a red arrow indicating potential resistance at the 1.0 level. This visual representation aligns with the prevailing downtrend, suggesting potential selling pressure at the 1.0 Fibonacci level.
Fibonacci Time-Price Zones using the 'Orthogonal' Shape option. The chart demonstrates price action interacting with vertical zones created by the orthogonal lines at the 0.618, 0.786, and 1.0 Fibonacci levels. Blue arrows highlight potential support areas, while red arrows indicate potential resistance areas, revealing how the orthogonal lines can identify distinct points of price interaction.
Fibonacci Time-Price Zones using the 'Circular' Shape option. The chart displays price action in relation to segmented circles emanating from the starting point (point A). The circles represent different Fibonacci ratios (0.382, 0.5, 0.618, 0.786) and their intersections with the price axis create potential zones of support and resistance. This approach offers a visually distinct way to analyze potential turning points based on both price and time.
Fibonacci Time-Price Zones using the 'Sloped' Shape option. The sloped Fibonacci levels (0.786, 0.618, 0.5) create zones of potential support and resistance, with price finding clear interaction within these areas. The ellipses highlight this price action, particularly the support between 0.786 and 0.618, which aligns closely with the trend.
Fibonacci Time-Price Zones using the 'Circular' Shape option. The price action appears to be ‘hugging’ the 0.5 Fibonacci level, suggesting potential resistance. This demonstrates how the circular zones can identify potential turning points and areas of consolidation which might not be seen with linear analysis.
Fibonacci Time-Price Zones using the 'Sloped' Shape option with Point D marker enabled. The chart demonstrates clear price action closely following along the sloped Retracement line until the orthogonal intersection at the 0.618 levels where the trend is broken and price dips throughout the 0.618 to 0.786 horizontal zone. Price jumps back to the retracement slope at the start of the 0.786 horizontal zone and continues to the 1.0 horizontal zone. The aqua-colored retracement line is enabled to further emphasize this retracement slope .
Geometric validation using TradingView's built-in Fibonacci Circle tool (overlaid). The alignment at the 0.5 and 1.0 levels demonstrates the indicator's consistent approximation of Fibonacci Circles.
Comparison of Fibonacci Time-Price Zones (Shape: Horizontal) with TradingView's Built-in Retracement and Extension Tools (overlaid): This example demonstrates how the Horizontal structure aligns with TradingView’s retracement and extension levels, allowing users to integrate multiple tools seamlessly. The Fibonacci circle connects retracement and extension zones, highlighting the potential relationship between past retracements and future extensions.
📐 GEOMETRIC FOUNDATIONS 📐
This indicator integrates circular and straight representations of Fibonacci levels, specifically the Circular , Orthogonal , Sloped , and Horizontal shape options. The geometric principles behind these shapes differ significantly, requiring distinct scaling methods for accurate representation. The Circular shape employs logarithmic scaling with radial expansion, where the distance from a central point determines the level's position, creating partial circles that align with TradingView's built-in Fibonacci Circle tool. The other three shapes utilize geometric progression scaling for linear extension from a starting point, resulting in straight lines that align with TradingView's built-in Fibonacci retracement and extension tools. Due to these distinct geometric foundations and scaling methods, perfectly aligning both the partial circles and straight lines simultaneously is mathematically constrained, though any differences are typically visually imperceptible.
The Circular shape's partial circles are calculated and scaled to align with TradingView's built-in Fibonacci Circles. These circles are plotted from the second swing point onward. This approach ensures consistent and accurate visualization across all market types, including those with gaps or closed sessions, which unlike 24/7 markets, do not have a direct one-to-one correspondence between bar indices and time. To maintain accurate geometric proportions across varying chart scales, the indicator calculates an aspect ratio by normalizing the proportional difference between vertical (price) and horizontal (time) distances of the swing points. This normalization factor ensures geometric shapes maintain their mathematical properties regardless of price scale magnitude or time period span, while maintaining the correct proportions of the geometric constructions at any chart zoom level.
The indicator automatically applies the appropriate scaling factor based on the selected shape option, optimizing either circular proportions and proper radius calculations for each Fibonacci level, or straight-line relationships between Fibonacci levels. These distinct scaling approaches maintain mathematical integrity while preserving the essential characteristics of each geometric representation, ensuring optimal visualization accuracy whether using circular or linear shapes.
⚠️ DISCLAIMER ⚠️
The Fibonacci Time-Price Zones indicator is a visual analysis tool designed to illustrate Fibonacci relationships through geometric constructions incorporating both curved and straight lines, providing a structured framework for identifying potential areas of price interaction. It is not intended as a predictive or standalone trading signal indicator.
The indicator calculates levels and projections using user-defined anchor points and Fibonacci ratios. While it aims to align with TradingView’s Fibonacci extension, retracement, and circle tools by employing mathematical and geometric formulas, no guarantee is made that its calculations are identical to TradingView's proprietary methods.
Like all technical and visual indicators, these visual representations may visually align with key price zones in hindsight, reflecting observed price dynamics. However, these visualizations are not standalone signals for trading decisions and should be interpreted as part of a broader analytical approach.
This indicator is intended for educational and analytical purposes, complementing other tools and methods of market analysis. Users are encouraged to integrate it into a comprehensive trading strategy, customizing its settings to suit their specific needs and market conditions.
🧠 BEYOND THE CODE 🧠
The Fibonacci Time-Price Zones indicator is designed to encourage both education and community engagement. By integrating time-sensitive geometry with Fibonacci-based frameworks, it bridges traditional grid-based analysis with dynamic time-price relationships. The inclusion of semicircles, horizontal levels, orthogonal structures, and sloped trends provides users with versatile tools to explore the interaction between price movements and temporal intervals while maintaining clarity and adaptability.
As an open-source tool, the indicator invites exploration, experimentation, and customization. Whether used as a standalone resource or alongside other technical strategies, it serves as a practical and educational framework for understanding market structure and Fibonacci relationships in greater depth.
Your feedback and contributions are essential to refining and enhancing the Fibonacci Time-Price Zones indicator. We look forward to the creative applications, adaptations, and insights this tool inspires within the trading community.

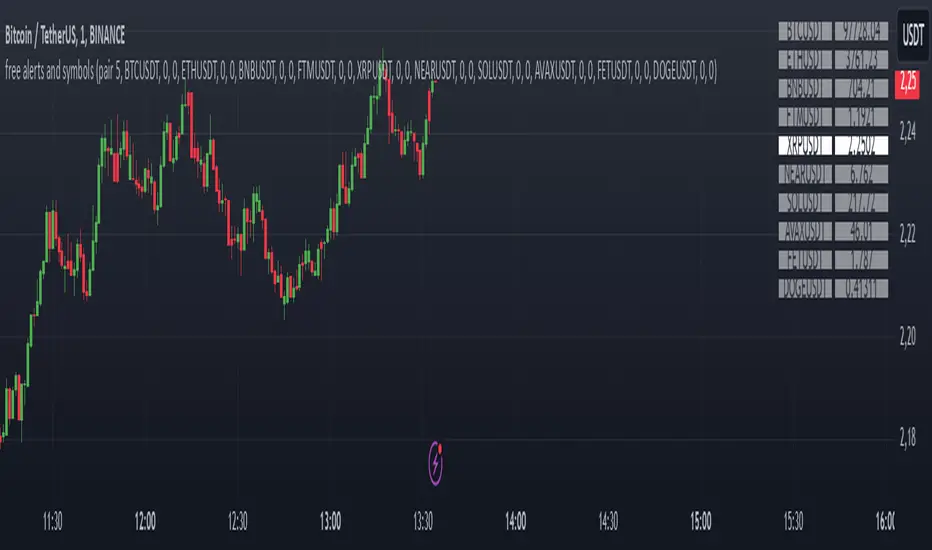
Alerts and symbolswhat is "Alerts and symbols"?
It is an indicator that allows you to watch more trading pairs and add alarms to them.
what it does?
It allows you to set a total of 20 different intersection alarms, 2 in each pair, for 10 different trading pairs at the same time.
It draws the candlestick chart of a pair you choose among 10 trading pairs and the alarm lines you created for this trading pair on the chart.
It also allows you to see the prices of 10 different trading pairs at the same time, thanks to the table it creates.
how to use it?
First, select the alarm pairs you want to use, for example, BTCUSDT pair is the default value for "pair 1". You can choose 10 different trading pairs as you wish. Just below each trading pair, there are two different sections titled "line 1" and "line 2" so that you can set an alarm. Type here the price levels at which you want to be alerted in case of a price crossover.
You can use the "candle source" section to examine the candlestick charts of trading pairs. The indicator draws the candle chart of the trading pair selected in the "candle source" section.
Check the "show alert lines on chart" box to see the levels you have set an alarm for.
When everything is ready, first click on the three dots next to the indicator's name and then on the clock icon. then create an alarm and that's it.
LIT - ConfirmationsOverview
The LIT - Confirmations Indicator is a dynamic checklist tool designed for traders who uses LIT Strategy (Liquidity Inducement Theory) following liquidity and smart money concepts as benefit. This tool allows users to document and track essential trading confirmations directly on their TradingView charts, offering a structured and visual approach to market analysis.
What Makes This Unique?
Unlike other open-source tools, the LIT - Confirmations Indicator introduces a fully interactive and customizable table directly on the chart. This table provides real-time feedback with clear ✅ (checked) and ❌ (unchecked) visual indicators for each confirmation. The user can position the table on the chart according to their preference, ensuring it integrates seamlessly into their trading workflow without obscuring critical chart data.
How It Works
1. Predefined Confirmations
The indicator includes a set of commonly used trading confirmations:
Identify Liquidity: Mark areas where liquidity might pool.
Inducement: Confirm the presence of inducements before market reversals.
Relevant Break of Structure (BOS): Validate critical structural changes.
Mitigation after RBoS: Check for mitigation following a BOS.
Smart Money Trap (SMT): Identify traps often utilized by smart money.
Timing: Ensure trades are entered during high-probability time windows.
Mitigation to the Leftside: Confirm whether price action aligns with prior mitigations.
Set Targets: Define and document logical take-profit or stop-loss levels.
2.Interactive Table Display
A table is dynamically created on the chart, showing all confirmations with their current state (checked or unchecked).
Users can choose the position of the table (top, middle, or bottom and left, center, or right) and customize its background color for better visibility.
3. Customization
All confirmations are toggled through the input settings, allowing traders to adapt the indicator to their unique strategies.
The display can be easily adjusted to match the trader’s preferences without cluttering the chart.
How to Use
1. Add the indicator to your chart.
2. Open the settings panel to activate the relevant confirmations for your analysis.
3. Use the Display Settings section to adjust the table's position and background color.
4. View the table on your chart to track selected confirmations in real-time.
Who Is This For?
This indicator is ideal for traders who:
Use Liquidity Inducent Theory strategy in their analysis.
Prefer a structured and systematic trading approach.
Need an on-chart tool to document confirmations without relying on external notes or tools.
Why Closed Source?
The logic behind the interactive table and confirmation system is specifically tailored to LIT practitioners and is not publicly available in existing open-source scripts. The closed-source nature of this script protects its unique implementation, ensuring the integrity and exclusivity of the tool.
Disclaimer
This indicator does not provide trading signals or strategies. It is a tool to document user-defined confirmations and should be used in conjunction with a thorough understanding of market behavior and risk management practices.

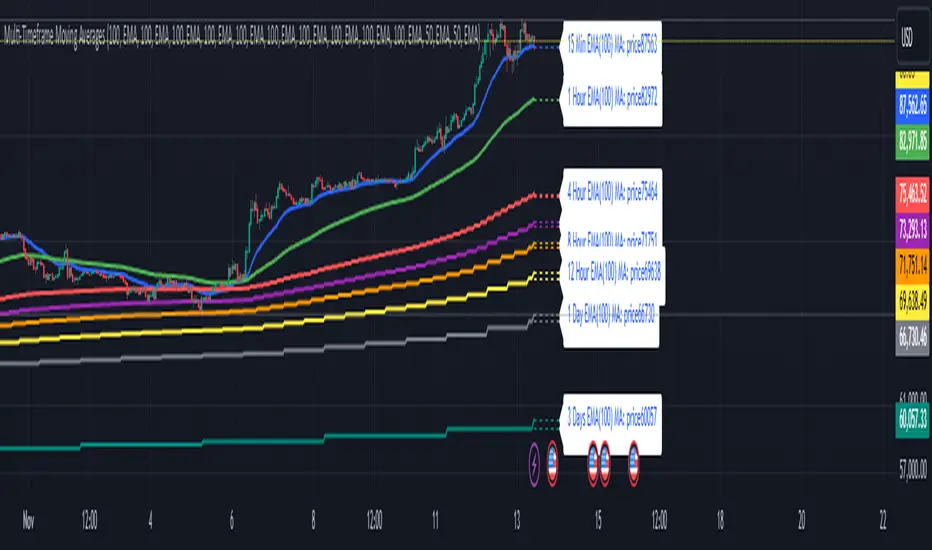
Multi-Timeframe Moving Averages by Skyito"Hope everyone likes this and finds it useful! This multi-timeframe moving average indicator provides a comprehensive view of moving averages from various timeframes directly on one chart. It’s designed to help traders analyze market trends and levels more effectively without constantly switching between charts.
Script Explanation: This indicator supports a range of moving average types, including SMA, EMA, HMA, WMA, VWMA, RMA, SSMA, and DEMA, allowing for flexibility in analysis. Each moving average is fully customizable by length and type for each timeframe, giving you control over how trends are represented.
The indicator includes timeframes such as 15 minutes, 1 hour, 4 hours, 6 hours, 8 hours, 12 hours, 1 day, 3 days, 5 days, 1 week, 3 weeks, and 1 month. Each moving average is displayed as a line with a small dashed extension, showing a label that contains the moving average’s timeframe, type, and current price level. The dark blue labels are slightly enlarged to enhance readability on the chart, making it easier to track important levels at a glance.
Use Case: This tool is ideal for traders looking to stay aware of trend levels across multiple timeframes on one chart. Adjusting the moving averages’ lengths and types enables customization for any strategy, while the label information provides an immediate understanding of the timeframe and trend context.
Enjoy the streamlined view and the added insights from multi-timeframe analysis!"
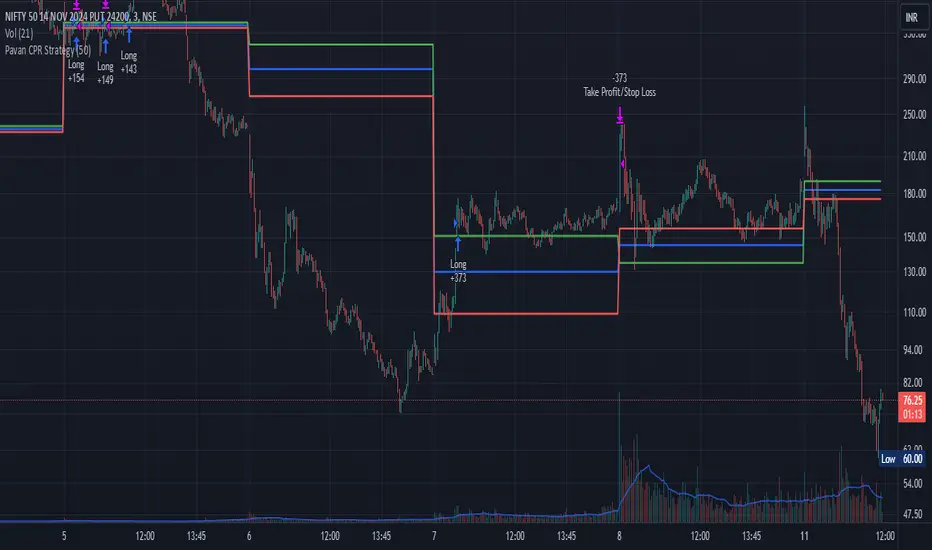
Pavan CPR Strategy Pavan CPR Strategy (Pine Script)
The Pavan CPR Strategy is a trading system based on the Central Pivot Range (CPR), designed to identify price breakouts and generate long trade signals. This strategy uses key CPR levels (Pivot, Top CPR, and Bottom CPR) calculated from the daily high, low, and close to inform trade decisions. Here's an overview of how the strategy works:
Key Components:
CPR Calculation:
The strategy calculates three critical CPR levels for each trading day:
Pivot (P): The central value, calculated as the average of the high, low, and close prices.
Top Central Pivot (TC): The midpoint of the daily high and low, acting as the resistance level.
Bottom Central Pivot (BC): Derived from the pivot and the top CPR, providing a support level.
The script uses request.security to fetch these CPR values from the daily timeframe, even when applied on intraday charts.
Trade Entry Condition:
A long position is initiated when:
The current price crosses above the Top CPR level (TC).
The previous close was below the Top CPR level, signaling a breakout above a key resistance level.
This condition aims to capture upward momentum as the price breaks above a significant level.
Exit Strategy:
Take Profit: The position is closed with a profit target set 50 points above the entry price.
Stop Loss: A stop loss is placed at the Pivot level to protect against unfavorable price movements.
Visual Reference:
The script plots the three CPR levels on the chart:
Pivot: Blue line.
Top CPR (TC): Green line.
Bottom CPR (BC): Red line.
These plotted levels provide visual guidance for identifying potential support and resistance zones.
Use Case:
The Pavan CPR Strategy is ideal for intraday traders who want to capitalize on price movements and breakouts above critical CPR levels. It provides clear entry and exit signals based on price action and is best used in conjunction with proper risk management.
Note: The strategy is written in Pine Script v5 for use on TradingView, and it is recommended to backtest and optimize it for the asset or market you are trading.
Implied Fair Value Gap (IFVG) ICT [TradingFinder] Hidden FVG OTE🔵 Introduction
The Implied Fair Value Gap (IFVG) is distinctive due to its unique three-candlestick formation, which differentiates it from conventional Fair Value Gaps.
Implied fair value represents an estimated worth of an asset—often a business or its goodwill—based on the price likely to be received in a structured transaction between market participants at a specific point in time.
In the ever-evolving world of technical analysis, pinpointing price reversal points and market anomalies can significantly enhance trading strategies and decision-making for traders and investors. Among the advanced concepts gaining traction in this field is the Implied Fair Value Gap (IFVG), introduced by the renowned analyst Inner Circle Trader (ICT).
This tool has proven to be an effective method for identifying hidden supply and demand zones in financial markets, offering a unique edge to traders looking for high-probability setups.
Unlike traditional gaps that are visible on price charts, IFVG is a hidden gap that doesn’t appear explicitly on the chart and thus requires specialized technical analysis tools for accurate identification.
This hidden gap can signal potential price reversals and offers traders insight into high-liquidity areas where price is likely to react. This article will guide you through using the ICT Implied Fair Value Gap Indicator effectively, covering its settings, usage strategies, and key features to help you make informed decisions in the market.
🟣 Bullish Implied FVG
🟣 Bearish Implied FVG
🔵 How to Use
The IFVG indicator is designed to assist traders in recognizing hidden support and resistance zones by identifying Bullish and Bearish IFVG patterns. With this tool, traders can make better-informed decisions about suitable entry and exit points for their trades based on these patterns.
🟣 Bullish Implied Fair Value Gap
This pattern occurs in an uptrend when a large bullish candlestick forms, with the wicks of the previous and following candles overlapping the body of the central candlestick.
This overlap creates a demand zone or a hidden support level, which can act as an ideal entry point for buy trades. Often, when the price returns to this area, it is likely to resume its upward trend, presenting a profitable buying opportunity.
🟣 Bearish Implied Fair Value Gap
This pattern is similar but forms in downtrends. Here, a large bearish candlestick appears on the chart, with the wicks of adjacent candles overlapping its body. This overlap defines a supply zone or a hidden resistance level and serves as a signal for potential sell trades.
When the price returns to this zone, it often continues its downward trend, providing an optimal point for entering sell trades.
The IFVG indicator also includes various filters that traders can use to refine their analysis based on market conditions. These filters, including Very Aggressive, Aggressive, Defensive, and Very Defensive, allow users to customize the IFVG zones' width, offering flexibility according to the trader’s risk tolerance and trading style.
🟣 Example Trading Scenarios
Suppose you’re in a strong uptrend and the IFVG indicator identifies a Bullish IFVG zone. In this scenario, you could consider entering a buy trade when the price retraces to this zone, expecting the uptrend to resume. Conversely, in a downtrend, a Bearish IFVG zone can signal a favorable entry point for short trades when the price revisits this area.
🔵 Settings
Implied Block Validity Period: This parameter specifies the validity period of each identified block, taking into account the number of bars that have passed since its formation. Proper adjustment of this period helps traders focus only on relevant zones, increasing the accuracy of the analysis.
Mitigation Level OB : This option defines the mitigation level for supply and demand blocks (Order Blocks), with settings including Proximal, 50% OB, and Distal.
Depending on the selected level, the indicator will focus on closer, mid-range, or farther points for block identification, allowing traders to adjust for the level of precision required.
Implied Filter : Activating this filter allows traders to apply conditions based on the width of the IFVG zones. With options like Very Aggressive and Very Defensive, traders can control the width of IFVG zones to suit their risk management strategy—whether they prefer high-risk setups or low-risk setups.
Display and Color Settings : This section enables users to customize the appearance of the IFVG zones on their charts. Traders can set different colors for Bullish and Bearish zones, allowing for easier distinction and improved visualization.
Alert Settings : One of the standout features of the IFVG indicator is the alert system. By setting up alerts, users can be notified whenever the price approaches a demand or supply zone.
Alerts can be customized to trigger Once Per Bar (one alert per bar) or Per Bar Close (alert at the close of each bar), ensuring that traders stay updated on critical price movements without needing to monitor the chart continuously.
🔵 Conclusion
The ICT Implied Fair Value Gap (IFVG) indicator is a powerful and sophisticated tool in technical analysis, allowing professional traders to identify hidden supply and demand zones and use them as entry and exit points for buy and sell trades.
This indicator’s automatic detection of IFVG zones helps traders uncover hidden trading opportunities that can enhance their analysis.
While the IFVG indicator offers numerous advantages, it is important to use it in conjunction with other technical analysis tools and sound risk management practices.
IFVG alone does not guarantee profitability in trading; it works best when combined with other indicators such as volume analysis and trend-following indicators for a comprehensive trading strategy.

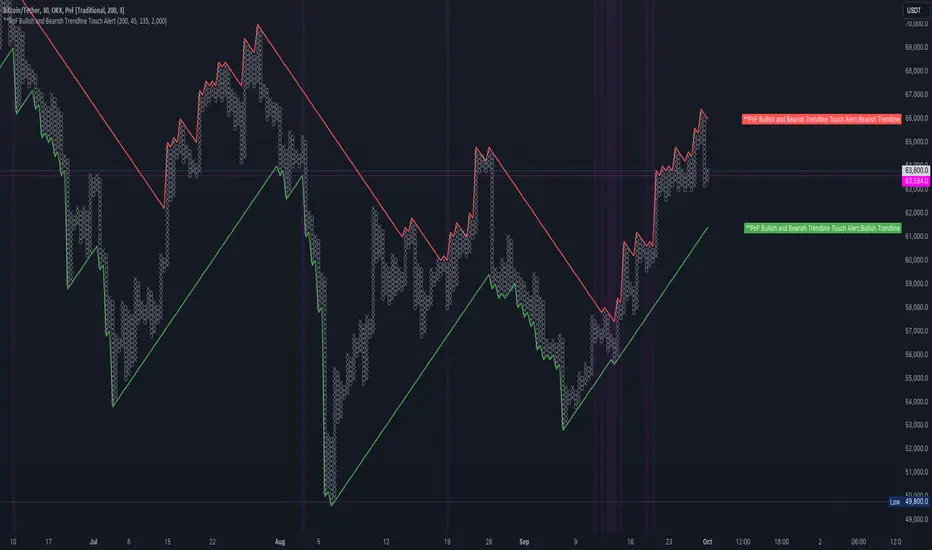
PnF Bullish & Bearish Trend Line Indicator with Proximity AlertThis Pine Script indicator, "PnF Bullish and Bearish Trend line Proximity Alert," overlays on a trading chart to monitor and alert users about interactions with bullish and bearish trend lines derived from Point and Figure (PnF) charting.
Key Features:
Inputs: Users can set parameters such as box size, bullish and bearish angles (in degrees), and a proximity threshold for detecting touches.
Slope Calculation: The script calculates the slopes for bullish and bearish trendlines using the tangent of the specified angles.
Trendline Management:
It initializes and updates trend lines based on price interactions, adjusting their starting points and positions as conditions change.
Proximity Detection: The indicator checks if the current price is close enough to the trend lines and sets conditions for alerts.
Alerts: Users receive alerts when both trend lines are touched, enhancing decision-making for trading strategies.
Visual Feedback: It highlights areas where both trend lines are touched and plots the trend lines in distinct colors for clarity.
This indicator provides an effective way to track key price levels and potential trend reversals in the market.
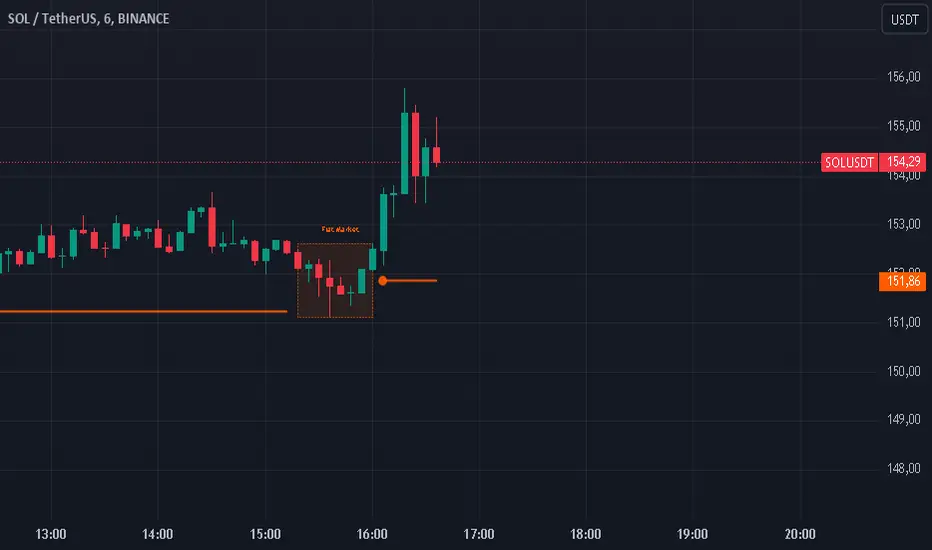
Flat Market Range Pro [CHE]Flat Market Range Pro Indicator
Introduction
Hey there! 👋
Welcome to our overview of the Flat Market Range Pro indicator. Whether you're new to trading or a seasoned pro, this tool is designed to help you spot those flat market conditions where prices are chilling within a certain range. By highlighting these consolidation zones and potential breakout points, it offers some pretty neat insights to boost your trading strategies. Let’s dive in and explore how this indicator can make your trading journey smoother and more informed!
How It Works
The Flat Market Range Pro indicator is all about understanding the ebb and flow of the market. Here's a simple breakdown:
Range Detection:
Range Period (range_period): This sets the number of bars (think of them as time slices) the indicator looks back to find the highest highs and lowest lows. It’s like setting the scope for your search.
Minimum Candles in Range (min_candles_in_range): Ensures that there are enough candles (price bars) within the range to make the detection meaningful. No point in highlighting a range if it’s too short, right?
Adaptive Moving Average (AMA):
Think of AMA as the indicator’s way of staying flexible. It smooths out the price data to better spot trends within those flat ranges. Don’t worry, it’s working behind the scenes and won’t clutter your chart.
Breakout Detection:
When the price decides to break free from its cozy range, the indicator flags it. It waits for confirmation to make sure it’s not just a fleeting move, adding a layer of reliability to your signals.
Visualization:
Flat Market Zones: These are shaded areas that highlight where the price has been consolidating.
Support and Resistance Lines: Automatically drawn lines that mark key price levels, helping you see where the price might bounce or break through.
Trade Signals: Arrows popping up to show potential buy or sell opportunities when breakouts occur.
Breaking It Down
1. Detecting the Range
The indicator scans through the past range_period bars to find the highest and lowest prices. This creates a dynamic range that adjusts as new data comes in. It’s like having a smart assistant keeping an eye on where the action is happening.
2. The Role of AMA
Even though you won’t see AMA on your chart, it plays a crucial role. It helps the indicator adapt to changing market conditions by smoothing out the data, making sure the breakout signals are spot-on and not just random noise.
3. Spotting Breakouts
A breakout happens when the price moves beyond the established range. The indicator marks these moments with clear arrows, so you know when it might be a good time to jump in or out of a trade. Plus, it waits for confirmation to ensure these signals are solid.
4. Visualizing Flat Markets
Shaded boxes highlight the areas where the price has been consolidating, making it easy to see when the market is flat. Support and resistance lines are drawn automatically, and you can even customize how they look to match your personal style.
Customize It Your Way
One of the best things about the Flat Market Range Pro indicator is how customizable it is. Here’s what you can tweak:
Range Settings:
Adjust the range_period to fit different timeframes.
Set the min_candles_in_range to ensure the ranges you see are meaningful.
Moving Average Settings:
Change the ma_length and ma_lookback to fine-tune how the AMA responds to price movements.
Visual Tweaks:
Pick your favorite colors and transparency levels for the shaded zones.
Choose whether to display support and resistance lines and extend them indefinitely if you like.
Toggle trade arrows and labels on or off based on what you find most helpful.
Organizing these settings into logical groups makes it super easy to customize the indicator just the way you like it.
Real-World Examples
1. Spotting Consolidation: Imagine you’re watching a stock that’s been moving sideways for a while. The indicator highlights this consolidation with shaded boxes and support/resistance lines, giving you a clear picture of where the price is hanging out.
2. Trading Breakouts: When the price finally decides to break free from the range, the indicator pops up buy or sell arrows. This helps you catch the move early, whether you’re looking to enter a new trade or exit an existing one.
3. Making Informed Decisions: With clear visual cues and reliable signals, you can make smarter trading decisions without getting overwhelmed by too much information.
Behind the Scenes: Technical Insights
For those curious about the nuts and bolts, here’s a peek into how the Flat Market Range Pro indicator is built:
Efficient Range Calculation:
Uses loops to scan through the specified range_period, ensuring accurate detection of high and low points.
Adaptive Logic with AMA:
Incorporates the Simple Moving Average (SMA) to create a threshold coefficient, making the indicator responsive to market changes.
Clear Visualization:
Utilizes box.new and label.new for intuitive visual representations of flat markets.
Employs plotshape and plot to display breakout signals clearly on your chart.
Optimized Performance:
Avoids plotting unnecessary elements like AMA, keeping your chart clean and focused on what matters.
Why You’ll Love It
The Flat Market Range Pro indicator brings a lot to the table:
Accurate Range Detection:
Pinpoints consolidation zones by analyzing historical highs and lows.
Flexible and Adaptive:
AMA ensures the indicator stays responsive to different market conditions.
User-Friendly Visuals:
Shaded zones, support/resistance lines, and clear trade signals make your chart easy to understand at a glance.
Highly Customizable:
Tailor the settings to match your trading style and preferences.
Reliable Signals:
Confirmation mechanisms help reduce false signals, giving you more confidence in your trades.
Wrapping It Up
The Flat Market Range Pro indicator is a fantastic tool for anyone looking to navigate flat or consolidating markets with ease. By combining precise range detection, adaptive logic, and clear visual cues, it helps you identify consolidation phases and seize breakout opportunities effectively. Its customizable features ensure that it fits seamlessly into your trading strategy, whether you’re just starting out or have years of experience under your belt.
For more details, a step-by-step guide on using the indicator, and access to the full Pine Script code, check out the accompanying documentation or reach out for support. Happy trading! 🌟
Questions and Further Information
Got questions or need a hand with the Flat Market Range Pro indicator? Feel free to reach out! Whether you’re curious about how it works or need tips on customizing it for your trading style, we’re here to help. Also, give the indicator a try on different charts to see how it performs in various market conditions. Let’s make your trading experience better together!
Best regards
Chervolino
This script was inspired by: Trend Regularity Adaptive Moving Average
and
Range Detection by HasanRifat
Descriptive Backtesting Framework (DBF)As the name suggests, this is a backtesting framework made to offer full backtesting functionality to any custom indicator in a visually descriptive way.
Any trade taken will be very clear to visualize on the chart and the equity line will be updated live allowing us to use the REPLAY feature to view the strategy performing in real time.
Stops and Targets will also get draw on the chart with labels and tooltips and there will be a table on the top right corner displaying lots of descriptive metrics to measure your strategy's performance.
IF YOU DECIDE TO USE THIS FRAMEWORK, PLEASE READ **EVERYTHING** BELOW
HOW TO USE IT
Step 1 - Insert Your Strategy Indicators:
Inside this framework's code, right at the beginning, you will find a dedicated section where you can manually insert any set of indicators you desire.
Just replace the example code in there with your own strategy indicators.
Step 2 - Specify The Conditions To Take Trades:
After that, there will be another section where you need to specify your strategy's conditions to enter and exit trades.
When met, those conditions will fire the trading signals to the trading engine inside the framework.
If you don't wish to use some of the available signals, please just assign false to the signal.
DO NOT DELETE THE SIGNAL VARIABLES
Step 3 - Specify Entry/Exit Prices, Stops & Targets:
Finally you'll reach the last section where you'll be able to specify entry/exit prices as well as add stops and targets.
On most cases, it's easier and more reliable to just use the close price to enter and exit trades.
If you decide to use the open price instead, please remember to change step 2 so that trades are taken on the open price of the next candle and not the present one to avoid the look ahead bias.
Stops and targets can be set in any way you want.
Also, please don't forget to update the spread. If your broker uses commissions instead of spreads or a combination of both, you'll need to manually incorporate those costs in this step.
And that's it! That's all you have to do.
Below this section you'll now see a sign warning you about not making any changes to the code below.
From here on, the framework will take care of executing the trades and calculating the performance metrics for you and making sure all calculations are consistent.
VISUAL FEATURES:
Price candles get painted according to the current trade.
They will be blue during long trades, purple on shorts and white when no trade is on.
When the framework receives the signals to start or close a trade, it will display those signals as shapes on the upper and lower limits of the chart:
DIAMOND: represents a signal to open a trade, the trade direction is represented by the shape's color;
CROSS: means a stop loss was triggered;
FLAG: means a take profit was triggered;
CIRCLE: means an exit trade signal was fired;
Hovering the mouse over the trade labels will reveal:
Asset Quantity;
Entry/Exit Prices;
Stops & Targets;
Trade Profit;
Profit As Percentage Of Trade Volume;
**Please note that there's a limit as to how many labels can be drawn on the chart at once.**
If you which to see labels from the beginning of the chart, you'll probably need to use the replay feature.
PERFORMANCE TABLE:
The performance table displays several performance metrics to evaluate the strategy.
All the performance metrics here are calculated by the framework. It does not uses the oficial pine script strategy tester.
All metrics are calculated in real time. If using the replay feature, they will be updated up to the last played bar.
Here are the available metrics and their definition:
INITIAL EQUITY: the initial amount of money we had when the strategy started, obviously...;
CURRENT EQUITY: the amount of money we have now. If using the replay feature, it will show the current equity up to the last bar played. The number on it's right side shows how many times our equity has been multiplied from it's initial value;
TRADE COUNT: how many trades were taken;
WIN COUNT: how many of those trades were wins. The percentage at the right side is the strategy WIN RATE;
AVG GAIN PER TRADE: the average percentage gain per trade. Very small values can indicate a fragile strategy that can behave in unexpected ways under high volatility conditions;
AVG GAIN PER WIN: the average percentage gain of trades that were profitable;
AVG GAIN PER LOSS: the average percentage loss on trades that were not profitable;
EQUITY MAX DD: the maximum drawdown experienced by our equity during the entire strategy backtest;
TRADE MAX DD: the maximum drawdown experienced by our equity after one single trade;
AVG MONTHLY RETURN: the compound monthly return that our strategy was able to create during the backtested period;
AVG ANNUAL RETURN: this is the strategy's CAGR (compound annual growth rate);
ELAPSED MONTHS: number of months since the backtest started;
RISK/REWARD RATIO: shows how profitable the strategy is for the amount of risk it takes. Values above 1 are very good (and rare). This is calculated as follows: (Avg Annual Return) / mod(Equity Max DD). Where mod() is the same as math.abs();
AVAILABLE SETTINGS:
SPREAD: specify your broker's asset spread
ENABLE LONGS / SHORTS: you can keep both enable or chose to take trades in only one direction
MINIMUM BARS CLOSED: to avoid trading before indicators such as a slow moving average have had time to populate, you can manually set the number of bars to wait before allowing trades.
INITIAL EQUITY: you can specify your starting equity
EXPOSURE: is the percentage of equity you wish to risk per trade. When using stops, the strategy will automatically calculate your position size to match the exposure with the stop distance. If you are not using stops then your trade volume will be the percentage of equity specified here. 100 means you'll enter trades with all your equity and 200 means you'll use a 2x leverage.
MAX LEVERAGE ALLOWED: In some situations a short stop distance can create huge levels of leverage. If you want to limit leverage to a maximum value you can set it here.
SEVERAL PLOTTING OPTIONS: You'll be able to specify which of the framework visuals you wish to see drawn on the chart.
FRAMEWORK **LIMITATIONS**:
When stop and target are both triggered in the same candle, this framework isn't able to enter faster timeframes to check which one was triggered first, so it will take the pessimistic assumption and annul the take profit signal;
This framework doesn't support pyramiding;
This framework doesn't support both long and short positions to be active at the same time. So for example, if a short signal is received while a long trade is open, the framework will close the long trade and then open a short trade;
FINAL CONSIDERATIONS:
I've been using this framework for a good time and I find it's better to use and easier to analyze a strategy's performance then relying on the oficial pine script strategy tester. However, I CANNOT GUARANTEE IT TO BE BUG FREE.
**PLEASE PERFORM A MANUAL BACKTEST BEFORE USING ANY STRATEGY WITH REAL MONEY**

Simple SessionsThis is a simple sessions indicator that allows you to highlight up to 3 different sessions on your chart. This is intended for charts in any timeframe lower than the Daily timeframe. Really simple, clean, and minimalistic on purpose, intended to help and not clutter the chart.
Options/parameters:
Sessions: Check and setup beginning and end of the sessions. Up to 3 sessions at the same time.
Enable specific timezone: You can specify your exact timezone so that the sessions stay consistent even when you’re viewing different assets from different brokers that might be providing the price data in different timezones.
Show next day: Check to allow for your sessions to be viewed in advance for the following day so that you can expect your trading session in the chart (something simple, but quite useful).
Show next day input also accepts an integer value (default at 0). This numeric value is useful only for a few different assets that don’t have price data (aren’t tradable) 24 hours of each week-day. When that’s the case the calculation to show the session in the future day is not precise so with this number you can adjust it. For example, on OANDA:SPX500USD in the 30m time-frame, between 5pm and 6pm NY time there’s no price data. If you check that chart on any day at 4:30pm NY time, the next bar should be at 5pm, however since there’s no data it jumps to 6pm NY time. For that example you can set the input number to -2 and it will move the sessions to the correct time window you specified in the Sessions input.
Optional comment: This is a comment that will be shown in the status line. There’s no other use for this. It’s only helpful when you have multiple instances of the indicator for different assets for example. In that case with this comment you would be able to instantly detect which indicator is for which chart.
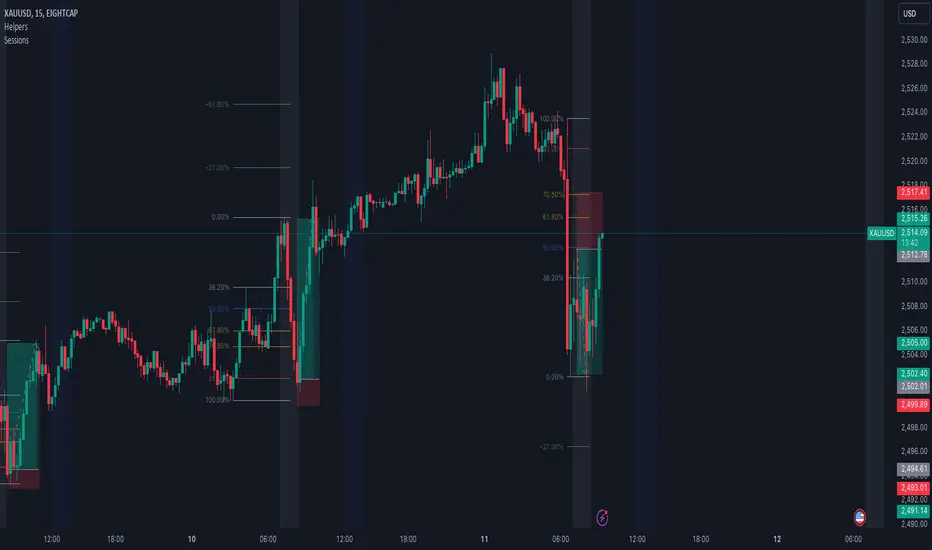
Atlantean Bitcoin Weekly Market Condition - Top/Bottom BTC Overview:
The "Atlantean Bitcoin Weekly Market Condition Detector - Top/Bottom BTC" is a specialized TradingView indicator designed to identify significant turning points in the Bitcoin market on a weekly basis. By analyzing long-term and short-term moving averages across two distinct resolutions, this indicator provides traders with valuable insights into potential market bottoms and tops, as well as the initiation of bull markets.
Key Features:
Market Bottom Detection: The script uses a combination of a simple moving average (SMA) and an exponential moving average (EMA) calculated over long and short periods to identify potential market bottoms. When these conditions are met, the script signals a "Market Bottom" label on the chart, indicating a possible buying opportunity.
Bull Market Start Indicator: When the short-term EMA crosses above the long-term SMA, it signals the beginning of a bull market. This is marked by a "Bull Market Start" label on the chart, helping traders to prepare for potential market upswings.
Market Top Detection: The script identifies potential market tops by analyzing the crossunder of long and short-term moving averages. A "Market Top" label is plotted, suggesting a potential selling point.
Customizable Moving Averages Display: Users can choose to display the moving averages used for detecting market tops and bottoms, providing additional insights into market conditions.
How It Works: The indicator operates by monitoring the interactions between the specified moving averages:
Market Bottom: Detected when the long-term SMA (adjusted by a factor of 0.745) crosses over the short-term EMA.
Bull Market Start: Detected when the short-term EMA crosses above the long-term SMA.
Market Top: Detected when the long-term SMA (adjusted by a factor of 2) crosses under the short-term SMA.
These conditions are highlighted on the chart, allowing traders to visualize significant market events and make informed decisions.
Intended Use: This indicator is best used on weekly Bitcoin charts. It’s designed to provide long-term market insights rather than short-term trading signals. Traders can use this tool to identify strategic entry and exit points during major market cycles. The optional display of moving averages can further enhance understanding of market dynamics.
Originality and Utility: Unlike many other indicators, this script not only highlights traditional market tops and bottoms but also identifies the aggressive start of bull markets, offering a comprehensive view of market conditions. The unique combination of adjusted moving averages makes this script a valuable tool for long-term Bitcoin traders.
Disclaimer: The signals provided by this indicator are based on historical data and mathematical calculations. They do not guarantee future market performance. Traders should use this tool as part of a broader trading strategy and consider other factors before making trading decisions. Not financial advice.
Happy Trading!
By Atlantean

AB_Bnf_Selling_5minThe Mathematical Level Reversal Strategy is designed to identify potential reversal points in the market using mathematical levels combined with price action on a 5-minute chart. This strategy is particularly effective for intraday traders who seek to capitalize on precise entry and exit points based on calculated levels rather than traditional indicators like moving averages or Bollinger Bands.
Creators' Mathematical Levels Explanation
Mathematical levels are predetermined price points calculated based on various factors such as previous high/low points, Fibonacci retracements, or other arithmetic calculations. These levels are used to anticipate areas where the price might reverse or experience significant support or resistance.
higher threshold: A predefined level where the price is expected to experience resistance, leading to a potential reversal downward.
Lower Threshold: A predefined level where the price might find support, leading to a potential upward reversal.
In this strategy, we focus on price movements around the upper mathematical level, where prices are likely to reverse downwards.
Strategy Logic
Setup:
The strategy is applied on a 5-minute chart.
Mathematical levels are calculated based on your preferred method, such as Fibonacci levels, pivot points, or custom calculations. For this strategy, let's assume we are using a specific predefined upper level.
Sell Signal Criteria:
A 5-minute candle must cross above the predefined upper mathematical level or close entirely above it (open and close both above the level).
The following candle must break below the low of the candle that crossed the upper level and close below that low. This confirms a bearish reversal.
Once these conditions are met, a sell signal is triggered.
Stop Loss:
The stop loss is placed at the high of the candle that crossed above the upper mathematical level.
This level represents the point where the trade setup would be invalidated.
Take Profit:
Target 1: The first take profit is set at a level that offers a 1:5 risk-to-reward ratio.
Target 2: An alternative take profit level is set at a 1:3 risk-to-reward ratio, providing flexibility based on market conditions.
Trade Management:
Once a trade is initiated, no new trades will be taken until the current trade hits either the stop loss or the first take profit level. This prevents overlapping signals and helps in managing risk effectively.
Originality and Usefulness
This strategy offers a unique approach by using mathematical levels instead of traditional indicators. It provides traders with a clear framework for identifying and executing high-probability reversal trades, particularly in intraday markets.
Originality:
The strategy's originality lies in its reliance on mathematical levels combined with a multi-candle confirmation pattern. This approach reduces the chances of false signals and offers a robust method for identifying potential reversals.
Usefulness:
The strategy is particularly useful for traders who prefer a more quantitative approach, relying on calculated price levels rather than indicators. The clear rules for entry, stop loss, and take profit make it easier to execute consistently.
The inclusion of both 1:5 and 1:3 risk-to-reward targets allows for flexibility depending on market conditions, ensuring that traders can adapt to varying levels of volatility.
Chart Signals and Examples
To demonstrate the effectiveness of this strategy, let's look at a few hypothetical examples on a 5-minute chart:
Example 1: Clear Reversal Signal
The price steadily rises and crosses above the predefined upper mathematical level. The next candle breaks below the low of this candle and closes lower, triggering a sell signal.
A red dotted line is drawn at the stop loss level (the high of the candle that crossed the upper level).
Two green dashed lines are drawn to indicate the first and second take profit levels.
Example 2: No Signal Due to Ongoing Trade
After an initial sell signal is triggered, the price fluctuates but does not hit either the stop loss or the first take profit target. During this period, the strategy refrains from issuing any new signals, adhering to the trade management rule.
Example 3: Trade Reaches Target 1
In another scenario, the price moves sharply in favor of the trade after the signal is triggered. The first take profit level is hit, securing a profit. The trade is then considered closed, and the strategy is ready to issue a new signal when conditions are met.

Gap Trend Lines by @eyemaginativeSummary:
The "Gap Trend Lines" script is designed to identify and visualize gaps between the close of one candle and the opening of the next on a TradingView chart. It draws extended trend lines to visually connect these gaps, helping traders to identify significant price movements between consecutive candles.
Functionality:
Indicator Setup:
The script is set as an overlay indicator on the main chart.
It includes settings for maximum line and label counts, ensuring efficient performance.
Parameter Customization:
Gap Threshold: Defines the minimum gap size considered significant.
Line Colors: Allows customization of colors for small and large gaps.
Line Thickness and Style: Provides options to adjust the thickness and style (solid, dotted, dashed) of the trend lines.
Drawing Extended Trend Lines:
For each bar (candlestick) on the chart, the script checks if there is a gap between the previous candle's close and the current candle's open.
If a gap is detected (i.e., close != open), it determines the size of the gap.
Depending on the size relative to the defined threshold, it selects the appropriate color (small or large gap).
It then draws an extended trend line that starts from the close of the previous candle (bar_index , close ) and extends to the open of the current candle (bar_index, open).
The trend line is drawn with the specified thickness, color, and style.
Dynamic Line Attribute Changes:
The script includes a function (changeLineAttributes()) that periodically changes the color and style of the trend lines.
By default, it changes the color every 4 hours (adjustable), alternating between green and the original color.
Enhanced Functionality:
Handles both small and large gaps with different visual cues (colors).
Supports extended trend lines that span both past and future directions (extend=extend.both), ensuring visibility across the entire chart.
Usage:
Traders can use the "Gap Trend Lines" script to:
Identify and analyze gaps between candlesticks.
Visualize significant price movements or breaks in continuity.
Customize the appearance of trend lines for better clarity and analysis.
By utilizing this script, traders can gain insights into price gap dynamics directly on TradingView charts, aiding in decision-making and strategy development.
