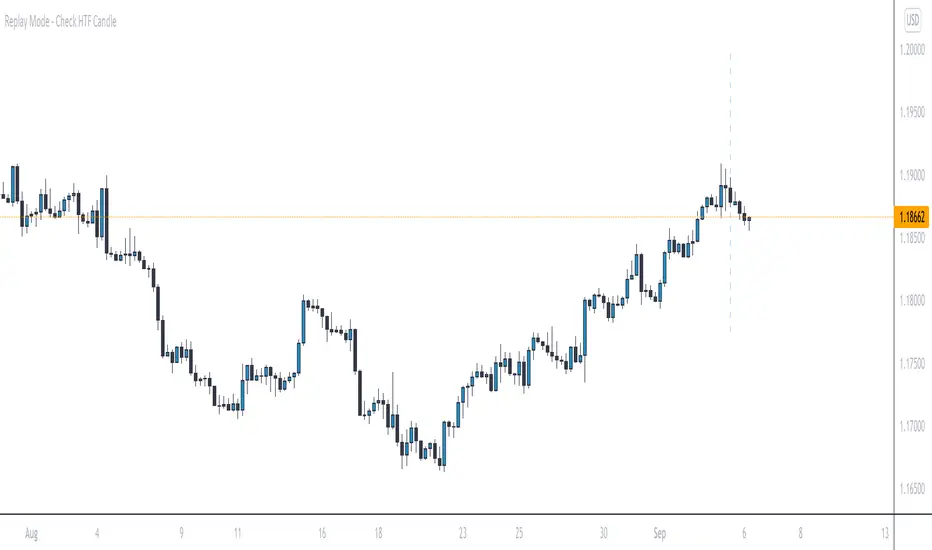
Replay Mode - Check HTF CandleThis indicator is intended to be used while using Replay Mode.
A vertical line will be drawn when you can safely check the 4H, Daily, or Weekly candle without seeing future price.
It is similar to the built-in Session Breaks, but has the benefit of not needing to remove one candle before checking the Daily.
When the line is the color of your 4H settings, it is safe to check the 4H candle.
When the line is the color of your Daily settings, it is safe to check the 4H and Daily candles.
When the line is the color of your Weekly settings, it is safe to check the 4H, Daily and Weekly candles
Tìm kiếm tập lệnh với "daily"
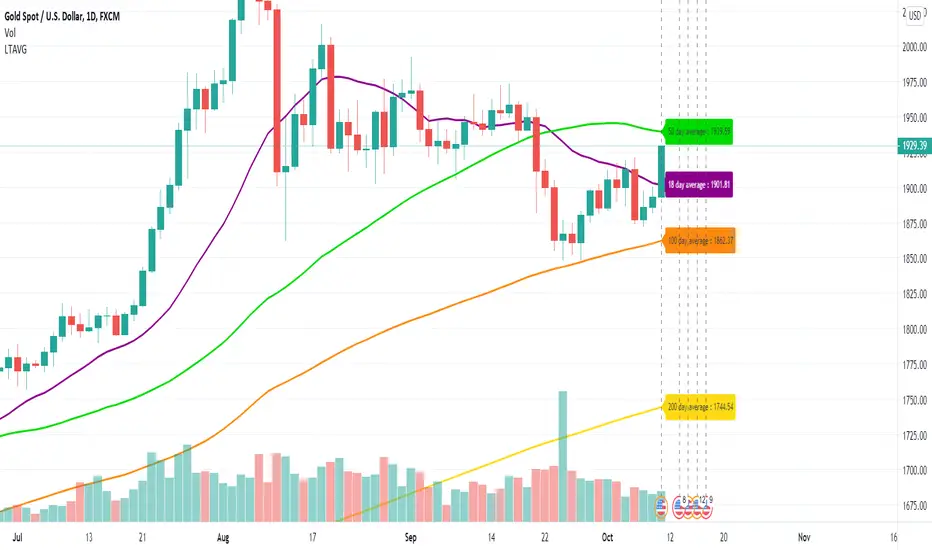
Long Term Moving AverageThis scripts plots the long term moving average calculated daily for 4 sets.
The default averages are:
18 day
50 day
100 day
200 day
The settings can be used to flexibly change this and to hide / show labels
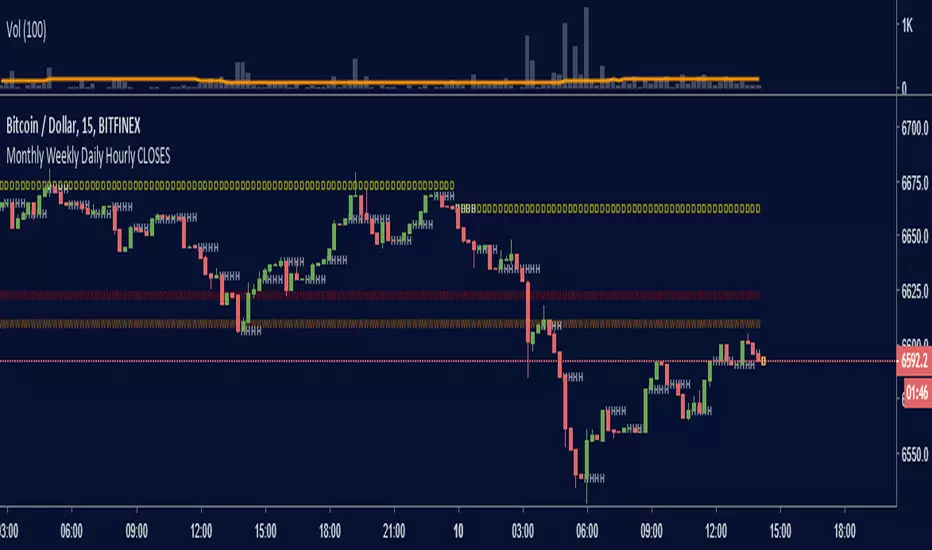
Monthly Weekly Daily Hourly CLOSESDraws horizontal segments where the last Monthly, Weekly, Daily and Hourly closes are.
Easily identify current price relative position to these key prices.
I use it as a kind of pivot points and help me with trend following entries: longs if up from last close, shorts if down from last close.
Monthly: red line (MMMMM)
Weekly: orange line (WWWWW)
Daily: yellow line (DDDDD)
Hourly: white line (HHHHH)
//Original idea from "Key Levels
Multi-Timeframe FVG (1H, 4H, Daily) - Color ShadesFVG charting in real time upon candle close. 1Hr, 4 Hr, Daily.
! hour darkest, 4 hour mid, daily lightest shade of color.

Multi TF High/Low/Open/Close LineNOTE: I'm not sure why the screengrab isn't showing the lines. They are there, and when I share the chart from this link they are there.... idk
This is a requested spin-off version of my previous HLOC for the Daily/Weekly/Monthly that allows users to choose 3 different timeframe units (Mins, Hours, Days, etc...) from the dropdown menu and then select the lookback period in which to draw the HLOC.
I've had quite a few requests to allow users to see multiple lookbacks for the same timeframe unit, mostly weekly, and I did not wish to change that particular script for that purpose. However, I was able to take the existing script and alter it for user input.
This indicator draws a line on the TF 1, TF 2, and TF 3 bar at the High, Low, Open and Close of user input Timeframe unit and selected lookback period.
The lookback period will go back the number of candles entered. So for example if you choose a 5 Min chart with a lookback of 3, the lines will be drawn on the HLOC 3 closed 5 min candles back. Selecting 0 will show data on the current Real-Time candle.
An example of a request I have gotten was for last week, the previous week and the previous month. The settings for that would be: TF 1 - 1 week Lookback 1, TF 2 - 1 week Lookback 2, TF 3 - 1 month Lookback 1.
Each set of lines has an optional identifying label with its own color set that can be shown with or without price value, and has drop down menus for size and style of each set of labels. The TF unit value is displayed on the label, but not the lookback.
So if you are using the hourly on all 3 TF's with different lookback periods, they will all say "60" on the label.
I recommend using the line and label options to distinguish between the different lookback values.
Each set of lines has inputs for line/text color, line width and style and each line argument can be selected independently.
In the chart example I have displayed only the High and Low on three 1 hour TF's with the lookback of 4, 5 and 6 candles with the labels descending in size. With this data I can see that over the last 6 hours the price of ES is in an descending pattern and I should be on alert for a break.
Since I trade ES in RTH on a much lower timeframe, this data can alert me to a bigger picture potential trend change or continuation. I would personally use this with pivot data for timing and look for entries in areas of high volume that moved price to a new
high or low that have not been retested.
I will be looking to add a user input offset for labels in the future. I have had bad luck with it in the past working for a couple weeks and then throwing an error, but I will look into it again soon.
I also recommend going into Chart Settings/Status Line and turning off indicator arguments OR moving the script to the top of the indicator list to avoid obstructed chart view with this indicators arguments. When script allows, I will update it to hide them.

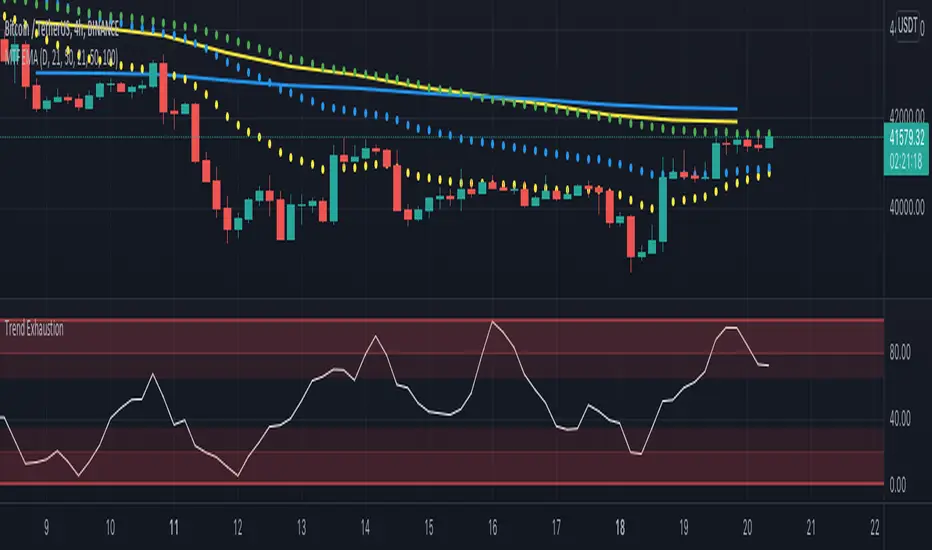
Multi Timeframe EMA by DigitaldYou can use this indicator to show the Daily-EMAs beside the EMAs of the current timeframe.
Everything can be adjusted
Cheers
[MF] Auto Fibonacci LevelsDescription:
Automatically draw Fibonacci Pivot levels based on the previous (day's, week's or month's)
Range ( High-Low ). The HLC3 is used as the default Pivot level.
Unlike the "Auto Fibonacci Levels", this variation does not update
Levels on current day even if the price goes past the R3/S3 levels.
Timeframes: 1D, 1W, 1M
Range = (High - Low) - From previous Day, Week or month.
FIB LEVELS:
- Yellow = Pivot and Pivot Zone (HLC3 by default)
- red = R1,S1 Levels 0.236 * Range
- Green = R2,S2 Levels 0.368 * Range
- Lime = R3,S3 Levels 0.618 * Range
- Blue = R4,S4 Levels 0.786 * Range
- Gray = R5,S5 Levels 1.000 * Range
- Lime = R6,S6 Levels 1.236 * Range
- Red = R7,S7 Levels 1.382 * Range
- Blue = R8,S8 Levels 1.618 * Range
- Green = R9,S9 Levels 2.000 * Range
CLASSIC LEVELS:
- Yellow = Pivot and Pivot Zone (HLC3)
- Green = R1,S1 Levels (Pivot*2 - Low), (Pivot*2 - High)
- Lime = R2,S2 Levels ( Pivot + Range), ( Pivot - Range)
- Lime = R3,S3 Levels (High + 2*( Pivot - Low)), (Low - 2*(High - Pivot ))
- Blue = R4,S4 Levels (High + 3*( Pivot - Low)), (Low - 3*(High - Pivot ))
Refrences:
- Auto Daily Fib Levels R3.0 by JustUncleL
- Auto Fib by TheYangGuizi
- Monthly Dynamic Range Levels (Fibonaci) V0 by RicardoSantos
Modifications:
- Added next FIB Levels. (changes during the current cycle)
- Added FIB 0.236 Levels
- Added Option to change the colors of the Fib Levels
- Changed Default colors to the colors of Tradingview
- Upgraded to Version4 Pinescript

ATR Daily Levels Band NakitxuAverage True Range
What Is the Average True Range (ATR)?
The average true range (ATR) is a technical analysis indicator, that measures market volatility by decomposing the entire range of an asset price for that period.
The true range indicator is taken as the greatest of the following: current high less the current low; the absolute value of the current high less the previous close; and the absolute value of the current low less the previous close.
The ATR is then a moving average, generally using 14 days, of the true ranges.
This script is an especial request of a TradingView user.
Shows 5 levels based on ATR daily, plotted in wherever timeframe you are using:
level 1: prv day ATR + prv day close
level 2: prv day ATR + prv day high
level 3: level 2 - prv day ATR
level 4: prv day close - prv day ATR
level 5: prv day low - prv day
Only show the levels if you are in a timeframe daily or lower than daily.

GBP/JPY Daily time FX Strategy ATR W% BaselineThis is a preety good strategy suited for long term trading.
It has been adapted and optimized in this case for GBP/JPY 1D time frame.
Its made of Kiojun baseline, together with ATR for stop loss and size calculation and Williams % R
For the purpose of this example we simulate that we have a leverage of 100x in order to be able to buy the ammount of lots required for our stop loss to be in same page with the risk % of our capital.
For entry we have for long, ascending R in the last 2 candles and crossover of close with KIOJUN baseline. For short the same but in reverse.
We exit if we reach the TP -100 points in this example, or SL , which is based on ATR of the last x days.
If you have any questions feel free to write me in private !

Reset Every (Price)Someone requested a high/low price indicator that would reset the "remembered" prices daily. I started out doing just that, and then decided to make it much more configurable.
Choose the units (minutes, hours, days, weeks, months) and the number of those units, and this will reset the highest/lowest value remembered to the current values on your chosen time interval.
This should work with any time interval you desire, within reason...asking for resets every 4000 hours on a monthly chart will probably not work.
GE, monthly, every 7 months:
Ford, weekly, every 18 months:
Dow Jones Industrial Average, weekly, every 90 days:
LTCBTC, daily, every 10 days:
ETHUSD, 30 minutes, every 10 days:
BTCUSD, 1 minute, every 10 hours:
EURUSD, 1 minute, every 50 minutes:
Also, I am about to publish another version of this with just one source input that can be applied to any indicator...stay tuned!

MAGNUS® CyclesThis indicator will help you if you struggle making any profit in bitcoin.
It generates very few signals with very nice profit potential ( around 100% this year ! ).
Perfect tool for longterm swing traders and new traders that need help figuring out the midterm trend.
Use it with these parameters only:
weekly: 13, 5, 12
daily: 92, 21, 96

DJ BTC DailyThis Strategy only works on BTC daily. The only concern is the low winrate that could be a psycological hurdle. Please do comment for adjustments I should try and incorprate and let's find a killer strategy together :-)

Bias DailyThis indicator shows in a different way how to evaluate the BIAS Daily.
Evaluate yesterday's closed candle and that of the day before yesterday
The conditions are:
LONG BIAS =
Candle closed above High Candle [2 ]
- In this condition a long continuation can be considered
SHORT BIAS =
The candle closed below the low candle [2 ]
- In this condition a short continuation can be considered
IN THE RANGE =
The candle did not close below or above the Low and High candle
- In this condition it is better not to risk it
The user has the possibility to:
- Choose to show high or low BIAS levels
- Shows the Table in which the BIAS D is marked
The indicator should be used as TTrades shows in its videos, it can also be implemented in ICT strategies.
The indicator takes into consideration the last 2 candles already closed, so on the candle that is forming you can expect reactions in the Pd Array of the Candle Range , below I show examples of how to use it in Multitimeframe
BIAS LONG =
BIAS SHORT =

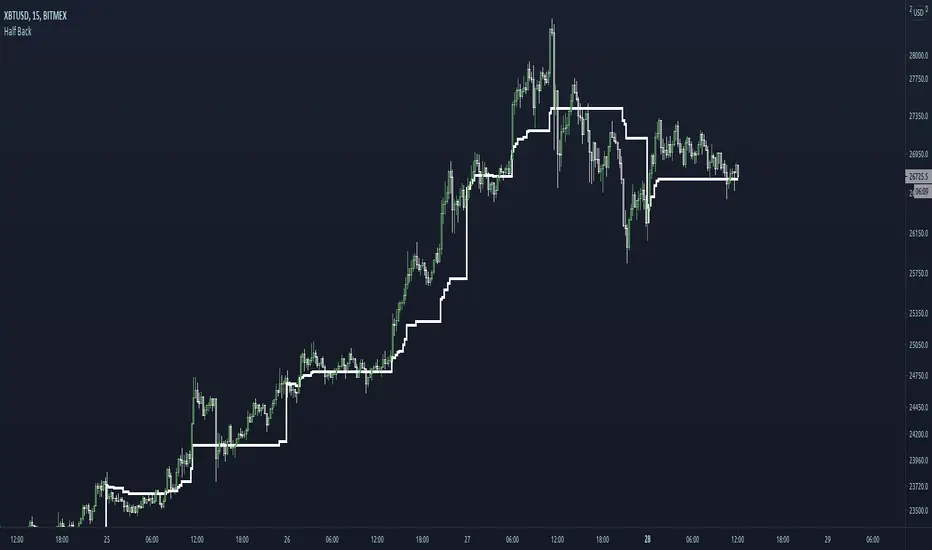
Half BackA dynamic intraday midpoint for Day Timeframe trader reference.
Midpoint is halfway between the day's highest high and lowest low.
Midpoint resets daily.
DDA-Daily Delta Analysis_v2 Fixed the code so you can look at all timeframes and not just the daily.

Bullish Engulfing at Daily Support (Pivot Low) - R Target (v6)1. What this strategy really is (in human terms)
This strategy is not about predicting the market.
It’s about waiting for proof that buyers are stepping in at a price where they already should.
Think of it like this:
“I only buy when price falls into a known ‘floor’ and buyers visibly take control.”
That’s it.
Everything in the script enforces that idea.
2. The two ingredients (nothing else)
Ingredient #1: Daily Support (the location)
Support is an area where price previously fell and then reversed upward.
In the script:
Support is defined as the most recent confirmed daily swing low
A swing low means:
Price went down
Stopped
Then went up enough to prove that buyers defended that level
This matters because:
You’re not guessing where support might be
You’re using a level where buyers already proved themselves
“At support” doesn’t mean exact
Markets don’t bounce off perfect lines.
So the script allows a small zone (the “support tolerance”):
Example: 0.5% tolerance
If support is at 100
Anywhere between ~99.5–100.5 counts
This prevents missing good trades just because price was off by a few ticks.
Ingredient #2: Bullish Engulfing Candle (the trigger)
This is the confirmation.
A bullish engulfing candle means:
Sellers were in control
Buyers stepped in hard enough to fully overpower them
The bullish candle’s body “swallows” the previous candle
Psychologically, it says:
“Sellers tried, failed, and buyers just took control.”
That’s why this candle works only at support.
A bullish engulfing in the middle of nowhere means nothing.
3. Why daily timeframe matters
The daily chart:
Filters out noise
Reflects decisions made by institutions, not random scalpers
Produces fewer but higher-quality signals
That’s why:
The script uses daily data
You typically get very few trades per month
Most days: no trade
That “boredom” is the edge.
4. When a trade is taken (exact conditions)
A trade happens only if ALL are true:
Price drops into a recent daily support zone
A bullish engulfing candle forms on the daily chart
Risk is clearly defined (entry, stop, target)
If any one is missing → no trade
5. How risk is controlled (this is crucial)
The stop loss (where you admit you’re wrong)
The stop is placed:
Below the support level
Or below the low of the engulfing candle
With a small ATR buffer so normal noise doesn’t stop you out
Meaning:
“If price breaks below this area, buyers were wrong. I’m out.”
No hoping. No moving stops. No exceptions.
Position sizing (why this strategy survives losing streaks)
Each trade risks a fixed % of your account (default 1%).
So:
Big stop = smaller position
Small stop = larger position
This keeps every trade equal in risk, not equal in size.
That’s professional behavior.
6. The take-profit logic (why 2.8R matters)
Instead of guessing targets:
The strategy uses a multiple of risk (R)
Example:
Risk = $1
Target = $2.80
You can lose many times and still come out ahead.
This is why:
Win rate ≈ 60% is more than enough
Even 40–45% could still work if discipline is perfect
7. Why patience is the real edge (not the pattern)
The bullish engulfing is common.
Bullish engulfing at daily support is rare.
Most people fail because they:
Trade engulfings everywhere
Ignore location
Lower standards when bored
Add “just one more indicator”
Your edge is:
Saying no 95% of the time
Taking only trades that look obvious after they work
8. How to use this strategy effectively (rules to follow)
Rule 1: Only take “clean” setups
Skip trades when:
Support is messy or unclear
Price is chopping sideways
The engulfing candle is tiny
The market is news-chaotic (earnings, FOMC, etc.)
If you have to convince yourself, skip it.
Rule 2: One trade at a time
This strategy works best when:
You’re not stacked in multiple correlated trades
You treat each setup like it matters
Quality > quantity.
Rule 3: Journal screenshots, not just numbers
After each trade, save:
Daily chart screenshot
Support level marked
Entry / stop / target
After 50–100 trades, patterns jump out:
Best tolerance %
Best stop buffer
Markets that behave well vs poorly
That’s how the original trader refined it.
Rule 4: Expect boredom and drawdowns
You will have:
Weeks with zero trades
Clusters of losses
Long flat periods
That’s normal.
If you “fix” it by adding more trades:
You destroy the edge.
9. Who this strategy is perfect for
This fits you if:
You don’t want screen addiction
You prefer process over excitement
You’re okay being wrong often
You want something you can execute for years
It is not for:
Scalpers
Indicator collectors
People who need action every day
10. The mindset shift (the real lesson of that story)
The money didn’t come from bullish engulfings.
It came from:
Defining one repeatable behavior
Removing everything else
Trusting math + patience
Doing nothing most of the time
If you want, next we can:
Walk through real example trades bar-by-bar
Optimize settings for a specific market you trade
Add filters that increase quality without adding complexity

1-Year High/Low Mean (Daily Anchored)This indicator calculates the highest high and lowest low over the past year using daily candles, then plots the mean (midpoint) between those two levels. The result is a clean, stable structural reference line that helps traders understand where current price sits within its yearly range.
What It Shows
1‑Year High – the highest daily high over the lookback period
1‑Year Low – the lowest daily low over the same period
1‑Year Mean – the midpoint between the yearly high and low
These levels provide a long‑term framework for evaluating trend strength, momentum, and potential mean‑reversion behavior.
Designed for the Daily Timeframe
This indicator is intentionally built for the daily timeframe and higher.
All calculations are anchored to daily data, ensuring consistent and accurate yearly levels.
It does not display on intraday charts to avoid confusion caused by limited intraday history.
Features
Daily‑anchored yearly high, low, and mean
Adjustable lookback period (default: 365 days)
Optional display of the dates where the yearly high and low occurred
Clean, minimal, structure‑focused design
Intended Use
Ideal for traders who want a simple, reliable way to visualize long‑term price structure.
Pairs well with trend‑following systems, breakout strategies, and mean‑reversion setups.
Future versions may include shaded zones, alerts, multi‑year modes, or additional structural tools depending on community interest.

HA Trend Reclaim Daily Structure Pullback🔹 HA Trend Reclaim — Daily Structure Pullback System
HA Trend Reclaim is a professional-grade trend continuation indicator designed to highlight high-probability LONG and SHORT setups using a combination of:
Heikin Ashi candle structure
EMA trend alignment (9 & 50 EMA)
Daily High / Low market structure
Pullback → momentum reclaim logic
This indicator is built for traders who want clarity, discipline, and structure, not noise or over-signaling.
It focuses on trading with the dominant trend, entering only after price pulls back and confirms strength via momentum reclaim.
🔑 What Makes This Different
✔ No counter-trend signals
✔ No breakout chasing
✔ Built-in structure awareness
✔ Clear visual entries & risk levels
✔ Works across stocks, crypto, and futures
This script is ideal for traders who prefer fewer, higher-quality trades rather than constant signals.
2️⃣ HOW TO USE (FEATURED-FRIENDLY VERSION)
🟢 LONG Conditions
A LONG signal appears when:
EMA 9 is above EMA 50
Price is above EMA 50
Price pulls back into the EMA zone
Price reclaims EMA 9 upward
Heikin Ashi candle closes bullish (not a doji)
🔴 SHORT Conditions
A SHORT signal appears when:
EMA 9 is below EMA 50
Price is below EMA 50
Price pulls back into the EMA zone
Price reclaims EMA 9 downward
Heikin Ashi candle closes bearish (not a doji)
📦 Daily Structure Boxes
The indicator highlights the daily high–low range:
Green box → bullish daily bias
Red box → bearish daily bias
These boxes help traders avoid:
Mid-range chop
Late entries
Trading against daily momentum
3️⃣ BEST SETTINGS (VERY IMPORTANT FOR USERS)
Recommended Timeframes
Stocks: 5m, 15m, 1H
Crypto: 15m, 1H, 4H
Futures: 5m, 15m
Recommended Inputs
Setting Value
EMA Fast 9
EMA Slow 50
Swing Lookback 15
Runner RR 2.0
Heikin Ashi Enabled
Show Daily Boxes Enabled
Notes
Higher timeframes = fewer, stronger signals
Avoid low-liquidity instruments
Best used during active sessions (London / NY)

4H & Daily Previous Candle + Fibonacci + OTE# Multi-Timeframe OTE & Fibonacci Indicator (4H & Daily)
This Pine Script v5 indicator is designed for traders who utilize **Optimal Trade Entry (OTE)** zones and **Fibonacci retracements** based on higher timeframe market structures. It automatically identifies and plots key levels from the previous 4-hour and Daily candles to help find high-probability reversal zones.
## Key Features
### 1. Dual Timeframe OTE Zones
- **4H OTE Zone**: Automatically calculates and shades the Optimal Trade Entry area (default 61.8% - 78.6%) based on the previous 4-hour candle's range.
- **Daily OTE Zone**: Plots a secondary OTE zone based on the previous Daily candle, allowing for multi-timeframe confluence analysis.
- **Dynamic Adaptation**: The zones automatically flip based on whether the previous candle was bullish or bearish, ensuring you are always looking at the correct retracement levels.
### 2. Automated Market Structure
- **High/Low Tracking**: Plots clear horizontal lines for the previous 4H and Daily Highs and Lows.
- **Visual Distinction**: Daily levels are highlighted with thicker lines to distinguish them from 4H levels.
- **Price Labels**: Displays real-time price labels for all structural levels for quick reference.
### 3. Customizable Fibonacci Retracements
- **4H Fibonacci Levels**: Plots standard retracement levels (23.6%, 38.2%, 50%, 61.8%, 78.6%) for the 4H timeframe.
- **Fully Adjustable**: Users can input custom Fibonacci levels via the settings menu.
### 4. Real-Time Information Dashboard
- **Range Summary**: A clean table in the top-right corner displays the total pip/point range for both the previous 4H and Daily candles.
- **Clean UI**: All visual elements (colors, line widths, labels) can be toggled or customized to fit any chart theme.
## How to Use
This indicator is ideal for "Smart Money" or "ICT" style trading. Look for **confluence** where the 4H OTE zone overlaps with the Daily OTE zone or other key structural levels to identify high-precision entry points.

Statistcal Daily Profile & Ranges# Statistical Daily Profile & Ranges - TradingView Publication Guide
## Overview
The **Statistical Daily Profile & Ranges** indicator is a comprehensive tool designed to analyze intraday session behavior and daily range characteristics. It combines Average Daily Range (ADR) projection levels with detailed session-by-session statistics and probability-based trading insights derived from historical price action patterns.
## What This Indicator Does
This indicator provides traders with three core analytical components:
1. **ADR Projection Levels** - Dynamic support/resistance levels based on historical daily ranges
2. **Session Range Analysis** - Visual boxes and statistical breakdowns for four key trading sessions
3. **Dynamic Probability Display** - Real-time probability statistics based on overnight session relationships
## How It Works
### Average Daily Range (ADR) Calculation
The indicator calculates the average daily range over a user-defined lookback period (default: 10 days) and projects this range from each day's opening price. This creates two key levels:
- **ADR High**: Opening price + average daily range
- **ADR Low**: Opening price - average daily range
- **ADR Median**: The opening price (middle of the projected range)
These levels are recalculated at the start of each trading day and extend forward, providing dynamic support and resistance zones based on recent volatility characteristics.
### Session Tracking & Statistics
The indicator monitors four distinct trading sessions (times in Eastern Time):
1. **Asia Session** (8:00 PM - 2:00 AM)
2. **London Session** (2:00 AM - 8:00 AM)
3. **NY Open** (8:00 AM - 9:00 AM)
4. **NY Initial Balance** (9:30 AM - 10:30 AM)
For each session, the indicator:
- Draws a colored box showing the session's high-to-low range
- Tracks the opening price, high, and low
- Stores historical data for statistical analysis
- Calculates average ranges by day of week (Monday through Friday)
The session statistics are displayed in a customizable table showing average point ranges for each session across different weekdays, helping traders identify which sessions and days typically produce the most movement.
### Dynamic Probability System
The indicator analyzes the relationship between the Asia and London sessions to determine the current market setup. After the London session closes, it automatically detects one of four possible conditions:
**1. London Engulfs Asia**
- London session breaks both above Asia's high AND below Asia's low
- This indicates strong momentum during the European session
- Most common occurrence pattern
**2. Asia Engulfs London**
- Asia session range completely contains the London session range
- Indicates consolidation during London hours
- Relatively rare pattern (occurs approximately 5.36% of the time)
**3. London Partially Engulfs Upwards**
- London breaks above Asia's high but stays above Asia's low
- Suggests bullish momentum continuation from Asia into London
**4. London Partially Engulfs Downwards**
- London breaks below Asia's low but stays below Asia's high
- Suggests bearish momentum continuation from Asia into London
Once a condition is detected, the indicator displays a probability table showing historically observed outcomes for that specific setup, including:
- Probability of NY session taking out key levels (Asia high/low, London high/low)
- Probability of NY session engulfing the entire overnight range
- Directional bias for NY Cash session (9:30 AM - 4:00 PM)
## How to Use This Indicator
### Initial Setup
1. Add the indicator to your chart (works on any intraday timeframe below Daily)
2. Adjust the **ADR Days** setting (default: 10) to control the lookback period for range calculation
3. Adjust the **Session Lookback Days** setting (default: 50) to determine how much historical data feeds the statistics tables
### Reading the ADR Levels
- Use the **ADR High** and **ADR Low** lines as potential profit targets or areas where price may encounter resistance
- The **ADR Median** line represents the opening price and can act as a pivot point for intraday directional bias
- If price reaches the ADR High early in the session, it suggests strong bullish momentum; conversely for ADR Low
- These levels adapt daily based on recent volatility, making them more responsive than static levels
### Interpreting Session Boxes
- **Session boxes** visually highlight when each trading session is active and its price range
- Larger boxes indicate higher volatility during that session
- Compare current session ranges to the statistical averages shown in the table
- Sessions that are unusually quiet or active relative to historical averages may signal compression or expansion
### Using the Session Statistics Table
- The table shows average point ranges for each session broken down by weekday
- Identify which sessions typically produce the most movement on specific days
- For example, if London on Thursdays averages 40 points while Mondays average 25 points, you can adjust position sizing or expectations accordingly
- The **Total** column shows the overall average across all days
- Sample sizes (shown in brackets if enabled) indicate data reliability
### Trading with the Probability Table
The probability table updates dynamically after the London session closes and shows statistically probable outcomes based on 12 years of NQ futures data.
**Important Limitations:**
- **These probabilities are derived from NQ (Nasdaq E-mini futures) data only**
- **Do NOT apply these probability statistics to other instruments** (ES, stocks, forex, etc.)
- The probabilities represent historical frequencies, not guarantees
- Always combine with your own analysis, risk management, and market context
**How to Apply the Probabilities:**
When **London Engulfs Asia**:
- Watch for NY session to take out London's extremes (72.33% probability for high, 71.12% for low)
- Slight bullish bias in NY Cash session (54.80% vs 45.20%)
- Lower probability of complete overnight engulfment (44.13%)
When **Asia Engulfs London** (rare - 5.36% occurrence):
- Higher probability NY takes Asia's high (75.86%)
- Moderately high probability NY takes Asia's low (65.52%)
- Slight increase in bullish bias (58.42% vs 41.58%)
- Recognize this as an unusual setup
When **London Partially Engulfs Upwards**:
- Very high probability NY takes London high (81.51%)
- Strong probability NY takes London low (64.45%)
- Moderate probability NY takes Asian low (53.16%)
- Slight bullish bias (55.52%)
When **London Partially Engulfs Downwards**:
- Very high probability NY takes London low (75.29%)
- Strong probability NY takes London high (68.80%)
- Moderate probability NY takes Asian high (56.44%)
- Slight bullish bias maintained (52.99%)
### Practical Trading Applications
**Scenario 1: Range Projection**
If the ADR is 500 points and the market opens at 25,000:
- ADR High: 25,500 (potential resistance/target)
- ADR Low: 24,500 (potential support/target)
- Monitor how price interacts with these levels throughout the day
**Scenario 2: Session-Based Trading**
Using the statistics table, you notice London on Wednesdays averages 35 points. During a Wednesday London session:
- If London has already moved 30 points, the session may be exhausting its typical range
- If London has only moved 15 points with an hour remaining, there may be expansion potential
- Adjust stop losses and targets based on typical session behavior
**Scenario 3: Probability-Based Setup**
It's 8:05 AM ET and the indicator shows "London Partially Engulfs Upwards":
- You now know there's an 81.51% historical probability NY will take out London's high
- There's a 53.16% probability NY will reach down to Asia's low
- The NY Cash session has a slight bullish bias (55.52%)
- Consider this alongside your technical analysis for directional bias and level targeting
## Customization Options
### Visual Settings
- **Line Width**: Adjust thickness of ADR levels
- **ADR Color/Style**: Customize appearance of ADR projection lines (solid, dashed, dotted)
- **Median Line**: Toggle visibility and customize appearance separately
- **Session Box Colors**: Customize each session's box color independently
- **Show Session Boxes**: Toggle session box visibility on/off
### Label Settings
- **ADR Labels**: Show/hide labels for ADR High and ADR Low, adjust size
- **Median Label**: Separate control for median line label
- **Session Labels**: Show/hide session name labels, adjust size
- **Label Colors**: Customize text colors for all labels
### Table Settings
- **Session Stats Table**: Position (9 locations available), size (Tiny to Huge), toggle on/off
- **Sample Sizes**: Show/hide the number of historical samples used for each calculation
- **Probabilities Table**: Separate position and size controls, toggle on/off
### Session Times
- Each session's time range can be customized to fit different markets or preferences
- All times are in Eastern Time (America/New_York timezone)
## Technical Notes
### Data Requirements
- The indicator requires sufficient historical data based on your lookback settings
- Minimum recommended: 50+ days of intraday data for reliable statistics
- Works on any timeframe below Daily (1-minute, 5-minute, 15-minute, etc.)
### Calculation Methodology
- **ADR Calculation**: Simple average of absolute daily high-low ranges
- **Session Statistics**: Mean average of ranges for each session filtered by day of week
- **Condition Detection**: Boolean logic comparing session high/low relationships
- All calculations update in real-time as new bars form
### Probability Data Source
The probability statistics displayed in the dynamic table are derived from:
- **Dataset**: 12 years of NQ (Nasdaq E-mini futures) historical data
- **Methodology**: Frequency analysis of outcomes following specific setup conditions
- **Time Period**: Multiple market cycles including various volatility regimes
**Critical Warning**: These probabilities are specific to NQ and reflect that instrument's behavior patterns. Market microstructure, participant behavior, and volatility characteristics differ significantly across instruments. Do not apply these NQ-derived probabilities to other markets (ES, RTY, YM, individual stocks, forex, commodities, etc.).
## Best Practices
1. **Combine with Other Analysis**: Use this indicator as one component of a complete trading methodology, not a standalone system
2. **Respect Risk Management**: Probabilities are not certainties; always use proper position sizing and stop losses
3. **Context Matters**: High-impact news events, holiday trading, and extreme volatility can invalidate typical patterns
4. **Verify Statistics**: Monitor your own results and compare to the displayed probabilities
5. **Adapt Session Times**: If trading instruments with different active hours, adjust session times accordingly
6. **Regular Calibration**: Periodically review if the session averages and probabilities remain relevant to current market conditions
## Understanding Originality
This indicator is original in its approach to combining three analytical frameworks into a single tool:
1. **Dynamic ADR Projection**: Unlike static pivot points, these levels adapt daily based on recent volatility
2. **Session-Specific Statistics**: Goes beyond simple volume profiles by quantifying average ranges for specific time windows across weekdays
3. **Conditional Probability Display**: Automatically detects overnight session relationships and displays relevant probability data rather than showing all scenarios simultaneously
The conditional logic system that determines which probability set to display is a key differentiator—traders only see the statistics relevant to the current market setup, reducing information overload and improving decision-making clarity.
## Summary
The **Statistical Daily Profile & Ranges** indicator provides traders with a comprehensive framework for understanding daily range potential, session-specific behavior patterns, and probability-based setup analysis. By combining ADR projection levels with detailed session statistics and dynamic probability displays, traders gain multiple perspectives on potential price movement within the trading day.
The indicator is most effective when used to:
- Set realistic profit targets based on average daily range
- Identify which sessions typically produce movement on specific weekdays
- Understand probability-weighted outcomes for different overnight setup conditions (NQ only)
- Visualize session ranges and compare them to historical averages
Remember that all statistical analysis reflects historical patterns, and market behavior can change. Always combine indicator signals with sound risk management, proper position sizing, and your own market analysis.

Markov: Transition Matrix [Daily Timeframe]Description
This indicator computes a 3-state Markov chain from price action and visualizes the transition probabilities between daily states:
• Up: daily % change > threshold
• Down: daily % change < -threshold
• Sideways: |daily % change| ≤ threshold
From those states, it builds transition matrices:
• Today → Tomorrow (1 day ahead)
• Today → In 2 days
• Today → In 3 days
Each matrix cell shows:
P(next state | current state)
Rows are the current state (today), columns are the future state (tomorrow / +2 / +3).
Each row sums to 100% (when there is sufficient sample size).
________________________________________
How to read it (trader workflow)
1. Identify the current regime (the most recent confirmed daily state).
2. Look at the row matching that regime:
• The ★ marks the highest probability outcome for that row (most likely next state).
• Heatmap intensity increases as probability increases.
• Each row shows its own sample size (n=...) so you can judge statistical support.
3. Use Quick-read:
• “Now” = current regime
• “Best” = top conditional outcome + probability
• “2nd” = second-best outcome + probability
4. Use Universe (N):
• Shows the marginal distribution: how often days are Up/Down/Sideways across the whole dataset.
________________________________________
Settings
Core logic
• Sideways threshold: controls how strict “Sideways” is.
Example: 0.001 = ±0.10% daily move is considered Sideways.
Display
• Toggle 1D / 2D / 3D matrices.
• Highlight best probability per row (★).
• Show n per row (row transition count).
• Focus: current state row only to reduce noise and speed decision-making.
• Quick-read row for the current regime.
Theme (fully customizable)
All colors can be customized:
• Up / Down / Sideways base colors
• Header background + header text
• Values text
• Quick-read neutral background
This makes it suitable for both light and dark chart themes.
________________________________________
Notes / Limitations
• The indicator is designed for daily sessions. It uses daily close-to-close returns to classify states and update the Markov chain once per day.
• On very volatile assets, a very small threshold can make Sideways rare. If you want a more frequent Sideways regime, increase the threshold.
• This is a statistical visualization tool, not a trading system.
________________________________________
Disclaimer (TradingView-friendly)
This script is provided for educational and informational purposes only and does not constitute financial advice. Trading involves risk. Past probabilities do not guarantee future results. Use at your own discretion and always apply proper risk management.

Optimal Daily MA Suite [MTF]Title: Optimal Daily MA Suite
Description: This is a comprehensive Multi-Timeframe (MTF) analysis suite designed to streamline chart layouts. Instead of loading multiple separate indicators to track various trend lines, this single tool allows traders to overlay higher-timeframe Moving Averages and key support/resistance levels directly onto their intraday charts.
Utility & Workflow: Swing traders and day traders often need to monitor "Big Picture" Daily Moving Averages (like the Daily 200 SMA or Daily 50 EMA) while executing trades on lower timeframes like the 15m or 1H. This tool automates that process, ensuring the major trend context is always visible without cluttering the indicator list.
Key Features:
Multi-Timeframe Engine: By default, all MAs are calculated on the Daily ("D") timeframe, regardless of the chart's current timeframe. This creates a stable "anchor" for trend analysis. The timeframe is fully customizable in the settings (e.g., set to "W" for Weekly analysis).
10 Customizable Slots: Toggle up to 10 different Moving Averages on/off individually.
Flexible Calculation Types: Supports SMA, EMA, WMA, VWMA, RMA (SMMA), and SWMA for every single line.
Trend Cloud Crossovers: Includes two dedicated "Cloud" setups to visualize crossovers (e.g., Golden Cross or Death Cross) with fill shading between the fast and slow lines.
Price Action Crossovers: Optional markers to highlight when the closing price crosses specific MAs.
Contextual Levels: Includes Previous Day High (PDH) and Previous Day Low (PDL) markers for immediate intraday support/resistance context.
How to Use:
Settings: Open the settings menu to select your "Indicator Timeframe" (Default: Daily).
Customization: Enable only the MAs relevant to your strategy (e.g., Enable MA 8 for the 50 SMA and MA 10 for the 200 SMA).
Clouds: Use the "Crossover Set" inputs to define a Bullish/Bearish trend cloud between two moving averages of your choice.
Technical Note: This script uses request.security with lookahead=barmerge.lookahead_off to ensure no repainting of historical data while providing accurate higher-timeframe values on closed bars.
Credits: Standard Moving Average calculations based on TradingView built-in functions.

IDLP - Intraday Daily Levels Pro [FXSMARTLAB]🔥 IDLP – Intraday Daily Levels Pro
IDLP – Intraday Daily Levels Pro is a precision toolkit for intraday traders who rely on objective daily structure instead of repainting indicators and noisy signals.
Every level plotted by IDLP is derived from one simple rule:
Today’s trading decisions must be based on completed market data only.
That means:
✅ No use of the current day’s unfinished data for levels
✅ No lookahead
✅ No hidden repaint behavior
IDLP reconstructs the previous trading day from the intraday chart and then projects that structure forward onto the current session, giving you a stable, institutional-style intraday map.
🧱 1. Previous Daily Levels (Core Structure)
IDLP extracts and displays the full previous daily structure, which you can toggle on/off individually via the inputs:
Previous Daily High (PDH)
Previous Daily Low (PDL)
Previous Daily Open
Previous Daily Close,
Previous Daily Mid (50% of the range)
Previous Daily Q1 (25% of the range)
Previous Daily Q3 (75% of the range)
All of these come from the day that just closed and are then locked for the entire current session.
What these levels tell you:
PDH / PDL – true extremes of yesterday’s price action (liquidity zones, breakout/reversal points).
Previous Daily Open / Close – how the market positioned itself between session start and end
Mid (50%) – equilibrium level of the previous day’s auction.
Q1 / Q3 (25% / 75%) internal structure of the previous day’s range, dividing it into four equal zones and helping you see if price is trading in the lower, middle, or upper quarter of yesterday’s range.
All these levels are non-repaint: once the day is completed, they are fixed and never change when you scroll, replay, or backtest.
🎯 2. Previous Day Pivot System (P, S1, S2, R1, R2)
IDLP includes a classic floor-trader pivot grid, but critically:
It is calculated only from the previous day’s high, low, and close.
So for the current session, the following are fixed:
Pivot P – central reference level of the previous day.
Support 1 (S1) and Support 2 (S2)
Resistance 1 (R1) and Resistance 2 (R2)
These levels are widely used by institutional desks and algos to structure:
mean-reversion plays, breakout zones, intraday targets, and risk placement.
Everything in this section is non-repaint because it only uses the previous day’s fully closed OHLC.
📏 3. 1-Day ADR Bands Around Previous Daily Open
Instead of a multi-day ADR, IDLP uses a pure 1-Day ADR logic:
ADR = Range of the previous day
ADR = PDH − PDL
From that, IDLP builds two clean bands centered around the previous daily Open:
ADR Upper Band = Previous Day Open + (ADR × Multiplier)
ADR Lower Band = Previous Day Open − (ADR × Multiplier)
The multiplier is user-controlled in the inputs:
ADR Multiplier (default: 0.8)
This lets you choose how “tight” or “wide” you want the ADR envelope to be around the previous day’s open.
Typical use cases:
Identify realistic intraday extension targets, Spot exhaustion moves beyond ADR bands, Frame reversals after reaching volatility extremes, Align trades with or against volatility expansion
Again, since ADR is calculated only from the completed previous day, these bands are totally non-repaint during the current session.
🔒 4. True Non-Repaint Architecture
The internal logic of IDLP is built to guarantee non-repaint behavior:
It reconstructs each day using time("D") and tracks:
dayOpen, dayHigh, dayLow, dayClose for the current day
prevDayOpen, prevDayHigh, prevDayLow, prevDayClose for the previous day
At the moment a new day starts:
The “current day” gets “frozen” into prevDay*
These prevDay* values then drive: Previous Daily Levels, Pivots, ADR.
During the current day:
All these “previous day” values stay fixed, no matter what happens.
They do not move in real time, they do not shift in replay.
This means:
What you see in the past is exactly what you would have seen live.
No fake backtests.
No illusion of perfection from repainting behavior.
🎯 5. Designed For Intraday Traders
IDLP – Intraday Daily Levels Pro is made for:
- Day traders and scalpers
- Index and FX traders
- Prop firm challenge trading
- Traders using ICT/SMC-style levels, liquidity, and range logic
- Anyone who wants a clean, institutional-style daily framework without noise
You get:
Previous Day OHLC
Mid / Q1 / Q3 of the previous range
Previous-Day Pivots (P, S1, S2, R1, R2)
1-Day ADR Bands around Previous Day Open
All calculated only from closed data, updated once per day, and then locked.
