Chỉ báo Pine Script®
Tìm kiếm tập lệnh với "daily"
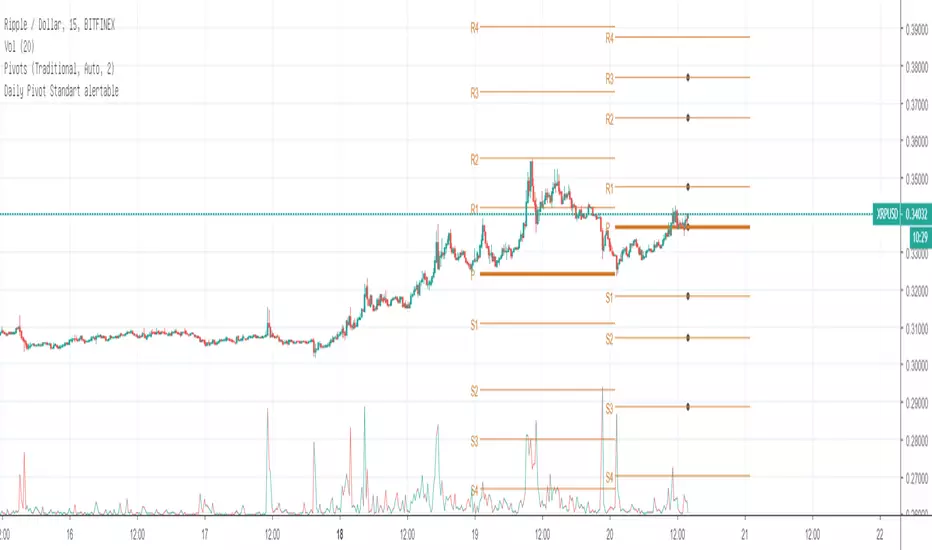
Daily Pivot Standart alertableWith this Indicator u can set allert between the Pivot points s15.directupload.net
So it is useful for scalping
Chỉ báo Pine Script®
Chỉ báo Pine Script®
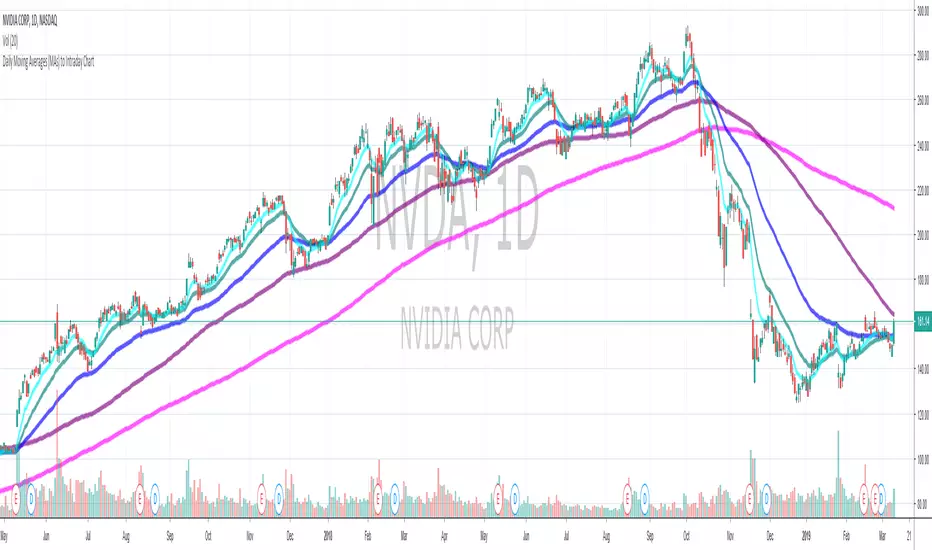
Daily Moving Average to Intraday Chart BradleyRUses Robertob's Script with Mike's colors for Warrior Pro Students.
Chỉ báo Pine Script®

Chỉ báo Pine Script®

BTC Swinger v1Daily interval swing trading algorithm based on momentum techniques using ATR Stops. Made by Kory Hoang from Stably.
Shout out to the Advanced Crypto Asset Trading crew! ;)
Chiến lược Pine Script®

MY_CME eod OI vs CFTC eow OIDaily e-o-d Open Interest as published by CME.
As CFTC COT Open Interest relates to last Tuesday, here you can have an idea how things evolved day-by-day since then.
As CME total OI is not accessibl as data, here I sum OI of the next 9 outstanding contracts, which gives a fair idea of the trend in OI
Chỉ báo Pine Script®

Chỉ báo Pine Script®

MTF EMA Combo with Background ColorDaily/Weekly EMA combo for longer term trend direction, with combo background color for varying trend direction.
Chỉ báo Pine Script®

Chỉ báo Pine Script®

Chỉ báo Pine Script®

Daily Average True Range OverlayPlots the upper and lower average true range away from the previous days close on all time frames.
Chỉ báo Pine Script®

Daily Deviations (Lazy Edition)
Plots the standard deviation resistance/support lines.
Uses Previous days close and the VIX as the volatility factor.
credit to u/UberBotMan and u/Living_Granger for the idea and formulas
Chỉ báo Pine Script®

Daily Deviations (Self Input Version)
Plots the standard deviation resistance/support levels.
Input the previous settlement price and the implied volatility.
credit to u/UberBotMan and u/Living_Granger for the idea and formulas
(preview example is using settlement of 2420 and IV of 11)
Chỉ báo Pine Script®

Chỉ báo Pine Script®

Daily Returns & STDWhat happened last time when xx increased by xx%? - Start collecting some stats!
You can choose the ticker and the timeframe you're interested in
Chỉ báo Pine Script®

RSI Oversold/UndersoldThe study script will place GREEN BUY arrows BELOW oversold conditions and RED SHORT arrows ABOVE overbought conditions. You can configure the period
Most RSI(14) indicators use a 14-period, I prefer a 5-period. The period, overbought and oversold periods are settings that can easily be changed by adding this study to your chart and clicking the "gear" icon next to the study inside your chart.
Chỉ báo Pine Script®

Chỉ báo Pine Script®

Risk Command CenterRisk Command Center
Concept & Philosophy Trading psychology is the hardest edge to master. The "Risk Command Center" is designed to act as a visual accountability partner for day traders. It tackles the common problem of "Tilt" (emotional trading) by forcing you to confront your P&L and Risk Limits visually before you reach a breaking point.
Unlike automated trackers, this tool relies on Manual Accountability. By manually inputting your P&L after every trade, you engage your prefrontal cortex (logic), breaking the "trance" of emotional trading. This script visualizes your Daily Loss Limit not as a number, but as "Ammo"—a resource bar that depletes as you take risks.
Key Features
Visual Risk Bar: A health-bar style display that fills up as you approach your Max Daily Loss.
Adaptive Environment: The chart background changes color subtly (Yellow -> Orange -> Red) as your risk increases, giving you subconscious cues to slow down.
The "Tilt Guard": If you breach your Max Loss limit or hit your max "Consecutive Loss" streak, the screen locks down with a "TRADING STOPPED" enforcement label.
Session Timer: Automatically greys out the dashboard and background when the market session is closed, helping you avoid low-probability trading hours.
Strike Counter: Tracks consecutive losses to prevent "revenge trading" spirals.
How It Works This indicator does not connect to your broker (Pine Script security limitation). It operates as a Heads-Up Display (HUD) that you control:
Input: You set your Max Daily Loss (e.g., $500).
Process: As you trade, you update your Current Session P&L in the settings.
Calculation: The script calculates your % Risk Used and updates the dashboard.
Alerts: If Net P&L <= -Max Limit OR Consecutive Losses >= Max Streak, the visual alarms trigger.
How to Use This Tool
Pre-Market: Open the settings and define your Max Daily Loss Limit (e.g., $600) and Allowed Trading Session (e.g., 0930-1600).
During Trading: Keep the settings window accessible. After every closed trade, type your P&L into the Current Session P&L field.
Example: If you lose $150, type -150. If you win $300 next, change it to +150 (net).
Monitoring: Watch the "Ammo Left" and the "Risk Level" bar.
Green: Safe Zone.
Orange: Caution (75% of limit used).
Red: Breach. Walk away.
Settings Breakdown
Max Daily Loss Limit: Your hard stop for the day.
Current Session P&L: The input field for your running total.
Max Consecutive Losses: The number of losses in a row allowed before a forced break.
Allowed Trading Session: The time window where the dashboard is "Active." Outside this window, it shows "CLOSED."
Disclaimer This tool is for educational and risk-management purposes only. It cannot physically prevent you from placing trades on your broker. It is a visual aid to support disciplined trading habits.
Chỉ báo Pine Script®

Tactical DeviationThis indicator is a mean-reversion system grounded in statistical deviation from the Volume Weighted Average Price (VWAP). Unlike standard Bollinger Bands or static envelopes, the "Tactical Deviation" script integrates Multi-Timeframe Analysis, Dynamic Volatility Scaling, and Market Structure Validation to identify high-probability exhaustion points.
Underlying Concepts & Methodology
The core philosophy of this script is that price tends to revert to its volume-weighted mean after reaching statistical extremes. However, identifying true extremes requires more than just standard deviation. This script employs a three-layer validation filter:
Multi-Timeframe Confluence: The script calculates VWAP and Standard Deviation bands simultaneously for Daily, Weekly, and Monthly timeframes. It allows traders to visualize where short-term price action deviates significantly from longer-term volume trends. A key feature is the "Confluence Mode," which filters out noise by only flagging opportunities where price is overextended on multiple timeframes (e.g., Daily AND Weekly) simultaneously.
Dynamic Volatility Adjustment (Originality): Standard deviation bands are often too static. This script includes a "Dynamic Multiplier" algorithm that ingests Average True Range (ATR) data to adjust the band width.
Logic: Multiplier_Adjusted = Base_Multiplier * (1 + (ATR / Price * 10))
This ensures that during high-volatility events, the bands expand to prevent premature signals, while finding tighter entries during consolidation.
Structural & Volume Validation: Many mean-reversion indicators fail by "catching a falling knife." To mitigate this, this script does not signal solely on band touches. It requires two additional confirmations:
Pivot Confluence: The price must be interacting with a recent Swing Low (for longs) or Swing High (for shorts) specifically calculated within a user-defined lookback period.
Volume Injection: A signal is only valid if volume exceeds its moving average by a defined factor (default 1.5x) or shows significant momentum, confirming institutional participation at the reversal point.
Features & Settings
Deviation Clouds: Visualizes the 1σ-3σ zones with customizable transparency to highlight areas of statistical significance without cluttering the chart.
Signal Filter:
RSI Filter: Optional integration to ensure momentum is also overbought/oversold alongside price deviation.
Pivot Lookback: Adjusts the sensitivity of the market structure detection.
Info Panel: A dashboard displaying the current deviation (in Sigma) for all three monitored timeframes in real-time.
How to Use
This tool is designed for mean reversion trading.
Identify Extremes: Watch for price entering the outer deviation clouds (2σ or 3σ) on the Daily or Weekly VWAP.
Wait for Confirmation: Do not enter blindly on a band touch. Wait for the signal triangle, which confirms that Volume, RSI (if enabled), and Pivot Structure have aligned to suggest a probable reversal.
Risk Management: Use the VWAP itself (the center line) as a dynamic take-profit target, as price statistically gravitates back to this volume-weighted center.
Chỉ báo Pine Script®

Liquidity Heatmap Matrix [MTF] - PhenLabs📊Liquidity Heatmap Matrix
Version: PineScript™v6
📌Description
The Liquidity Heatmap Matrix is a multi-timeframe liquidity detection and visualization tool built to identify where equal highs and equal lows are forming across up to five configurable timeframes. It solves a core challenge for smart money and ICT-style traders: knowing exactly where stop-loss clusters and liquidity pools are building — before price sweeps them.
Rather than manually scanning multiple timeframes for double tops and bottoms, this indicator automates the entire process and presents confluence-weighted liquidity zones as a heatmap overlay directly on your chart. Levels confirmed by more timeframes glow with greater intensity, giving you an immediate sense of which zones carry the highest probability of a liquidity grab.
When price sweeps through a detected level, the indicator confirms it in real time with on-chart labels, color changes, and optional alerts — turning reactive analysis into proactive trade planning.
🚀Points of Innovation
● First-of-its-kind heatmap approach that scores liquidity zones on a 1-to-5 confluence scale across independent timeframes
● Automatic merging of nearby equal levels using a percentage-based tolerance system, eliminating duplicate zone clutter
● Real-time sweep confirmation engine that detects when price pierces a level and closes back inside, validating the liquidity grab
● Dynamic zone coloring that shifts from transparent to fully opaque as more timeframes confirm the same price level
● Built-in dashboard that ranks all active levels by confluence strength and tracks bullish versus bearish sweep counts
● Comprehensive alert suite covering new equal high/low formation and sweep events for both directions
🔧Core Components
● Multi-Timeframe Pivot Engine: Runs pivot high/low detection independently on each of the five timeframes using request.security calls, then feeds results into a unified level registry
● Equal Level Comparator: Compares each new pivot against a rolling window of recent pivots using a configurable percentage tolerance to identify price levels that have been tested more than once
● Confluence Merger: When the same price level appears on multiple timeframes, the system merges them into a single zone and increments the confluence score rather than stacking overlapping boxes
● Sweep Detection Module: Monitors all active levels bar-by-bar, confirming a sweep when price breaches the zone edge and then closes back within it — filtering out false breakouts
● Heatmap Renderer: Translates each level’s confluence score into a color intensity gradient, with separate palettes for equal highs (red spectrum) and equal lows (green spectrum)
● Dashboard Table: Displays every active level in a sortable table with type, price, per-timeframe dot indicators, confluence rating, and sweep status
🔥Key Features
● Supports 5 fully independent timeframes that can be toggled on or off and set to any interval from 1 minute to Monthly
● Heatmap coloring intensity scales automatically with confluence count — single-timeframe levels appear faint while 5-TF levels are fully saturated
● Sweep labels display the direction, confluence count, confirming timeframes, and exact price of each swept level directly on the chart
● Dashboard tracks all active equal high and equal low levels sorted by confluence descending with real-time bull and bear sweep counters
● Four alert conditions cover new equal highs, new equal lows, bearish sweeps (EQH taken), and bullish sweeps (EQL taken)
● Swept zones automatically change to a distinct highlight color and freeze their right edge at the sweep bar for clear historical reference
● Old swept levels are cleaned up after 100 bars and stale unswept levels expire after 500 bars to keep the chart uncluttered
● All zone colors, widths, extension lengths, and dashboard positioning are fully customizable
🎨Visualization
● Liquidity Zone Boxes: Colored rectangles overlaid on the chart representing each equal high or equal low level — red-spectrum for EQH, green-spectrum for EQL, with opacity increasing as confluence rises
● Heatmap Intensity Gradient: Single-TF zones appear nearly transparent while 5-TF zones are fully opaque, creating a visual heat signature of where liquidity is densest
● Sweep Labels: Appear at the sweep bar with directional arrows (🔻 for EQH swept, 🔺 for EQL swept), showing confluence count, confirming timeframe list, and price
● Swept Zone Highlight: Confirmed sweeps turn the zone box to a yellow highlight color, clearly distinguishing consumed liquidity from active levels
● Dashboard Table: A compact on-chart table (repositionable to any corner) showing Type, Price, per-TF active dots (● / ○), and confluence rating for every tracked level
● Summary Footer: Bottom row of the dashboard displays total bullish sweeps, bearish sweeps, and combined sweep count
📖Usage Guidelines
● TF 1 through TF 5 Enabled — Toggle each timeframe on or off (Default: TF1 and TF2 enabled, TF3-TF5 disabled)
● TF 1 through TF 5 Interval — Set each timeframe independently (Defaults: 5m, 15m, 1H, 4H, Daily)
● Pivot Lookback Left — Number of bars to the left for pivot detection (Default: 6, Range: 1–50)
● Pivot Lookback Right — Number of bars to the right for pivot confirmation (Default: 6, Range: 1–50)
● Equal Level Tolerance (%) — Maximum percentage difference for two pivots to be considered equal (Default: 0.1%, Range: 0.01–2.0%)
● Max Pivots to Compare — Rolling window size of recent pivots checked for equal levels (Default: 5, Range: 2–10)
● Max Active Levels — Maximum number of liquidity zones tracked simultaneously (Default: 20, Range: 5–50)
● Sweep Confirm Bars — Bars to wait before confirming a sweep after price pierces a level (Default: 2, Range: 1–10)
● Show Liquidity Zones — Toggle zone box rendering on or off (Default: On)
● Show Sweep Labels — Toggle sweep confirmation labels on or off (Default: On)
● Show Dashboard — Toggle the summary dashboard table on or off (Default: On)
● Zone Width (%) — Percentage-based half-width of each liquidity zone box (Default: 0.05%, Range: 0.01–1.0%)
● Zone Extend (bars) — How far forward active zone boxes extend on the chart (Default: 50, Range: 10–200)
● Dashboard Position — Corner placement of the dashboard table (Options: Top Right, Bottom Right, Top Left, Bottom Left)
● EQH Colors — Customizable color range from 1-TF to 5-TF confluence for equal high zones (Default: Red spectrum with varying transparency)
● EQL Colors — Customizable color range from 1-TF to 5-TF confluence for equal low zones (Default: Green spectrum with varying transparency)
● Swept Zone Color — Highlight color for levels that have been confirmed swept (Default: Yellow at 30% transparency)
✅Best Use Cases
● Identifying high-probability reversal zones where liquidity has clustered across multiple timeframes before entering a mean-reversion trade
● Pre-planning take-profit targets by locating where dense liquidity pools sit above or below current price
● Filtering breakout trades by checking whether price is approaching a high-confluence liquidity zone likely to cause a sweep and reversal
● Confirming ICT and smart money concepts by visualizing where equal highs and equal lows form as institutional liquidity targets
● Setting up sweep-based alerts to get notified the moment a multi-TF liquidity level gets taken, enabling rapid reaction entries
● Using the dashboard as a real-time liquidity scoreboard during active trading sessions to track which levels remain live and which have been consumed
⚠️Limitations
● Pivot detection requires a right-side lookback, so level identification has an inherent delay equal to the Pivot Lookback Right setting
● Very low tolerance values on volatile assets may produce few matches, while very high values may create false confluences — tuning to the asset’s typical spread is recommended
● The indicator tracks up to the Max Active Levels limit, so on extremely active charts some older unswept levels may be pruned before they are reached
● Multi-timeframe security calls can increase chart loading time, especially when all five timeframes are enabled on lower-timeframe charts
● Sweep detection relies on close price returning inside the zone — wicks that pierce and immediately reverse on the same bar without closing inside may not be captured
● This tool identifies liquidity zones and sweeps but does not generate buy or sell signals — it is designed to complement your existing strategy, not replace it
💡What Makes This Unique
● Confluence-weighted heatmap visualization is a fundamentally different approach to liquidity mapping compared to simple equal-high/low markers, providing probabilistic weight to each level
● The automatic cross-timeframe merging system eliminates zone stacking and clutter that plagues most multi-timeframe indicators
● Real-time sweep confirmation with multi-bar validation filters out noise and false breakouts that single-bar detection methods frequently flag
● The integrated dashboard provides a full-spectrum situational awareness panel without needing to switch between timeframes or use multiple indicators
🔬How It Works
● Step 1 — Pivot Detection: On each enabled timeframe, the script independently identifies pivot highs and pivot lows using a configurable left/right lookback window via ta.pivothigh and ta.pivotlow functions
● Step 2 — Equal Level Matching: Each new pivot is compared against a rolling buffer of recent pivots on the same timeframe; if two pivots fall within the percentage tolerance, an equal high or equal low is flagged
● Step 3 — Cross-Timeframe Registration and Merging: Detected equal levels are registered into a central level array; if a level from one timeframe falls near an existing level, it merges by incrementing the confluence score rather than creating a duplicate
● Step 4 — Heatmap Rendering: Each active level is drawn as a zone box with color intensity mapped to its confluence score using a 5-tier gradient — more confirming timeframes produce more visually prominent zones
● Step 5 — Sweep Monitoring: Every bar, the script checks whether price has breached a zone edge and closed back inside, confirming a liquidity sweep; confirmed sweeps update the zone color, freeze the box, and generate labels and alerts
● Step 6 — Lifecycle Management: Swept levels are retained for 100 bars for historical reference then removed; unswept levels older than 500 bars are pruned to maintain chart performance and visual clarity
💡Note:
For best results, start with the default settings and adjust tolerance and pivot lookback values to match the volatility profile of your specific asset. Lower timeframe combinations (e.g., 5m + 15m) are ideal for intraday scalping, while higher timeframe setups (e.g., 1H + 4H + Daily) suit swing trading. This indicator is designed as a confluence tool — combine it with your existing strategy, order flow analysis, or market structure methodology for highest-probability trade setups. It does not produce buy or sell signals on its own.
Chỉ báo Pine Script®

PyraTime Liquidity & TimeThe Problem:
Why Most Traders Get Trapped Most trading indicators fail because they only look at half the picture: Price. Traders draw support and resistance lines, wait for the price to hit them, and then get stopped out by a wick that instantly reverses. This is a "Liquidity Sweep," and it is how institutional algorithms trap retail traders.
Furthermore, free indicators often suffer from the "Floating Indicator" bug—where lines detach from price during zooming—making them unreliable for precision trading.
The Solution: PyraTime Liquidity & Time PyraTime L&T solves this by filtering every price move through Time. It does not just ask "Is price at support?" It asks "Is price at support at the exact right time?"
This tool combines three institutional concepts into one dashboard:
Geometric Liquidity Traps: Identifies when a swing point is swept (false breakout) exactly during a Fibonacci Time Cluster.
Institutional Time Cycles: Projects future volatility windows (Gold Lines) based on the geometry of past pivots.
Silver Bullet Zones: Automatically highlights the specific hours where algorithms are most active (London, NY, Tokyo sessions).
How to Use This Indicator
1. The "Trap" Signal (Your Entry Trigger) The core function of this tool is to identify "Time-Price Traps."
Wait for a Signal: A "TRAP" or "SWEEP" label will appear when price breaks a previous high/low but closes back inside the range AND this happens inside a Fibonacci Time Cluster.
The Logic: This confirms that Time and Price have squared. It is a high-probability reversal signal.
Cyan Label: Bullish Trap (Look for Longs)
Pink Label: Bearish Trap (Look for Shorts)
2. The Golden Time Lines (Your Filter) The vertical Gold lines are future time projections.
Cluster Confirmation: If you see multiple Gold lines grouped closely together, expect high volatility or a reversal at that specific time.
Trade Filter: Do not take a trade just because a line appears. Use it to time your entry at a key price level.
3. Silver Bullet Zones (Session Awareness) The indicator highlights the three most powerful 60-minute windows in the market (New York Time).
London SB (03:00 - 04:00): Often sets the high or low of the London session.
New York SB (10:00 - 11:00): The classic "Silver Bullet" continuation or reversal window.
Tokyo SB (22:00 - 23:00): Key for crypto and Asian forex pairs.
PRO TIP: Managing the Noise
For High Timeframes (4H, Daily): Go to Settings and uncheck "Silver Bullet Zones." These zones are designed for intraday "zoning in" (1m to 15m charts) and will look cluttered on a Daily chart.
For Precision (1m - 15m): Turn the Silver Bullet Zones ON to see exactly when the algorithmic windows open.
Technical Features & Compliance
Zero Repainting: Signals are confirmed on candle close. History is never altered.
Floating Fix: Built with xloc.bar_time to ensure all drawings stay locked to their exact historical moment, regardless of chart scaling.
Memory Optimized: Automatically cleans up old lines to maintain maximum performance on all devices.
Chỉ báo Pine Script®

HTF Candle Projections [LuxAlgo]The HTF Candle Projections indicator projects recent and current higher timeframe candles onto the right side of the chart, providing a clear visualization of macro trends and internal candle composition.
🔶 USAGE
The tool is designed to bridge the gap between lower timeframe execution and higher timeframe context. By projecting HTF candles into the future space (right of the current bar), traders can maintain a clear perspective on the larger trend without constantly switching tabs.
🔹 HTF Trend Alignment
Traders can use the projected candles to ensure their lower timeframe (LTF) entries align with the broader market direction. For instance, a scalp trader might only look for long setups if the current projected Daily candle is bullish. This "Top-Down" filter helps traders avoid "fighting the trend" by providing a constant visual reminder of the HTF candle's polarity and momentum.
🔹 Anticipating Reversals & Level Origins
The indicator includes connection lines that trace back from the projected HTF wicks to the exact LTF bars that established the High and Low of that period. This allows traders to pinpoint the specific price action or "order block" responsible for the HTF extrema. If price returns to the origin of an HTF wick, traders can watch for a reaction, as these levels often represent areas of significant supply or demand.
🔹 Internal Sentiment Divergence
A unique feature of this script is the "Internal Sentiment Bars." These small bars inside the HTF candle body show the ratio of bullish vs. bearish LTF bars that make up that specific HTF candle.
If a bullish HTF candle has a high bearish sentiment bar, it suggests a "weak" or "grinding" trend where sellers are actively fighting the move, potentially signaling exhaustion.
Conversely, if the sentiment bars align strongly with the HTF candle direction (e.g., a bullish candle with almost entirely bullish sentiment), it indicates a high-conviction "power move" with little resistance.
🔹 Range Play & Breakouts
The indicator highlights the absolute highest high and lowest low of the entire projected sequence with solid connection lines. These lines define the current HTF trading range. Traders can use these boundaries to identify mean reversion opportunities within the range or to prepare for high-probability breakout trades once price moves beyond these absolute levels.
🔹 Visualizing Wick Development
By observing the live development of the current HTF candle, traders can see "wicking" behavior as it happens. If the current price is far from the HTF high but the connection line remains anchored there, it visually confirms a rejection from that level. This real-time feedback is crucial for identifying if an HTF candle is closing as a "Pin Bar" or "Shooting Star" before the timeframe actually expires.
🔶 DETAILS
The script uses a custom data structure to track the Open, High, Low, and Close of the selected timeframe. It also tracks the specific bar index of the highs and lows to draw the connection lines accurately. The absolute high and low of the entire projected sequence are highlighted with solid lines to identify the "Range High" and "Range Low" of the projected window.
🔶 SETTINGS
HTF Timeframe: Sets the higher timeframe to be projected (e.g., Daily, Weekly, Monthly).
Candle Width (Bars): Determines how many bars wide each projected candle appears on the right side of the chart.
Gap Between Candles: Sets the horizontal spacing between the projected HTF candles.
Number of HTF Candles: The total number of candles to project (previous completed candles + current live candle).
Show Internal Sentiment Bars: Toggles the visibility of the internal bull/bear composition bars.
🔹 Colors
HTF Bull/Bear Body: Adjusts the colors and transparency of the main projected candle bodies.
Sentiment Bull/Bear: Sets the color for the internal composition bars (ratio of LTF closes).
Wick Color: Customizes the color of the projected candle wicks.
Connection Line: Sets the color for the dotted lines connecting HTF wicks to their LTF origins.
Absolute High/Low Connection: Sets the color for the solid lines marking the highest and lowest points of the projected set.
Chỉ báo Pine Script®
