Daily Anchored VWAPAnchors VWAP to whatever time you want instead of the usual start of session. I use it for BTC so that I can anchor around NY open instead of the night before.
Tìm kiếm tập lệnh với "daily"

Daily RDR (Prev Day H/L, Intraday)This indicator identifies intraday Range-Deviation Reversal (RDR) signals using the previous day’s high and low. At each new session, it stores yesterday’s levels and resets today’s range tracking. During the day, it detects when price first breaks above the prior high or below the prior low, then waits for a reversal: a bearish RDR triggers when price exceeds yesterday’s high and then closes back below it, while a bullish RDR triggers when price undercuts yesterday’s low and then closes back above it. The script plots the previous day’s levels and marks RDR reversals with small up/down triangles.

Daily Weekly Highs & LowsOverview
This indicator automatically plots the previous day’s and previous week’s Highs and Lows, giving you instant clarity on the most important market liquidity levels. These levels often act as magnets for price and serve as key decision zones for intraday and swing traders.
Whether you're looking for liquidity sweeps, breakout confirmations, or simple bias alignment — this tool gives you an immediate visual edge.
Features
Precise anchoring from HH/LL
Lines begin exactly at the previous High/Low with no delays or offsets, ensuring clean and accurate structure visualization.
Visual breakout detection
The indicator highlights where price has broken above or below the previous day/week levels, helping you instantly spot liquidity grabs and market intent.
How It Works
Automatically detects the previous day’s High/Low.
Automatically detects the previous week’s High/Low.
Plots clean horizontal levels starting from the original HH/LL point.
Monitors price in real time and marks the exact candle that breaks the level.
Optionally highlights sweeps or simple breaks, depending on your trading style.
How to Use
Use previous day High/Low for intraday bias, liquidity sweeps, and breakout plays.
Use previous week High/Low for swing bias and higher-timeframe liquidity targets.
Combine breaks with your entry model (FVG, BOS/CHOCH, displacement, etc.).
Watch for fakeouts (liquidity sweeps) followed by reversal signals on lower timeframes.
Monitor alert notifications to avoid staring at the chart all day.
Alerts
Receive notifications the moment price interacts with key levels:
Previous Day High Break
Previous Day Low Break
Previous Week High Break
Previous Week Low Break
(Alerts trigger exactly at the level break — no repainting.)

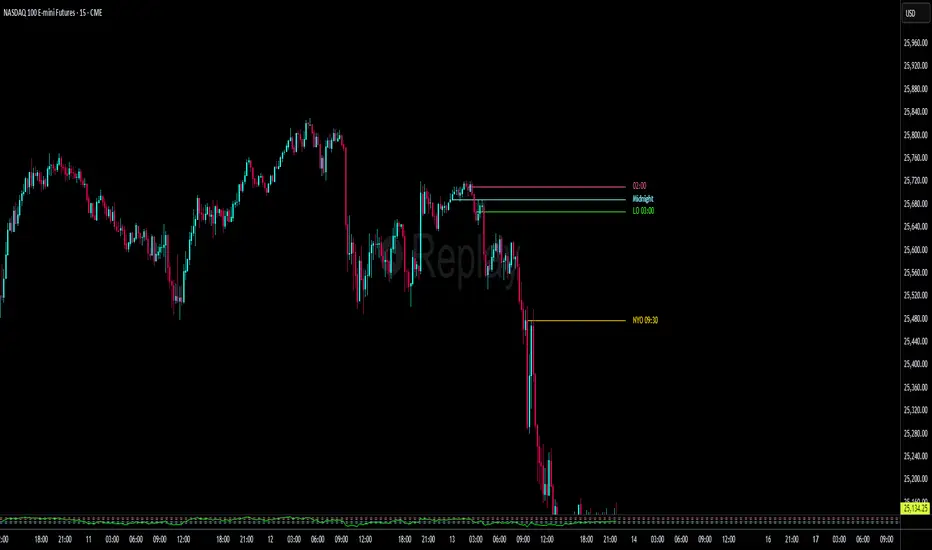
Daily 4H LevelsThis indicator will automatically demarcate the 4H openings for NQ1!. Please give me feedback if you find anything as its a work in progress.
Expsoure Guide by Tradewith_GaryDaily Guide for exposure building. Use this Indicator to improve your profitability by avoiding over-trading and picking the best days to initiate new trades. Valid only for swing trading format.

Daily Vertical LineToggle to draw a vertical line through the start of each day. E.g. a dotted vertical line appears through the first candle of the day on any candle scale (up to around 2months prior)


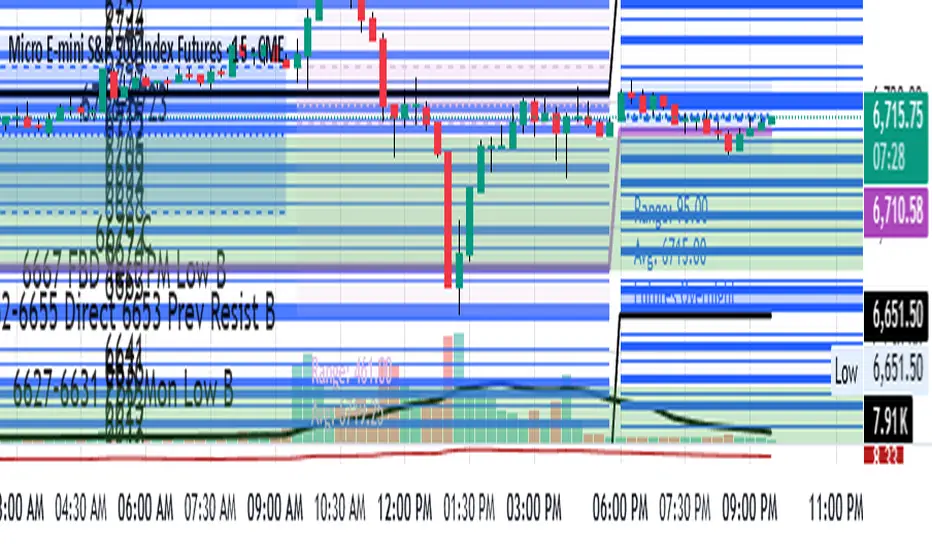
Daily LevelsThis indicator allows one to paste price levels from an outside source and draws lines at those levels. A level can be a line (1 price level) or a price range. It can also be identifies as a Major Level or a minor level. Individual notes can be entered at each level by placing the text in brackets (this type "{ }"). Text cannot include parentheses and dashes. Separate each day's levels with a date in brackets. Date format and bracket type bust be like this: . The lines for each level is drawn from 6pm on the prior date to 4:45pm of the date.
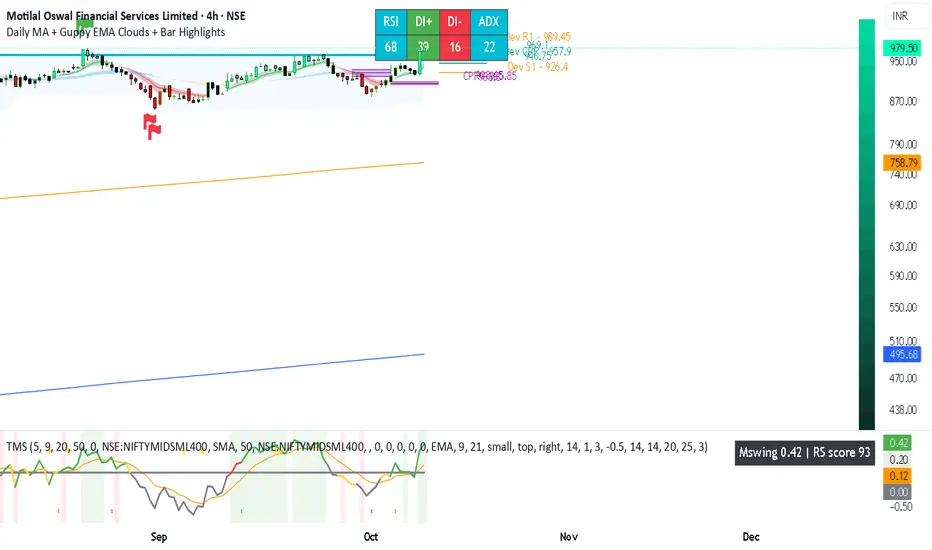
Daily MA + Guppy EMA Clouds + Bar HighlightsThis script is a modular strength dashboard combining:
- Multi-timeframe MAs
- Guppy clouds
- CPR pivots
- Momentum gauges
- Breakout flags
It’s ideal for traders who want layered confirmation across trend, volatility, and support/resistance zones.
Vol - Traded Value (₹ Cr)Daily Traded Volume in Crores.
To know how much of a Stock is trades in Value Terms

Daily Pivot Points - Fixed Until Next Day(GeorgeFutures)We have a pivot point s1,s2,s3 and r1,r2,r3 base on calcul matematics


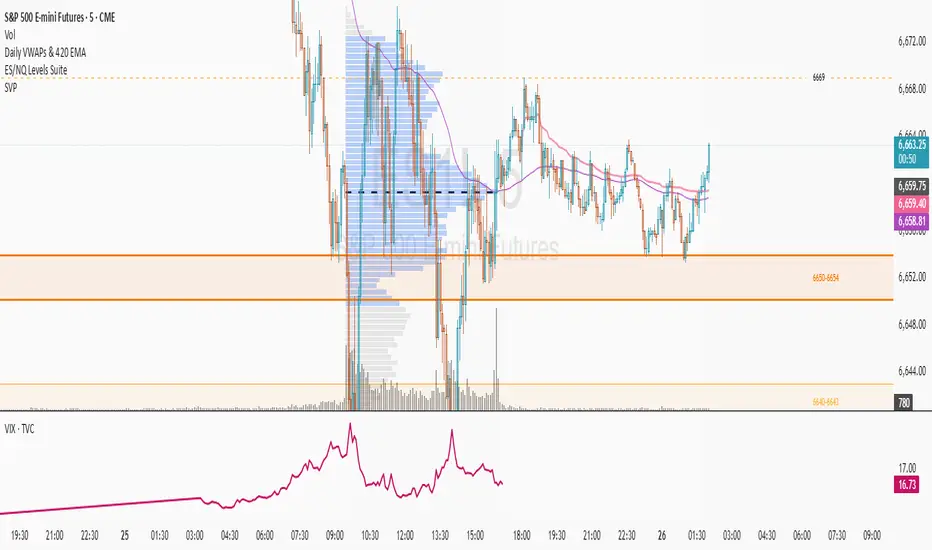
Daily VWAPs & 420 EMAAuto-plots AVWAPS at ETH & RTH of US indice futures open. Additional option for EMA of user's choice.
Daily OpenDraws line with opening price of day at 0:00 (GMT+1), changes colour when line is tested before 14:00, stop drawing when line is tested after 14:00.
Use on Timeframe 1H or lower

Daily Sessions (AMDX) AMDX Cycle for Forex Pairs.
Focusing on the London & New York Session Cycles.
- Accumulation (90 minutes)
- Manipulation (90 minutes)
- Distribution (90 minutes)
- Exit/Execution (90 minutes)
This indicator gives you a visual indicator of how the AMDX cycle works and how timing in the market is everything.

Gamma levels Free TrialDaily Gamma Levels
Sponsored by MONETA MARKETS CO.
Pinpoint key entry and exit points using levels derived directly from the options market.
The shared link provides a free trial for investors ready to upgrade their trading with premium, actionable data.

DAILY WYCKOFF ATMWyckoff Confidence Dashboard
A clean, mobile-optimized Wyckoff phase and alignment dashboard built for serious traders.
This tool dynamically detects Accumulation, Distribution, Markup, and Markdown across multiple timeframes (1H/15M) and scores confidence based on:
• HTF trend direction
• Liquidity sweeps
• Fair Value Gap (FVG) presence
• Volume/OBV confirmation
• Multi-timeframe phase/action alignment
Includes smart alerts and a lightweight dashboard interface — no clutter, just actionable structure-based insight.
Great for SMC, Wyckoff, or price-action traders seeking high-confluence entries.

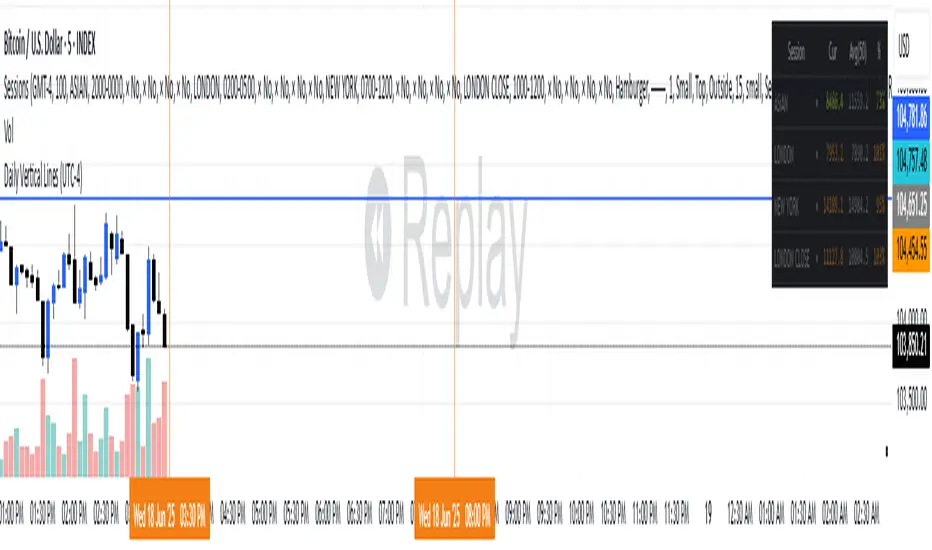
Daily Vertical Lines (UTC-4)puts verical line for setup asian
🔎 How this works:
The script uses timestamp() with America/New_York (which corresponds to UTC-4 in summer and UTC-5 in winter — TradingView auto-adjusts with DST).
When the bar’s opening time equals 3:30 PM or 8:00 PM, it draws a vertical dotted line across the chart.
One line will be red (3:30 PM), the other blue (8:00 PM).
Daily High/Low (15m) + EMA Pre-Market H/L + ORBStraightforward:
I built a swing-trading indicator with ChatGPT that plots 15-minute highs and lows, draws pre-market high/low lines, and adds a 15-minute opening-range breakout feature.
Technical:
Using ChatGPT, I developed a swing-trade indicator that calculates 15-minute highs/lows, overlays pre-market high and low levels, and includes a 15-minute Opening Range Breakout (ORB) module.
Promotional:
I created a ChatGPT-powered swing-trading indicator that maps 15-minute highs/lows, marks pre-market levels, and features a 15-minute Opening Range Breakout for clearer entries.

Daily 6 AM & 8 AM CST Linesit help so you can figure out 6am and 8am on cst time in americas very fast.


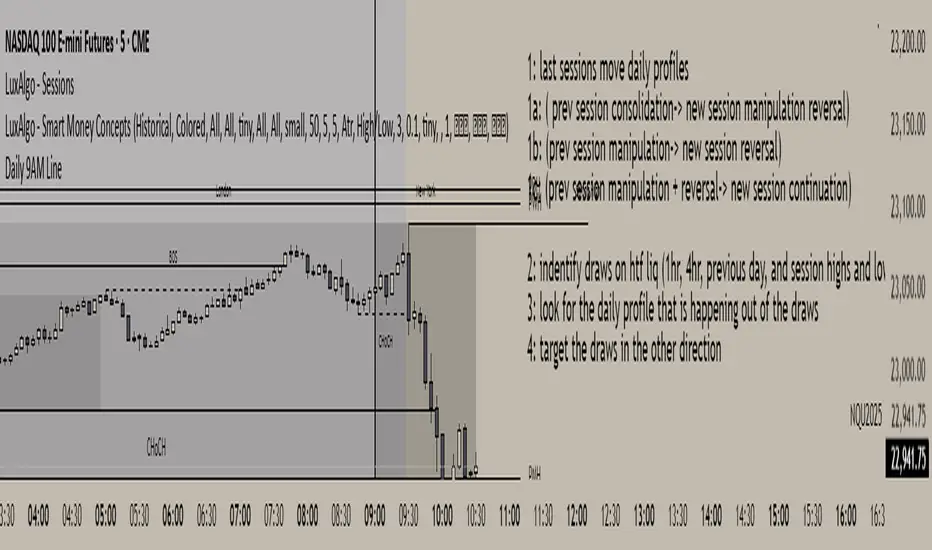
Daily 9AM Line
Draws a line at 9AM every day at market pre-open
Draws a line at 9AM every day at market pre-open
Draws a line at 9AM every day at market pre-open
Draws a line at 9AM every day at market pre-open
Daily Engulfing Zones Visually see engulfing candlestick pattern and capture explosive moves both up and down
