Tìm kiếm tập lệnh với "ema"

EMA MTF Trend Dashboard (Cross & Bias Modes)EMA MTF Trend Dashboard (Cross & Bias Modes)
A clean, multi-timeframe trend-alignment tool designed to support disciplined entries and higher-probability trades.
________________________________________
🔍 What This Dashboard Does
The EMA MTF Trend Dashboard provides a clear, structured view of trend direction across seven key timeframes:
1m • 5m • 15m • 30m • 1H • 4H • Daily
It highlights your execution timeframe, displays EMA-based trend direction per timeframe, and produces a plain-English directional bias using either Single EMA mode or Dual EMA Cross mode.
This makes it useful for scalpers, intraday traders, swing traders, and anyone who wants clarity before executing a trade.
________________________________________
🧠 How to Read the Dashboard
1. Execution Timeframe (Blue Row)
The blue row is your execution timeframe — the timeframe used to calculate the final bias.
• In Chart mode, it automatically matches your current chart timeframe.
• In Locked mode, it remains fixed, even if you switch to other chart timeframes.
This ensures consistency and removes any ambiguity before entering a trade.
________________________________________
2. EMA Mode (Use Any Length You Like)
You’re free to choose any EMA lengths — the dashboard adapts to your strategy.
• Smaller EMAs (5–20):
React quickly and highlight short-term momentum changes or early trend shifts.
• Larger EMAs (50–200+):
Move more slowly and provide a smoother read of overall trend structure, filtering out low-timeframe noise.
This flexibility lets you tune the dashboard to your preferred approach — whether you want fast tactical signals or slower, more stable directional structure.
________________________________________
3. Cross & Bias Modes
The dashboard supports two core engines:
✔ Single EMA Mode (Price vs EMA + ATR Neutral Buffer)
A trend-following model that avoids false signals when price is close to the EMA.
✔ Dual EMA Cross Mode (Fast vs Slow EMA)
A crossover-based trend engine ideal for traders who prefer structure shifts based on EMA alignment.
You can switch modes instantly from the settings.
________________________________________
4. Bias (Plain-English Trend Assessment)
The bias row at the bottom shows the overall directional bias for the blue timeframe, calculated using weighted multi-timeframe logic:
• Strong Bull
• Bullish
• Neutral
• Bearish
• Strong Bear
This provides instant clarity on whether market conditions support (or conflict with) your trade idea.
________________________________________
5. Trend Table (Heatmap View)
Each timeframe shows:
• ▲ Bullish
• ▼ Bearish
• – Neutral
Colour coded for clarity:
• Green = bullish
• Red = bearish
• Grey = neutral
• Blue = execution timeframe highlight
This creates a clean, at-a-glance trend heatmap.
________________________________________
⚙️ Customisation Options
• Fully adjustable EMA lengths
• Single EMA mode (with ATR neutral zone)
• Dual EMA Cross mode (fast/slow)
• Selectable text colour (dark/light theme friendly)
• Execution timeframe mode: Chart or Locked
• Compact and visually clear table layout
________________________________________
✔ Why This Tool Helps
This dashboard gives traders a structured, rule-aligned view of trend direction by:
• Keeping you aligned with broader multi-timeframe structure
• Reducing counter-trend mistakes
• Clarifying trend shifts and momentum changes
• Making decision-making faster and more consistent
• Supporting any systematic or rule-based trading plan
It is a decision-support tool, not a buy/sell signal — making it useful for all trading styles.
________________________________________
📌 Notes for Users
• Non-repainting (uses confirmed closes)
• Works universally: Forex, crypto, indices, commodities
• Suitable for scalpers, day-traders, swing traders
________________________________________
💬 Feedback & Future Enhancements
If you’d like to see additional timeframes, alternative trend engines, an ultra-compact mode, or alert integrations, feel free to request upgrades.

EMA Trend with 21 Pullback entriesEMA Trend with 21 Pullback Entries
This indicator visualizes a multi-timeframe EMA stack (9, 21, 50, 200 periods) to identify the prevailing trend direction and highlights potential pullback entries toward the 21-period EMA when the trend is intact.
Key features:
• Background coloring indicates full EMA alignment: darker green for bullish stack (9 > 21 > 50 > 200), darker red for bearish.
• Lighter background tints show pullback zones where price has retraced to/near the 21 EMA while the overall trend remains aligned.
• Entry signals (green triangle up for long, red triangle down for short) appear only when:
- Price crosses back over/under the 21 EMA (bounce confirmation),
- The 21 EMA is sloping in the trade direction (momentum filter),
- The full EMA stack confirms the trend.
• Exit signals (small x-cross) trigger on a close crossing back through the 21 EMA against the prior trend bar — useful as a basic trailing exit or warning.
How it works (concept):
The system combines trend filtering (stacked EMAs for hierarchy) with classic pullback trading: in an uptrend, wait for price to dip toward support (21 EMA), then enter on recovery with momentum confirmation. The reverse applies in downtrends. This reduces entries against the dominant trend and filters out many ranging-market whipsaws.
Usage tips:
- Best suited for trending markets on higher timeframes (1H, 4H, Daily recommended; lower TFs often produce more noise/false signals).
- Trade only in the direction of the strong background color.
- Use entry triangles as alert triggers or visual cues — combine with your own risk management (stops below recent lows for longs, etc.).
- Exits are conservative; you may prefer to hold until trend breaks (e.g., EMA50 cross) or use trailing methods.
Limitations & notes:
- Like all EMA-based systems, it lags in choppy/range-bound conditions and can produce false signals during low-volatility periods or sharp reversals.
- No volume, volatility, or additional filters are included — consider adding RSI, volume confirmation, or support/resistance manually.
- This is a visual aid and filtering tool only — not financial advice, no performance guarantees. Always back test thoroughly on your assets/timeframes and use proper position sizing.
Open-source under default Mozilla Public License 2.0. Feel free to study, modify, or build upon it while respecting Trading View's reuse guidelines.

EMA 8 x EMA 80 Indicator Trend Filter for the 123 PatternEMA 8 x EMA 80 Indicator Trend Filter for the 123 Pattern
This indicator displays two Exponential Moving Averages EMA with 8 and 80 periods, designed to assist in trend identification and to act as a filter for trading the 123 buy and sell pattern.
General usage rules
123 Buy: recommended only when trading in an uptrend
123 Sell: recommended only when trading in a downtrend
Moving average filter
Buy setups 123 Buy tend to be more reliable when price is above the 80 period EMA
Sell setups 123 Sell tend to be more reliable when price is below the 8 period EMA
Neutral zone attention
The area between the EMA 8 and EMA 80 is considered a neutral zone
Trading the 123 pattern within this range is riskier, as it often indicates consolidation or lack of clear trend direction
Important disclaimer
This indicator does not generate buy or sell signals by itself. It should be used as a supporting tool, together with proper risk management, market context, and additional analysis.
This is not financial advice.

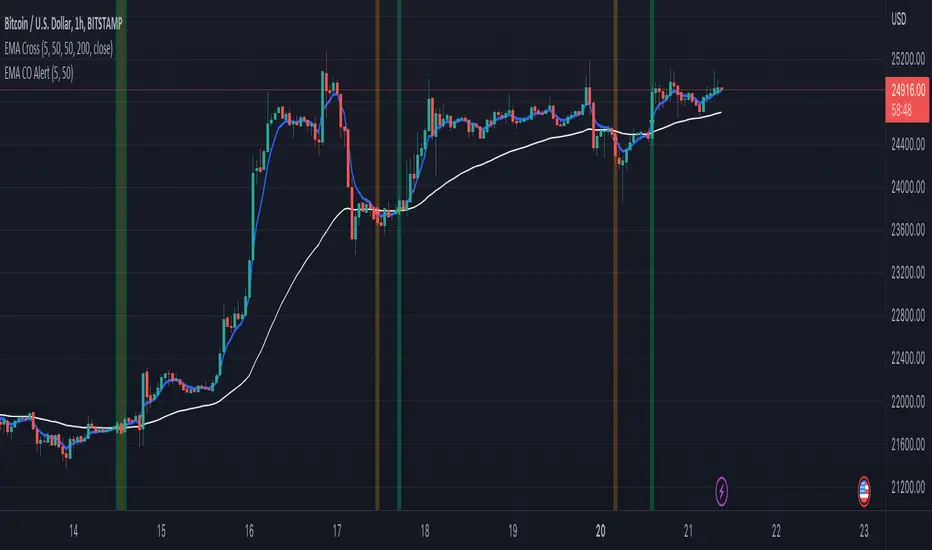
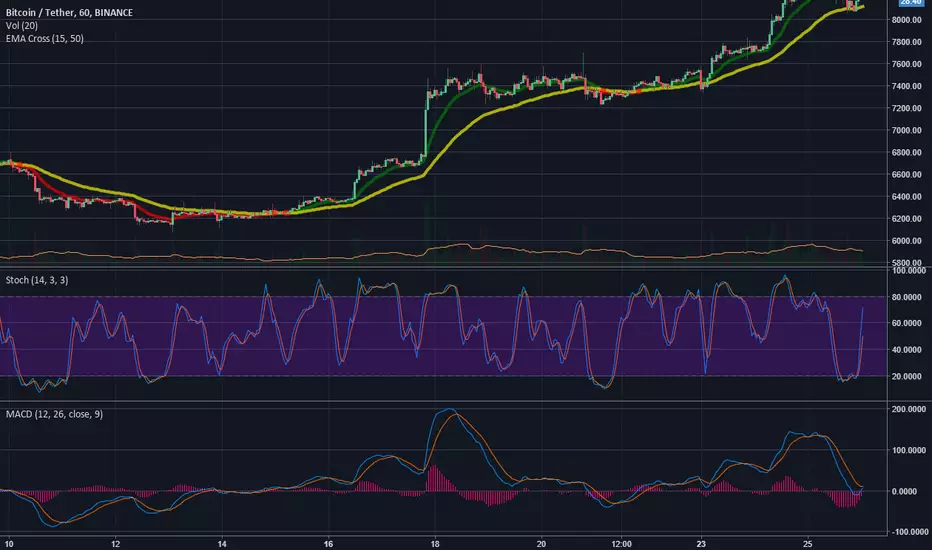
EMA CO AlertEMAs play an important role in identifying the mood of the market.
Frequently used short term EMA is 5 and long term EMA is 50.
This script detects the crossover (+ve and -ve) and generates alerts accordingly.
Steps to apply:
1) Open the script on a desired timeframe.
2) Add this indicator on the chart
3) Choose the values of the 2 EMAs from settings
4) Go to the alert window.
5) Select this indicator from the 'Condition' dropdown
6) Create the alert.
This alert will then run in the background and notify you.
Need to apply a one time alert on the scripts.
In addition to above, you can also add this indicator on the chart and it will show green/red lines on the chart for signals.
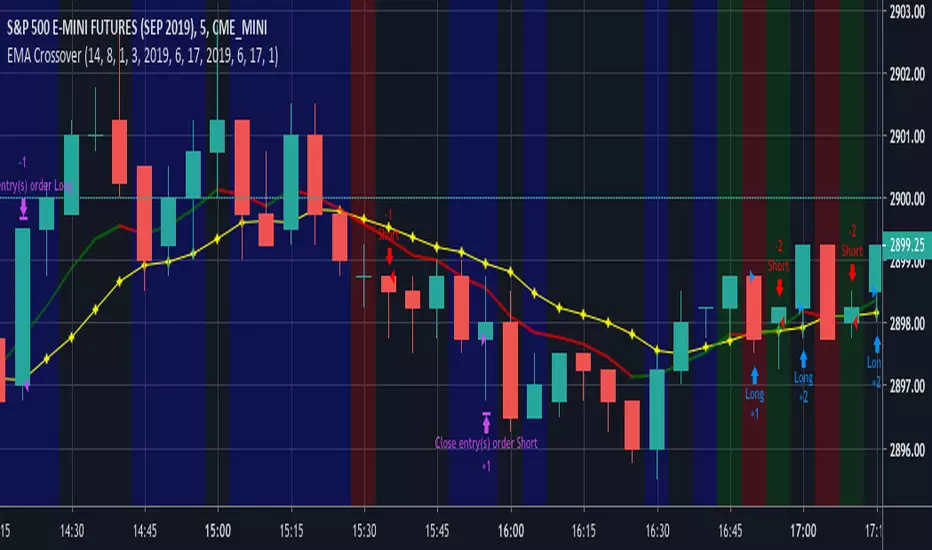
EMA CrossoverEMA Crossover
Input Parameters:
Stop loss (ticks) - define stop loss in unit of ticks (*1 tick = 12.5)
Exit signal - 1: When EMA and price crosses
2: When EMA changes direction
Start year, month, day & Stop year, month, day - define backtest period
You can set Order size, Commission in Settings, Properties tab.


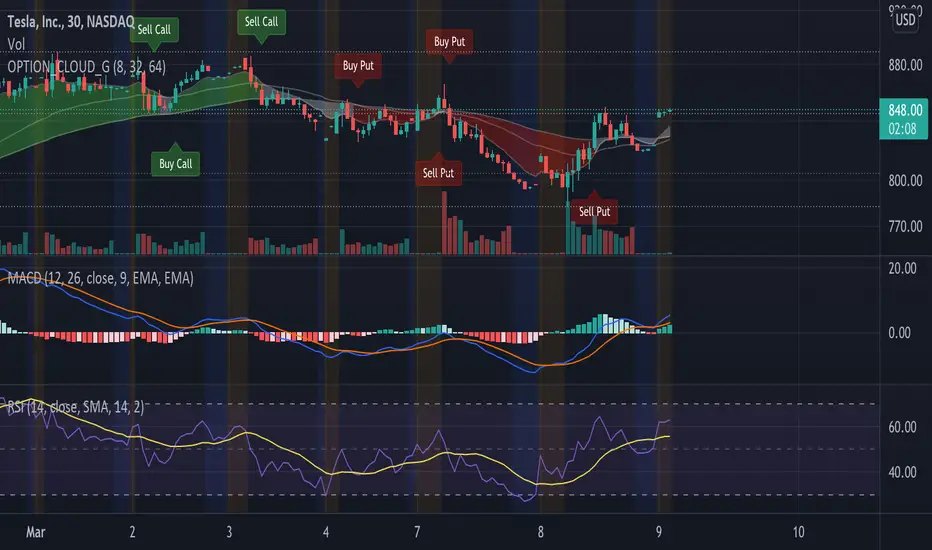
EMA Options Clouds With SignalsEMA Clouds for Options!
This indicator can help you confidently open and close options positions. Note that you should set stop a little below midline EMA . Risk reward for good signals is fairly consistent in profit. Most of the simulations I ran got between 1:2 and 1:4 profits. The losers usually can be avoided by making sure you are not in a choppy trading channel. Wait for EMAs to start separating and don't blindly follow every buy/sell.
3 wave EMA + Clouds:
Defaults:
EMA 8/32/64
Signals (off by default - turn on in settings):
Buy Call/Sell Call (open/exit call positions)
Buy Put/Sell Put (open/exit put positions)
Enter signals bullish:
Close over Middle EMA AND Short EMA > Middle EMA > Long EMA
Exit signals bullish:
Close under Middle EMA OR trend turns bearish (Short EMA < Middle EMA < Long EMA )
Enter signals bearish:
Close under Middle EMA AND Short EMA < Middle EMA < Long EMA
Exit signals bearish:
Close over Middle EMA OR Short EMA > Middle EMA > Long EMA
Cloud Colors (Default)
Green: Bullish
Red: Bearish
White: Chop/Transition
EMA Slope Angle V2 Auto Threshold# EMA Slope Angle Indicator
## Overview
The EMA Slope Angle Indicator visualizes the Exponential Moving Average (EMA) slope as an angle in degrees, providing traders with a clear, quantitative measure of trend strength and direction. The indicator features **automatic threshold calculation based on Gaussian distribution**, making it adaptive to any market and timeframe.
## Key Features
### 🎯 **Automatic Threshold Calculation (NEW!)**
- **Gaussian Distribution-Based**: Automatically calculates optimal thresholds from the 50% interquartile range (IQR) of historical angle data
- **Asset-Adaptive**: Thresholds adjust to each instrument's unique volatility and price characteristics
- **No Manual Tuning Required**: Simply enable "Use Auto Thresholds" and let the indicator optimize itself
### 📊 **Dynamic EMA Coloring**
- **Color Intensity**: EMA line color intensity reflects slope strength
- **Visual Feedback**:
- Green shades for uptrends (darker = stronger)
- Red shades for downtrends (darker = stronger)
- Gray for flat/neutral conditions
### 📈 **Regime Detection**
- **Three Regimes**: RISING, FALLING, and FLAT
- **Smart Classification**: Based on statistical distribution of angles
- **Non-Repainting**: All calculations use confirmed bars only
### 🔔 **Trend-Shift Signals**
- **Visual Arrows**: Automatic signals when transitioning from FLAT to RISING/FALLING
- **Configurable**: Enable/disable signals as needed
- **Reliable**: Only triggers on significant regime changes
### 📋 **KPI Dashboard**
- **Real-Time Metrics**: Current angle, regime, and last signal
- **Auto-Threshold Display**: Shows calculated thresholds when auto-mode is active
- **Statistics**: Optional angle distribution statistics
- **Clean Layout**: Top-right corner, non-intrusive
### 📊 **Angle Statistics (Optional)**
- **Distribution Analysis**: Histogram of angle ranges
- **Dynamic Buckets**: Automatically adjusts to data distribution when auto-mode is enabled
- **Percentage Breakdown**: See how often each angle range occurs
## Settings
### Main Settings
- **EMA Length**: Period for the Exponential Moving Average (default: 50)
- **Slope Lookback Bars**: Number of bars to calculate slope over (default: 5)
### Angle Settings
- **Use Auto Thresholds**: Enable automatic threshold calculation (recommended!)
- **Analysis Period**: Number of bars to analyze for distribution (default: 500)
- **Manual Thresholds**: Flat, Rising, and Falling triggers (used when auto-mode is off)
- **Max Angle for Color Saturation**: Maximum angle for color intensity scaling
### Display Options
- **Colors**: Customize uptrend, downtrend, and flat colors
- **Show Signals**: Enable/disable trend-shift arrows
- **Show Statistics**: Display angle distribution table
- **Show Dashboard**: Toggle KPI dashboard visibility
## How It Works
### Angle Calculation
The indicator calculates the angle between the current EMA value and the EMA value N bars ago:
```
Angle = arctan((EMA_now - EMA_then) / lookback) × 180° / π
```
### Auto-Threshold Calculation
When enabled, the indicator:
1. Analyzes historical angle data over the specified period
2. Calculates mean and standard deviation
3. Determines thresholds based on the 50% interquartile range (IQR):
- **Flat Threshold**: ±0.674σ (middle 50% of data)
- **Rising Trigger**: 75th percentile (mean + 0.674σ)
- **Falling Trigger**: 25th percentile (mean - 0.674σ)
### Regime Classification
- **FLAT**: Angle within ±Flat Threshold
- **RISING**: Angle ≥ Rising Trigger
- **FALLING**: Angle ≤ Falling Trigger
## Use Cases
### Trend Following
- Identify strong trends (high angle values)
- Spot trend reversals (regime changes)
- Filter trades based on trend strength
### Range Trading
- Detect flat/consolidation periods
- Avoid trading during choppy markets
- Enter when regime shifts from FLAT to RISING/FALLING
### Multi-Timeframe Analysis
- Apply to different timeframes for confirmation
- Use higher timeframe for trend direction
- Use lower timeframe for entry timing
## Tips for Best Results
1. **Enable Auto-Thresholds**: Let the indicator adapt to your instrument
2. **Adjust Analysis Period**: Use more bars for stable markets, fewer for volatile ones
3. **Combine with Price Action**: Use regime changes as confirmation, not standalone signals
4. **Multi-Timeframe**: Check higher timeframes for trend context
5. **Backtest First**: Test settings on historical data before live trading
## Technical Details
- **Non-Repainting**: All calculations use `barstate.isconfirmed`
- **Pine Script v6**: Latest version for optimal performance
- **Efficient**: Minimal computational overhead
- **Customizable**: Extensive settings for fine-tuning
## Version History
**v2.0** (Current)
- Added automatic threshold calculation based on Gaussian distribution
- Dynamic bucket adjustment for statistics
- Enhanced dashboard with auto-threshold display
- Improved regime detection using IQR method
**v1.0**
- Initial release with manual thresholds
- Basic EMA coloring
- Trend-shift signals
- KPI dashboard
## Support
For questions, suggestions, or bug reports, please leave a comment or contact the author.
---
**Disclaimer**: This indicator is for educational purposes only. Past performance does not guarantee future results. Always use proper risk management and never risk more than you can afford to lose.
**Keywords**: EMA, slope, angle, trend, automatic thresholds, Gaussian distribution, regime detection, non-repainting, adaptive

EMA Slope Angle# EMA Slope Angle Indicator
A professional, non-repainting overlay indicator that visualizes EMA slope strength as an angle in degrees, providing instant visual feedback through dynamic EMA coloring and comprehensive trend analysis.
## ORIGINALITY
This indicator is original in its approach to slope measurement:
- **Angle-based calculation**: Uses arctangent to calculate slope as an angle in degrees (not percentage), providing a more intuitive measure of trend strength
- **Dynamic visual feedback**: Combines real-time EMA line coloring with regime detection, creating a continuous visual representation of market conditions
- **Comprehensive analysis**: Integrates angle-based trend shift signals with optional statistical analysis in a single, cohesive tool
- **Non-repainting design**: All calculations use confirmed bars only, ensuring reliable, deterministic output
## HOW IT WORKS
The indicator calculates the EMA slope angle using trigonometric functions:
```
Angle = arctan((EMA_current - EMA_past) / lookback_bars) × 180/π
```
This provides an intuitive measure where:
- **Steep angles** = strong trends (visualized with saturated colors)
- **Shallow angles** = weak trends (visualized with lighter colors)
- **Near-zero angles** = flat/consolidation (visualized in gray)
The EMA line color dynamically reflects:
- **Direction**: Green shades for uptrends, red shades for downtrends
- **Strength**: Color intensity based on normalized angle (stronger slopes = more saturated colors)
- **Regime**: Gray for flat conditions when angle is below threshold
## KEY FEATURES
### Dynamic EMA Coloring
- EMA line color changes continuously based on slope strength
- Color intensity reflects trend strength (50-100% opacity range)
- Instant visual feedback without cluttering the chart
### Regime Detection
- Automatically classifies market conditions: **RISING**, **FALLING**, or **FLAT**
- Configurable angle thresholds for regime classification
- Real-time regime updates on confirmed bars only
### Trend-Shift Signals
- Detects transitions from FLAT to RISING/FALLING regimes
- Visual arrows on chart when significant trend shifts occur
- Prevents signal spam by only triggering from FLAT state
- Configurable trigger thresholds for signal sensitivity
### KPI Dashboard
- Real-time angle display (rounded to 1 decimal place)
- Current regime status with color coding
- Last signal tracking (UP/DOWN/NONE)
- Positioned in top-right corner for easy reference
### Advanced Angle Statistics (Optional)
- Detailed breakdown of angle distribution across 9 granular buckets:
- 0-0.2°, 0.2-0.5°, 0.5-1°, 1-1.5°, 1.5-2°, 2-3°, 3-5°, 5-10°, >10°
- Shows count and percentage for each bucket
- Automatically resets on symbol/timeframe changes
- Useful for analyzing historical slope patterns
## SETTINGS
### Main Settings
- **EMA Length**: Period for exponential moving average (default: 50)
- **Slope Lookback Bars**: Number of bars to compare for slope calculation (default: 5)
### Angle Settings
- **Flat Angle Threshold**: Maximum angle for FLAT regime classification (default: 2.0°)
- **Rising Angle Trigger**: Minimum angle to trigger RISING regime and UP signals (default: 1.0°)
- **Falling Angle Trigger**: Maximum angle to trigger FALLING regime and DOWN signals (default: -1.0°)
- **Max Angle for Color Saturation**: Maximum angle for full color intensity (default: 30.0°)
### Display Options
- **Uptrend Color**: Color for rising trends (default: dark green)
- **Downtrend Color**: Color for falling trends (default: dark red)
- **Flat Color**: Color for flat conditions (default: gray)
- **Show Trend-Shift Signals**: Toggle signal arrows on/off (default: true)
- **Show Angle Statistics**: Toggle statistics dashboard on/off (default: false)
## NON-REPAINTING GUARANTEE
- All calculations use confirmed bars only (`barstate.isconfirmed`)
- No future bar references
- No higher timeframe calls using `request.security()`
- Deterministic output - what you see is what you get
- Reliable for backtesting and live trading
## USE CASES
- **Trend Identification**: Instantly identify trend strength and direction at a glance
- **Reversal Detection**: Spot trend reversals early through regime changes
- **Trade Filtering**: Filter trades based on slope strength and regime
- **Consolidation Monitoring**: Identify flat market conditions for range trading
- **Pattern Analysis**: Study historical angle distributions to understand market behavior
- **Momentum Assessment**: Gauge trend momentum through visual color intensity
## LIMITATIONS
- Angle calculation depends on EMA length and lookback period settings
- Regime classification is based on configurable thresholds - adjust to match your trading style
- Signals only trigger when transitioning from FLAT state to prevent spam
- Statistics reset on symbol/timeframe changes (by design)
- Color intensity is normalized to max angle setting - adjust for your market's typical ranges
## TECHNICAL NOTES
- Uses Pine Script v6
- Overlay indicator (plots on price chart)
- No external dependencies
- Compatible with all TradingView chart types
- Works on all timeframes and symbols
## DISCLAIMER
This indicator is designed for visual trend analysis and educational purposes. Always combine with other technical analysis tools, fundamental analysis, and proper risk management strategies. Past performance does not guarantee future results. Trading involves risk of loss.
---
**Perfect for**: Swing traders, day traders, trend followers, and market analysts seeking intuitive trend strength visualization.

Ema Cross, 10 /21 / 55Ema Cross tool using Ema 10 / Ema 21 / Ema 55
I have found these settings very useful for catching breakouts on Alt coins.
Alerts Added,
Breakout = Ema 10 crossing above Ema 21
Breakdown = Ema 10 crossing under Ema 21
Ema 55 added as a useful area to catch dips when price is trending

EMA KitEMA Kit delivers multiple 1D EMA's wrapped into a single indicator.
I was annoyed with having a bunch of EMA indicators on the left side of my chart for each individual EMA I rely on, so I created a single indicator with all of them.
This EMA kit allows you to select any combination of the following EMA's: 3D, 5D, 8D, 21D, 34D, 50D, 100D, 200D, and 200W. They are all based on the 1D timeframe regardless of the timeframe you're currently viewing on your chart - for example, if you toggle from a Daily chart to a 15 minute chart, the EMA's won't change to reflect the 15 minute timeframe. EMA Kit smoothes the lines to prevent staggering on lower timeframes. You can change the color scheme and line thickness and even toggle between different line types like area, histogram, etc. You also have the option to turn end-of-line price labels on/off. Current price level for each EMA is highlighted on the price scale.

EMA X BF 🚀EMA Crossover Strategy
A simple EMA cross is a useful indication of a change in direction of a trend and is a very popular tool in trading. It can also be useful to judge price action momentum or severity by looking at the angle of the 2 EMAs, or the distance between them.
There are 2 Exponential Moving Averages, one fast and one slow. When the fast EMA crosses above the slow EMA, this can be considered bullish and may signal an upside move. Conversely, a cross to the downside of the fast EMA under the slow EMA can be considered bearish.
This strategy uses the same principle but uses different sources for the 2 EMAs; instead of using close values, we use ohlc4 values for the fast EMA and hlc3 values for the slow EMA.
The idea is that a trader might enter a long position upon a cross up and reverse position and go short upon the next cross down.
We use a simple 6% stop loss for both long and short positions.
This strategy is tuned to a 6hr chart for Bitcoin USD pairs.
INSTRUCTIONS
Go Long when the background is green
Go short when the background is red
White background means sideways market: a no trade zone

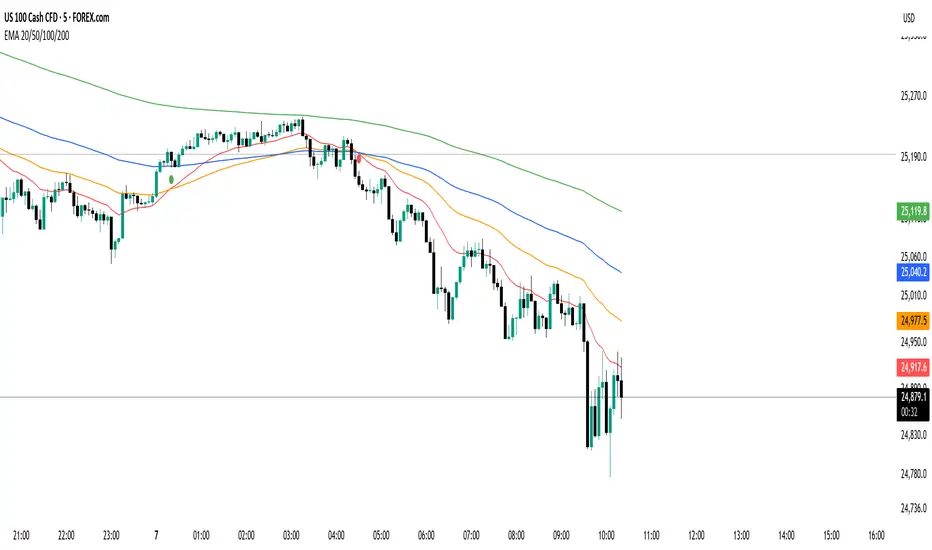
EMA 20/50/100/200 Trader IkkaEMA 20/50/100/200 📊 + Crossover Alerts 🔔 Trader Ikka
This indicator plots four key Exponential Moving Averages (EMA 20, 50, 100, and 200) to help identify trends.
It also detects and marks bullish 🟢 and bearish 🔴 crossovers between the EMA 20 and EMA 50, signaling potential trend reversals or continuations.
✨ Features:
📊 Plots EMA 20, 50, 100, and 200 with color-coded lines
🟢🔴 Highlights bullish and bearish crossovers between EMA 20 & EMA 50
🔔 Built-in alert conditions for automated notifications
⚡ Useful for identifying momentum shifts and entry/exit zones
EMA 1/8 Cross - Fixed Pip TP/SLEMA 1/8 Cross – Fixed Pip TP/SL
This strategy is based on the crossover between EMA 8 and EMA 14 as trading signals:
Long entry → when EMA 1 crosses above EMA 8
Short entry → when EMA 1 crosses below EMA 8
Features:
Fixed pip Take Profit (TP) and Stop Loss (SL), fully adjustable in the settings.
Customizable EMA Fast/Slow lengths for optimization.
Pip size input to match different broker definitions (e.g., XAUUSD often uses 0.10 as one pip).
Suitable for testing scalping or swing trading across multiple timeframes.
⚠️ Disclaimer:
This script is intended for backtesting and educational purposes only. Please optimize parameters and apply proper risk management before using it on live accounts.

EMABu indikatör; EMA 3, 5, 8, 10, 13, 20, 50, 88, 100 ve 200 periyotlu üstel hareketli ortalamaları tek bir seferde grafiğinize ekler ve her ortalama için ayrı ayrı alarm kurma imkanı sunar.
This indicator plots 10 different Exponential Moving Averages (EMA 3, 5, 8, 10, 13, 20, 50, 88, 100, and 200) simultaneously on your chart. It features individual alert conditions for each moving average, allowing you to set specific notifications for price crossovers at any period.
Main Features:
Multiple EMA Periods: Includes short, medium, and long-term averages.
Alerts: Individual alert conditions for all 10 EMA lines.
Visuals: Each line is colored differently for easy identification.
Price Labels: Values are visible on the right-hand price scale.

EMA Curl Strength+EMA Curl Strength+
Description:
This indicator provides a statistically normalized view of EMA slope momentum using Z-score transformation. By evaluating the rate of change of an EMA and comparing it against its historical behavior, the script highlights momentum shifts in a dynamic, adaptive way.
⸻
How It Works:
• Calculates the slope (percentage change) of a chosen EMA.
• Normalizes the slope using Z-score over a custom lookback period.
• Smooths the resulting signal and computes two signal lines for comparison.
• Assigns dynamic colors based on user-defined Z-score thresholds for mild, moderate, and strong momentum in both directions.
⸻
Visual Features:
• Gradient fill between the Z Curl Line and Signal 1 to highlight slope acceleration.
• Histogram showing the difference between the Z Curl Line and its signal.
• Optional signal crossover shapes between configurable pairs (e.g., Z Curl vs. Signal).
• Background highlights when the Z Curl Line exceeds ±2, indicating strong trending behavior.
⸻
Customization:
• Adjustable EMA length, smoothing lengths, signal lengths, histogram smoothing, and Z-score lookback.
• Separate color controls for:
• Z-score strength bands (mild/moderate/strong up/down)
• Histogram bars
• Signal lines
• Background highlight zones
• Crossover shapes
⸻
Use Cases:
• Momentum Confirmation: Confirm strength when Z Curl exceeds ±2 with matching background highlights.
• Trend Entry Timing: Look for trades when Z Curl crosses above or below the 0-line.
• Scalping: Capture quick directional moves when momentum accelerates.
• Trend Following: Use strong Z Curl values to confirm trade direction and filter sideways action.
• Divergence Detection: Spot divergences between price and Z Curl movement to anticipate reversals.

EMAsShow up to 5 EMAs on the chart at the same time.
This only shows the current price of the EMA.
You can use any timeframe you like, but it only works for EMAs on higher timeframe.
NOTE: The script will break if you set an EMA to 0 even if it is disabled.
