Tìm kiếm tập lệnh với "ema"


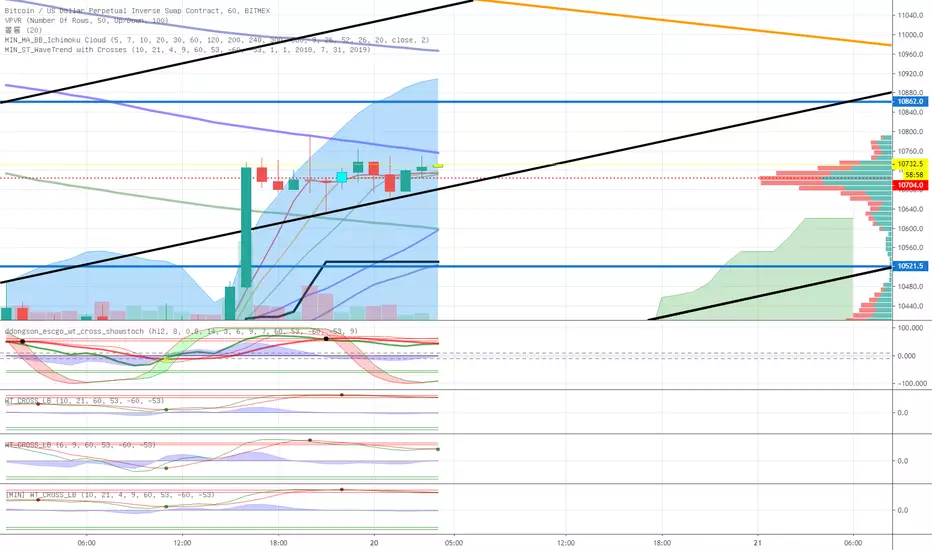
Makenai Chart Strategy Trial(日本語による説明は こちら から)
Each hourly foot can display the moving average line for the same period of time in the same color.
The average moving line that you want to see is displayed by time leg, as well as the long-term Bollinger band that should be noticed by the time leg.
1. You can get a lot of useful information at a glance by displaying the moving average line of the long-term and period setting that many traders are aware of.
○ The period setting of the moving average line displayed in each time and foot is not fixed as usual, but changed the period by time and foot, and the moving average line of the same color is the same.
It is a moving average line of time (for example, an hourly average line and a four-hour average line).Therefore, the market price is always the same even if the time to see changes
You can see it on a scale.It doesn't happen when you look at it in five minutes, but when you look at it in four hours, it looks like a downward trend.
○ The sensitivity of the rate to the moving average line displayed is very high.
You can see how rate moves, such as trends, are determined, and you can see reality in abstract chart moves
I can feel it.Purple 24 hours (one day) moving average line with 1 minute to 4 hours of foot, Green 1 week moving average line with 5 minute to day.
The sensitivity to the Blue Monthly Movement Average Line, which is displayed from 5 mins to 5 weeks, and Red One Year Movement Average Line, which is displayed from 1 hour to 5 weeks, is very high.
Just look at whether the rates are moving up or down the moving average line and you'll be able to decide what to look for.
○ What is the positional relation between the moving average line of seven (eight in addition to the weekly moving average line) in the short, short, medium, medium, long, and long periods?
To make the direction and intensity of the trend easier to recognize, it is colored between moving averages to be visible as short- and medium-term clouds.
The three clouds changed color to warm rising clouds and cold falling clouds, depending on the relation of the moving averages.
·Strong upward trend rates when all clouds are unified in either upward or downward direction and are arranged in the order of short-term, medium-term or long-term clouds
·The thickness of the clouds is strong, and when the thickness is increased, the trend rate is strong.
·Trendless market when clouds overlap or the colors of the clouds are mixed
• Range price when rates are moving back and forth between clouds
You can visually and intuitively understand the market conditions, such as .
○ Short-term, short-term, medium- and short-term positional relationships will indicate the timing of the entry payment and the direction of the long-short.It's also written.
In conjunction with this, the duration for which the background color should be long changes to light warm color and warm color, and the duration for short changes to light cold and cold color.
2. The long-term Bollinger band is displayed so that you can trade with the higher time base than the time base you see.
○ You can ride on a long-term trend by detecting and entering the trend occurrence of long-term feet with short-term feet.
Buy high prices, sell low prices, relax your trend-follow-style tears, and enable stress-free entries.
○ A light, transparent gray filter is displayed between the long-term foot Bollinger band ±1σ which sets the period suitable for the time and foot.
I understand that while the rate is moving in this zone (called gray zone), it is difficult to trend and the price range is small, so it should not be taken care of.
Yes, you can use this filter to prevent deception when the volatility is not present, and if you are out of the filter, you can use the above sign.
By trading in accordance, you can invest in trend-follow tiles while avoiding losses in range markets.
○ Bolinger bands generally display six of ±1σ, ±2σ and ±3σ, but in this indicator, two are inside ±1σ and two are outside ±3σ.
We have added a total of four bands.The former sets up early entries and the latter sets up new reverse positions, expecting a market shift from overheating.
for tips on how to
○ Expansion period (expansion period) due to characteristics of the Bollinger band is a period when volatility is big for trade, and a squeeze period
(Shrinking period) I understand that the volatility is small and it is not suitable for trade.Also, it's a squeeze period, but it's not
You can seize investment opportunities by making you expect the timing to move from contraction to expansion and by watching.
※Valid time difference by series
Multi Time : 1 minute, 5 minutes, 15 minutes, 30 minutes 1 Hour, 4 Hour, Daily, Week (Total 8 Hours)
Long Time Span : 1 hour, 4 hour, daily, 4 long-term
Short Time Span : 1 minute, 5 minutes, 15 minutes, 30 minutes
Trial (1n & 1h) : 1 min.
※See here for details of the indicator and how to use it.
★ for "Indicator Grant" and "Market Analysis Information and Indicator Signature Distribution Service" by LINE Group (for a fee)
If you wish, please send a message on private chat
Discord:
discord.gg


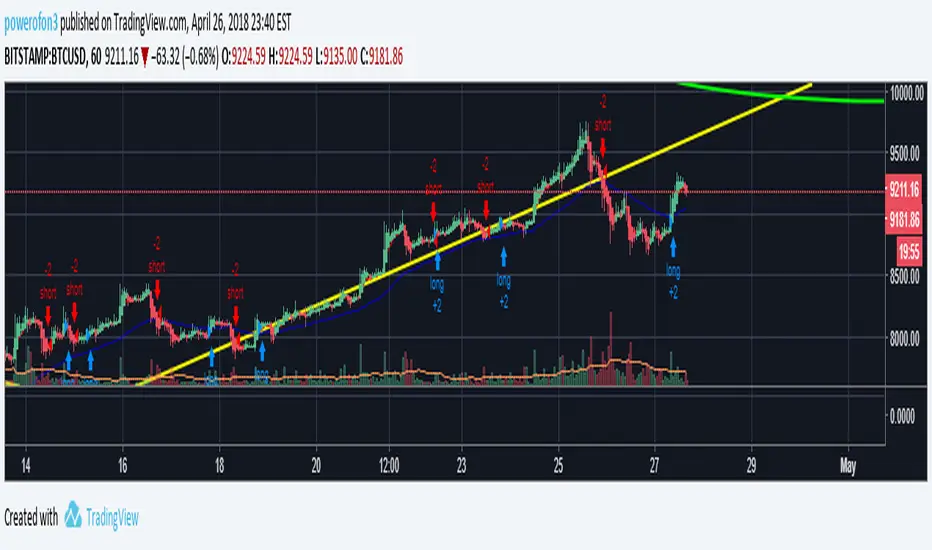
Custom Band Strategy1. Trend
if ema200 > ema30 Long entry only
else Short entry only
2. Custom Band
Upper band = sma(period) + max(close, period) * multiplier
Lower band = sma(period) - max(close, period) * multiplier
Multiplier can be either 1.3 or 1.1 depending on the trend.
(If trend is long, upper band's factor would be 1.3, lower band be 1.1)
2. Long entry condition
- Cross over the lower band and band width is greater than (close price)*2.2%(assume this band width as an expected ROE)
- Previous candle change rate((close-open)/open*100) is less than 3%.
3. Short entry condition
- Cross under the upper band and band width is greater than (close price)*2.2%
- Previous candle change rate is less than 3%.
4. Long/Short exit condition
- cross over/under the lower/upper band and roe is higher than 2%.
5. Stop/Target condition
- Target 10%, Stoploss 3%
- Previous candle change rate is higher than 3%.
Most variables can be set manually.
Test period changeable.


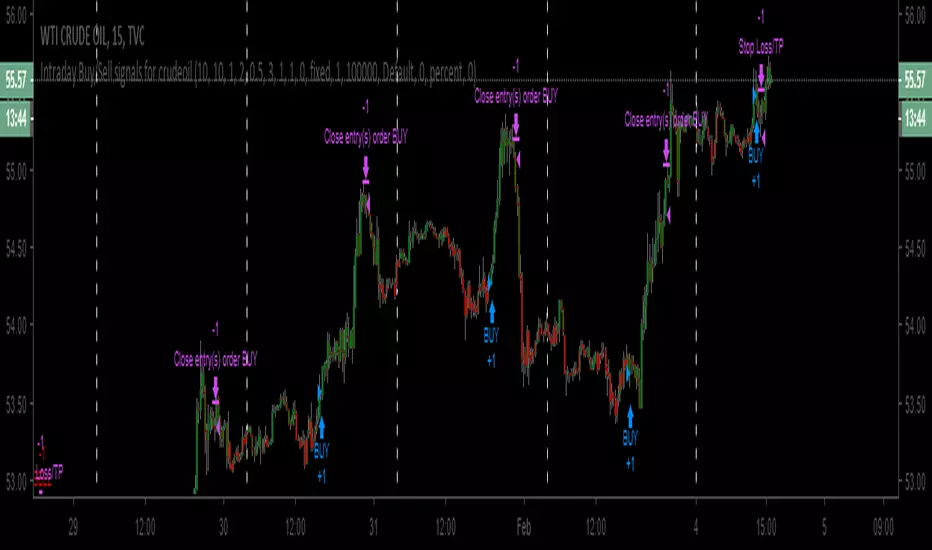
Intraday Buy/Sell signals for CrudeoilHi Everyone,
This is higly tuned intraday Buy/Signal generator for Crudeoil. It works on any time frames below 30 mins. But, the best setting is 15 mins.
How to use:
1. Just, apply this strategy to your crudeoil WTI instrument
2. Set your time frame to 15 mins
3. Buy the instrument whenever buy signal generates / Sell the intrument whenever buy singal generates
4. Strategy itself has 0.5% stop loss generating signals. But, create stop loss of 0.5% after buying/selling the instrument
5. Finally, whenever close signals triggers, just close the trade.
Note: Please try with only one lot at the beginning. If everything goes well after testing, mulitple lot can be used.
Disclaimer:
This strategy is for testing purpose only. Any profit/loss to the user's capitla is subject to market risk. And, the creator of this script is no where responsible.
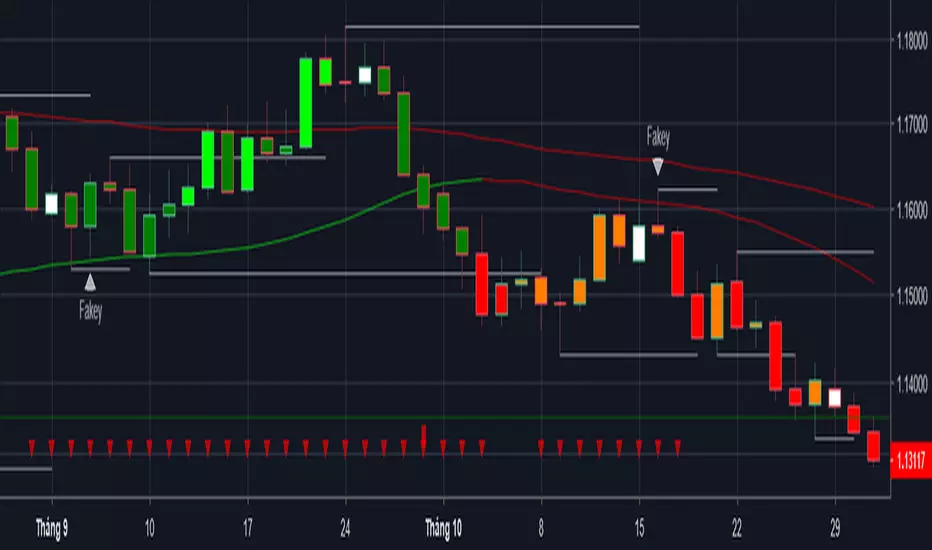
Price Action with MACD Barcolor + Insidebar + Fakey + Key level EMA 89 and Hull MA 89 used to filter trading signals and working as support and resistance.
When both of them are red, market is bearisk, only short.
When both of them are green, market is bullish, only long.
when there is 1 green and 1 red, market is neutral, can short or long.
Enjoy and happy trading!
You can follow me there: www.facebook.com you are welcom!


inwCoin's CDC ActionZone V.2 Strategy + ATR%Improved version of CDC Action Zone that filter some bad trade out ( low volatility period ) using ATR.
Optimized for 4H Timeframe only.

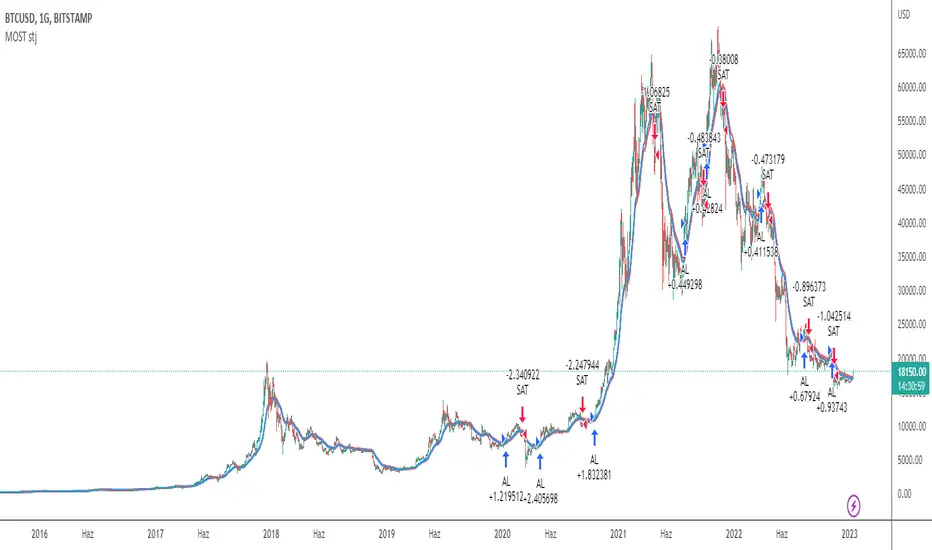
Altcoins StrategyBuy/Sell Altcoins strategy. Based on moving averages, divergences, price and volume


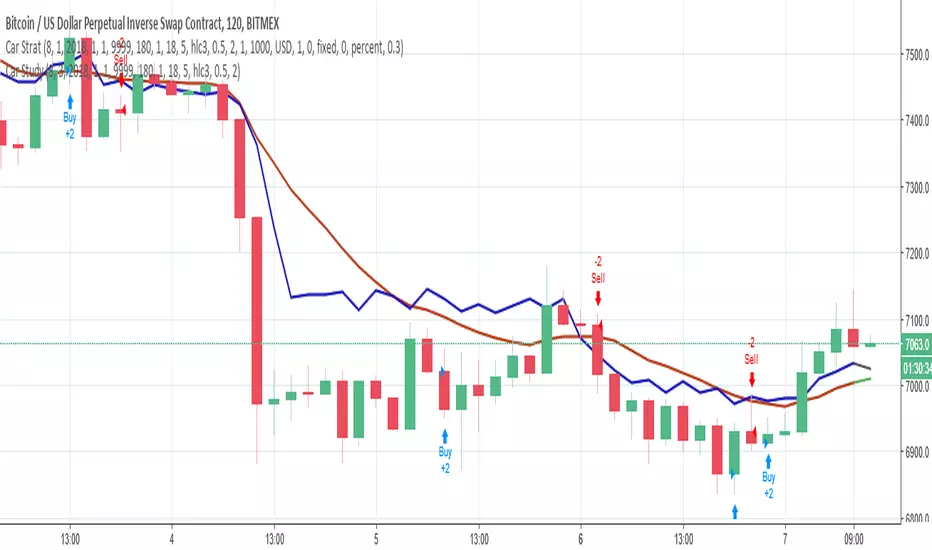
Carribean Strategy
Hi!
This is my first published strategy. This is my passport to early retirement. It is a very modified version of HCL3/Kaufman strategy. Lots of manual coding to solve repaint. Backtest/realtime differences fixed.
I'm finishing the tests but I guess it is almost done.
Using with Autovew. For now, 2 hour candles only!
Please share your results!
BB limitMarket maker strategy using Bollinger bands as entry, moving average as close and simple stop-loss with percentage of entry position. It was extremely profitable in june on xbtusd.

WhenMewn 2.0When Mewn works best on 1 hour charts.
Green Highlight= Strong Buy
Green Crosses = Support
Red Highlight is a Sell
Red Crosses = Resistance