CryptoPulse AI### CryptoPulse AI Strategy
This strategy combines Bollinger Bands, multi-timeframe EMAs (200 and 50), and candlestick wick detection for crypto trading signals. Long entries trigger on downward wicks breaking lower BB with upward EMA trend; shorts on upward wicks breaking upper BB with downward EMA trend. Includes ATR-based risk management, position sizing, and R:R targets. Overlay on any chart; supports leverage (100% margin). Visual lines/labels for TP/SL/entries; alerts for webhooks.
- **Account Balance (Default: 10000)**: Initial balance for calculating risk and position size; increase for larger accounts.
- **BB Length (Default: 20)**: Periods for Bollinger Bands basis and deviation; shorter for more signals, longer for smoothing.
- **BB Multiplier (Default: 2.0)**: Std dev factor for band width; higher widens bands, reducing false breakouts.
- **Wick to Body Ratio (Default: 1.1)**: Min wick size vs. body for valid signals (1.1 = 10% larger); higher requires stronger wicks.
- **Risk Per Trade (%) (Default: 2.0)**: Account percentage risked per trade; lower for conservative sizing.
- **Risk:Reward Ratio (Default: 6.0)**: Target profit multiple of risk; higher aims for bigger wins.
- **SL Multiplier (Default: 9.0)**: ATR factor for stop loss distance; adjust based on volatility.
- **Line Length (bars) (Default: 25)**: Bars to extend TP/SL/entry lines; longer for better visibility.
- **Label Position (Default: left)**: Text placement relative to lines (left/right); choose for chart clarity.
- **ATR Period (Default: 14)**: Periods for ATR volatility measure; affects SL and position size.
- **EMA Timeframe (Default: 5 min)**: Resolution for EMA 200/50 calculation; use lower TFs for finer trend confirmation.
- **Visuals**: BB plots (blue basis, green upper, red lower); EMA200 (red), EMA50 (green); red/green lines/labels for sell/buy entries, SL (red), TP (green).
- **Alerts**: Conditions for buy/sell signals with webhook messages for integration (e.g., Bitget).
Tìm kiếm tập lệnh với "ema"

Big Mover Catcher BTC 4h🧠 Big Mover Catcher (BTC 4H Strategy) — Educational Tool
⚠️ Disclaimer: I am not a financial advisor. This script is for educational and testing purposes only. Cryptocurrency trading is highly volatile and involves significant risk. You can lose all of your invested capital.
📌 Overview
The Big Mover Catcher strategy is a work-in-progress trading system designed for Bitcoin (BTC) on the 4-hour chart. It aims to identify strong breakout moves by combining multiple technical indicators and conditions, allowing for high customization and filter-based confirmations.
This script is part of a personal project to learn Pine Script and backtesting on TradingView. It is currently in the testing and research phase.
🎯 Strategy Objective
Catch large, high-momentum breakout moves in the BTC market using:
Bollinger Band breakouts for entry signals
Momentum, volatility, and trend filters for trade confirmation
🧰 Features & Filters
The script provides a flexible set of filters that can be turned ON/OFF and adjusted directly from the settings panel:
✅ Entry Conditions
Price must break above or below Bollinger Bands
All selected filters must align before entry
🧪 Available Filters:
Relative Strength Index (RSI) with EMA/SMA smoothing
Average Directional Index (ADX) with EMA/SMA smoothing
Average True Range (ATR) with EMA/SMA smoothing
MACD Signal above or below zero
EMA 350 trend filter
ATR / ADX / RSI Threshold toggles for added control
🔥 Additional Feature:
Force Take Profit: Optionally closes the trade immediately if a candle closes with more than a defined % movement (default: 5%). This can help lock in quick profits during high volatility moves.
⚙️ Customizable Inputs
You can configure:
Stop loss percentage
All indicator lengths
Smoothing types (EMA/SMA)
Threshold activation toggles
Individual filter ON/OFF switches
This makes the strategy highly adaptable for educational exploration and optimization.
📊 Best Used For
Learning Pine Script and strategy structure
Testing filter combinations for BTC on the 4H timeframe
Understanding how different indicators interact in live markets
⚠️ Note: ❌ Short trades are currently disabled by default, as short-side logic is still under development.
❗ Final Reminder
This script is not financial advice. It is an educational tool. Use it to learn and explore trading logic. Trading cryptocurrencies carries high risk — only invest what you can afford to lose.

Dskyz (DAFE) Adaptive Regime - Quant Machine ProDskyz (DAFE) Adaptive Regime - Quant Machine Pro:
Buckle up for the Dskyz (DAFE) Adaptive Regime - Quant Machine Pro, is a strategy that’s your ultimate edge for conquering futures markets like ES, MES, NQ, and MNQ. This isn’t just another script—it’s a quant-grade powerhouse, crafted with precision to adapt to market regimes, deliver multi-factor signals, and protect your capital with futures-tuned risk management. With its shimmering DAFE visuals, dual dashboards, and glowing watermark, it turns your charts into a cyberpunk command center, making trading as thrilling as it is profitable.
Unlike generic scripts clogging up the space, the Adaptive Regime is a DAFE original, built from the ground up to tackle the chaos of futures trading. It identifies market regimes (Trending, Range, Volatile, Quiet) using ADX, Bollinger Bands, and HTF indicators, then fires trades based on a weighted scoring system that blends candlestick patterns, RSI, MACD, and more. Add in dynamic stops, trailing exits, and a 5% drawdown circuit breaker, and you’ve got a system that’s as safe as it is aggressive. Whether you’re a newbie or a prop desk pro, this strat’s your ticket to outsmarting the markets. Let’s break down every detail and see why it’s a must-have.
Why Traders Need This Strategy
Futures markets are a gauntlet—fast moves, volatility spikes (like the April 28, 2025 NQ 1k-point drop), and institutional traps that punish the unprepared. Meanwhile, platforms are flooded with low-effort scripts that recycle old ideas with zero innovation. The Adaptive Regime stands tall, offering:
Adaptive Intelligence: Detects market regimes (Trending, Range, Volatile, Quiet) to optimize signals, unlike one-size-fits-all scripts.
Multi-Factor Precision: Combines candlestick patterns, MA trends, RSI, MACD, volume, and HTF confirmation for high-probability trades.
Futures-Optimized Risk: Calculates position sizes based on $ risk (default: $300), with ATR or fixed stops/TPs tailored for ES/MES.
Bulletproof Safety: 5% daily drawdown circuit breaker and trailing stops keep your account intact, even in chaos.
DAFE Visual Mastery: Pulsing Bollinger Band fills, dynamic SL/TP lines, and dual dashboards (metrics + position) make signals crystal-clear and charts a work of art.
Original Craftsmanship: A DAFE creation, built with community passion, not a rehashed clone of generic code.
Traders need this because it’s a complete, adaptive system that blends quant smarts, user-friendly design, and DAFE flair. It’s your edge to trade with confidence, cut through market noise, and leave the copycats in the dust.
Strategy Components
1. Market Regime Detection
The strategy’s brain is its ability to classify market conditions into five regimes, ensuring signals match the environment.
How It Works:
Trending (Regime 1): ADX > 20, fast/slow EMA spread > 0.3x ATR, HTF RSI > 50 or MACD bullish (htf_trend_bull/bear).
Range (Regime 2): ADX < 25, price range < 3% of close, no HTF trend.
Volatile (Regime 3): BB width > 1.5x avg, ATR > 1.2x avg, HTF RSI overbought/oversold.
Quiet (Regime 4): BB width < 0.8x avg, ATR < 0.9x avg.
Other (Regime 5): Default for unclear conditions.
Indicators: ADX (14), BB width (20), ATR (14, 50-bar SMA), HTF RSI (14, daily default), HTF MACD (12,26,9).
Why It’s Brilliant:
Regime detection adapts signals to market context, boosting win rates in trending or volatile conditions.
HTF RSI/MACD add a big-picture filter, rare in basic scripts.
Visualized via gradient background (green for Trending, orange for Range, red for Volatile, gray for Quiet, navy for Other).
2. Multi-Factor Signal Scoring
Entries are driven by a weighted scoring system that combines candlestick patterns, trend, momentum, and volume for robust signals.
Candlestick Patterns:
Bullish: Engulfing (0.5), hammer (0.4 in Range, 0.2 else), morning star (0.2), piercing (0.2), double bottom (0.3 in Volatile, 0.15 else). Must be near support (low ≤ 1.01x 20-bar low) with volume spike (>1.5x 20-bar avg).
Bearish: Engulfing (0.5), shooting star (0.4 in Range, 0.2 else), evening star (0.2), dark cloud (0.2), double top (0.3 in Volatile, 0.15 else). Must be near resistance (high ≥ 0.99x 20-bar high) with volume spike.
Logic: Patterns are weighted higher in specific regimes (e.g., hammer in Range, double bottom in Volatile).
Additional Factors:
Trend: Fast EMA (20) > slow EMA (50) + 0.5x ATR (trend_bull, +0.2); opposite for trend_bear.
RSI: RSI (14) < 30 (rsi_bull, +0.15); > 70 (rsi_bear, +0.15).
MACD: MACD line > signal (12,26,9, macd_bull, +0.15); opposite for macd_bear.
Volume: ATR > 1.2x 50-bar avg (vol_expansion, +0.1).
HTF Confirmation: HTF RSI < 70 and MACD bullish (htf_bull_confirm, +0.2); RSI > 30 and MACD bearish (htf_bear_confirm, +0.2).
Scoring:
bull_score = sum of bullish factors; bear_score = sum of bearish. Entry requires score ≥ 1.0.
Example: Bullish engulfing (0.5) + trend_bull (0.2) + rsi_bull (0.15) + htf_bull_confirm (0.2) = 1.05, triggers long.
Why It’s Brilliant:
Multi-factor scoring ensures signals are confirmed by multiple market dynamics, reducing false positives.
Regime-specific weights make patterns more relevant (e.g., hammers shine in Range markets).
HTF confirmation aligns with the big picture, a quant edge over simplistic scripts.
3. Futures-Tuned Risk Management
The risk system is built for futures, calculating position sizes based on $ risk and offering flexible stops/TPs.
Position Sizing:
Logic: Risk per trade (default: $300) ÷ (stop distance in points * point value) = contracts, capped at max_contracts (default: 5). Point value = tick value (e.g., $12.5 for ES) * ticks per point (4) * contract multiplier (1 for ES, 0.1 for MES).
Example: $300 risk, 8-point stop, ES ($50/point) → 0.75 contracts, rounded to 1.
Impact: Precise sizing prevents over-leverage, critical for micro contracts like MES.
Stops and Take-Profits:
Fixed: Default stop = 8 points, TP = 16 points (2:1 reward/risk).
ATR-Based: Stop = 1.5x ATR (default), TP = 3x ATR, enabled via use_atr_for_stops.
Logic: Stops set at swing low/high ± stop distance; TPs at 2x stop distance from entry.
Impact: ATR stops adapt to volatility, while fixed stops suit stable markets.
Trailing Stops:
Logic: Activates at 50% of TP distance. Trails at close ± 1.5x ATR (atr_multiplier). Longs: max(trail_stop_long, close - ATR * 1.5); shorts: min(trail_stop_short, close + ATR * 1.5).
Impact: Locks in profits during trends, a game-changer in volatile sessions.
Circuit Breaker:
Logic: Pauses trading if daily drawdown > 5% (daily_drawdown = (max_equity - equity) / max_equity).
Impact: Protects capital during black swan events (e.g., April 27, 2025 ES slippage).
Why It’s Brilliant:
Futures-specific inputs (tick value, multiplier) make it plug-and-play for ES/MES.
Trailing stops and circuit breaker add pro-level safety, rare in off-the-shelf scripts.
Flexible stops (ATR or fixed) suit different trading styles.
4. Trade Entry and Exit Logic
Entries and exits are precise, driven by bull_score/bear_score and protected by drawdown checks.
Entry Conditions:
Long: bull_score ≥ 1.0, no position (position_size <= 0), drawdown < 5% (not pause_trading). Calculates contracts, sets stop at swing low - stop points, TP at 2x stop distance.
Short: bear_score ≥ 1.0, position_size >= 0, drawdown < 5%. Stop at swing high + stop points, TP at 2x stop distance.
Logic: Tracks entry_regime for PNL arrays. Closes opposite positions before entering.
Exit Conditions:
Stop-Loss/Take-Profit: Hits stop or TP (strategy.exit).
Trailing Stop: Activates at 50% TP, trails by ATR * 1.5.
Emergency Exit: Closes if price breaches stop (close < long_stop_price or close > short_stop_price).
Reset: Clears stop/TP prices when flat (position_size = 0).
Why It’s Brilliant:
Score-based entries ensure multi-factor confirmation, filtering out weak signals.
Trailing stops maximize profits in trends, unlike static exits in basic scripts.
Emergency exits add an extra safety layer, critical for futures volatility.
5. DAFE Visuals
The visuals are pure DAFE magic, blending function with cyberpunk flair to make signals intuitive and charts stunning.
Shimmering Bollinger Band Fill:
Display: BB basis (20, white), upper/lower (green/red, 45% transparent). Fill pulses (30–50 alpha) by regime, with glow (60–95 alpha) near bands (close ≥ 0.995x upper or ≤ 1.005x lower).
Purpose: Highlights volatility and key levels with a futuristic glow.
Visuals make complex regimes and signals instantly clear, even for newbies.
Pulsing effects and regime-specific colors add a DAFE signature, setting it apart from generic scripts.
BB glow emphasizes tradeable levels, enhancing decision-making.
Chart Background (Regime Heatmap):
Green — Trending Market: Strong, sustained price movement in one direction. The market is in a trend phase—momentum follows through.
Orange — Range-Bound: Market is consolidating or moving sideways, with no clear up/down trend. Great for mean reversion setups.
Red — Volatile Regime: High volatility, heightened risk, and larger/faster price swings—trade with caution.
Gray — Quiet/Low Volatility: Market is calm and inactive, with small moves—often poor conditions for most strategies.
Navy — Other/Neutral: Regime is uncertain or mixed; signals may be less reliable.
Bollinger Bands Glow (Dynamic Fill):
Neon Red Glow — Warning!: Price is near or breaking above the upper band; momentum is overstretched, watch for overbought conditions or reversals.
Bright Green Glow — Opportunity!: Price is near or breaking below the lower band; market could be oversold, prime for bounce or reversal.
Trend Green Fill — Trending Regime: Fills between bands with green when the market is trending, showing clear momentum.
Gold/Yellow Fill — Range Regime: Fills with gold/aqua in range conditions, showing the market is sideways/oscillating.
Magenta/Red Fill — Volatility Spike: Fills with vivid magenta/red during highly volatile regimes.
Blue Fill — Neutral/Quiet: A soft blue glow for other or uncertain market states.
Moving Averages:
Display: Blue fast EMA (20), red slow EMA (50), 2px.
Purpose: Shows trend direction, with trend_dir requiring ATR-scaled spread.
Dynamic SL/TP Lines:
Display: Pulsing colors (red SL, green TP for Trending; yellow/orange for Range, etc.), 3px, with pulse_alpha for shimmer.
Purpose: Tracks stops/TPs in real-time, color-coded by regime.
6. Dual Dashboards
Two dashboards deliver real-time insights, making the strat a quant command center.
Bottom-Left Metrics Dashboard (2x13):
Metrics: Mode (Active/Paused), trend (Bullish/Bearish/Neutral), ATR, ATR avg, volume spike (YES/NO), RSI (value + Oversold/Overbought/Neutral), HTF RSI, HTF trend, last signal (Buy/Sell/None), regime, bull score.
Display: Black (29% transparent), purple title, color-coded (green for bullish, red for bearish).
Purpose: Consolidates market context and signal strength.
Top-Right Position Dashboard (2x7):
Metrics: Regime, position side (Long/Short/None), position PNL ($), SL, TP, daily PNL ($).
Display: Black (29% transparent), purple title, color-coded (lime for Long, red for Short).
Purpose: Tracks live trades and profitability.
Why It’s Brilliant:
Dual dashboards cover market context and trade status, a rare feature.
Color-coding and concise metrics guide beginners (e.g., green “Buy” = go).
Real-time PNL and SL/TP visibility empower disciplined trading.
7. Performance Tracking
Logic: Arrays (regime_pnl_long/short, regime_win/loss_long/short) track PNL and win/loss by regime (1–5). Updated on trade close (barstate.isconfirmed).
Purpose: Prepares for future adaptive thresholds (e.g., adjust bull_score min based on regime performance).
Why It’s Brilliant: Lays the groundwork for self-optimizing logic, a quant edge over static scripts.
Key Features
Regime-Adaptive: Optimizes signals for Trending, Range, Volatile, Quiet markets.
Futures-Optimized: Precise sizing for ES/MES with tick-based risk inputs.
Multi-Factor Signals: Candlestick patterns, RSI, MACD, and HTF confirmation for robust entries.
Dynamic Exits: ATR/fixed stops, 2:1 TPs, and trailing stops maximize profits.
Safe and Smart: 5% drawdown breaker and emergency exits protect capital.
DAFE Visuals: Shimmering BB fill, pulsing SL/TP, and dual dashboards.
Backtest-Ready: Fixed qty and tick calc for accurate historical testing.
How to Use
Add to Chart: Load on a 5min ES/MES chart in TradingView.
Configure Inputs: Set instrument (ES/MES), tick value ($12.5/$1.25), multiplier (1/0.1), risk ($300 default). Enable ATR stops for volatility.
Monitor Dashboards: Bottom-left for regime/signals, top-right for position/PNL.
Backtest: Run in strategy tester to compare regimes.
Live Trade: Connect to Tradovate or similar. Watch for slippage (e.g., April 27, 2025 ES issues).
Replay Test: Try April 28, 2025 NQ drop to see regime shifts and stops.
Disclaimer
Trading futures involves significant risk of loss and is not suitable for all investors. Past performance does not guarantee future results. Backtest results may differ from live trading due to slippage, fees, or market conditions. Use this strategy at your own risk, and consult a financial advisor before trading. Dskyz (DAFE) Trading Systems is not responsible for any losses incurred.
Backtesting:
Frame: 2023-09-20 - 2025-04-29
Slippage: 3
Fee Typical Range (per side, per contract)
CME Exchange $1.14 – $1.20
Clearing $0.10 – $0.30
NFA Regulatory $0.02
Firm/Broker Commis. $0.25 – $0.80 (retail prop)
TOTAL $1.60 – $2.30 per side
Round Turn: (enter+exit) = $3.20 – $4.60 per contract
Final Notes
The Dskyz (DAFE) Adaptive Regime - Quant Machine Pro is more than a strategy—it’s a revolution. Crafted with DAFE’s signature precision, it rises above generic scripts with adaptive regimes, quant-grade signals, and visuals that make trading a thrill. Whether you’re scalping MES or swinging ES, this system empowers you to navigate markets with confidence and style. Join the DAFE crew, light up your charts, and let’s dominate the futures game!
(This publishing will most likely be taken down do to some miscellaneous rule about properly displaying charting symbols, or whatever. Once I've identified what part of the publishing they want to pick on, I'll adjust and repost.)
Use it with discipline. Use it with clarity. Trade smarter.
**I will continue to release incredible strategies and indicators until I turn this into a brand or until someone offers me a contract.
Created by Dskyz, powered by DAFE Trading Systems. Trade smart, trade bold.

PEAD strategy█ OVERVIEW
This strategy trades the classic post-earnings announcement drift (PEAD).
It goes long only when the market gaps up after a positive EPS surprise.
█ LOGIC
1 — Earnings filter — EPS surprise > epsSprThresh %
2 — Gap filter — first regular 5-minute bar gaps ≥ gapThresh % above yesterday’s close
3 — Timing — only the first qualifying gap within one trading day of the earnings bar
4 — Momentum filter — last perfDays trading-day performance is positive
5 — Risk management
• Fixed stop-loss: stopPct % below entry
• Trailing exit: price < Daily EMA( emaLen )
█ INPUTS
• Gap up threshold (%) — 1 (gap size for entry)
• EPS surprise threshold (%) — 5 (min positive surprise)
• Past price performance — 20 (look-back bars for trend check)
• Fixed stop-loss (%) — 8 (hard stop distance)
• Daily EMA length — 30 (trailing exit length)
Note — Back-tests fill on the second 5-minute bar (Pine limitation).
Live trading: enable calc_on_every_tick=true for first-tick entries.
────────────────────────────────────────────
█ 概要(日本語)
本ストラテジーは決算後の PEAD を狙い、
EPS サプライズがプラス かつ 寄付きギャップアップ が発生した銘柄をスイングで買い持ちします。
█ ロジック
1 — 決算フィルター — EPS サプライズ > epsSprThresh %
2 — ギャップフィルター — レギュラー時間最初の 5 分足が前日終値+ gapThresh %以上
3 — タイミング — 決算当日または翌営業日の最初のギャップのみエントリー
4 — モメンタムフィルター — 過去 perfDays 営業日の騰落率がプラス
5 — リスク管理
• 固定ストップ:エントリー − stopPct %
• 利確:終値が日足 EMA( emaLen ) を下抜け
█ 入力パラメータ
• Gap up threshold (%) — 1 (ギャップ条件)
• EPS surprise threshold (%) — 5 (EPS サプライズ最小値)
• Past price performance — 20 (パフォーマンス判定日数)
• Fixed stop-loss (%) — 8 (固定ストップ幅)
• Daily EMA length — 30 (利確用 EMA 期間)
注意 — Pine の仕様上、バックテストでは寄付き 5 分足の次バーで約定します。
実運用で寄付き成行に合わせたい場合は calc_on_every_tick=true を有効にしてください。
────
ご意見や質問があればお気軽にコメントください。
Happy trading!

VBSMI Strategy by QTX Algo SystemsVolatility Based SMI Strategy by QTX Algo Systems
Overview
The Volatility Based SMI Strategy transforms our popular VBSMI with Dynamic Bands indicator into a fully automated strategy that traders can backtest inside TradingView. It retains all core logic from the indicator—including adaptive volatility scaling and trend-based overbought/oversold thresholds—but adds two configurable entry methods, exit conditions, and a dual-mode trade execution engine.
This script is published separately from the VBSMI indicator because some traders use VBSMI as a confluence tool within their existing system, while others prefer a rules-based strategy that can be simulated, optimized, and tracked over time. This script serves the latter use case.
How It Works
Like the original indicator, this strategy uses:
Double-Smoothed SMI Calculation: Based on smoothed momentum using EMA of the relative and full range.
Adaptive Volatility Scaling: Uses a normalized BBWP-based factor to reflect current market volatility.
Dynamic Band Adjustment: Trend direction and strength shift overbought/oversold levels upward or downward.
Band Tilt & Compression Controls: Inputs allow users to define how aggressively the bands shift with trend conditions.
What’s different is the strategy layer—you now choose from two types of entry and exit logic, and two execution styles.
🛠️ Entry & Exit Modes
There are two logic modes for both entry and exit, allowing you to adapt the strategy to your own philosophy:
Cross Mode (SMI Crosses EMA):
Entry: Buy when SMI crosses above its EMA
Exit: Close when SMI crosses below its EMA
Exit OB/OS Mode (Band Exit Logic):
Entry: Buy when price exits dynamic oversold zone (crosses back above tilted oversold band)
Exit: Close when price exits dynamic overbought zone (crosses back below tilted overbought band)
You can mix and match the modes (e.g., enter on Cross, exit on Band Exit).
⚙️ Spot vs. Leverage Mode
Spot Mode
Designed for traders who prefer long-only setups
Enters a long position and holds until the exit condition is met
Prevents overlapping trades—ensures only one position at a time
Leverage Mode
Designed for those testing bi-directional systems (e.g., long/short switching)
Automatically flips between long and short entries depending on the signals
Useful for testing symmetrical strategies or inverse conditions
Both modes work across any asset class and timeframe.
Customization Options
Users can adjust:
Smoothing K/D: Controls how fast or slow the momentum reacts
SMI EMA Length: Determines the responsiveness of the signal line
Trend Lookback Period: Influences how stable the dynamic band tilt is
Band Tilt & Compression Strengths: Refines how far bands adjust based on trend
Entry/Exit Logic Type: Choose between “Cross” or “Exit OB/OS” logic
Trading Mode: Select either "Spot" or "Leverage" depending on your use case
Why It’s Published Separately
This script is not a cosmetic or minor variation of the original indicator. It introduces:
Entry/exit logic
Order execution
Strategy testing capabilities
Mode selection (Spot vs. Leverage)
Signal logic control (Cross vs. Band Exit)
Because the original VBSMI indicator is widely used as a charting and confirmation tool, converting it into a strategy changes how it functions. This version is intended for strategy evaluation and automation, while the original remains available for discretionary and visual use.
Use Cases
This strategy is best suited for:
Evaluating VBSMI-based signals in backtests
Comparing entry and exit logic over time
Testing setups on different assets and timeframes
Automating VBSMI-based logic in a structured and risk-aware framework
Disclaimer
This strategy is for educational purposes only. It does not guarantee future results or profitability. Always test in simulation before using any strategy live, and use proper risk management and trade discipline.

[SHORT ONLY] 10 Bar Low Pullback█ STRATEGY DESCRIPTION
The "10 Bar Low Pullback" strategy is a contrarian short trading system designed to capture pullbacks after a new 10‐bar low is made. it identifies a potential short opportunity when the current bar’s low breaks below the lowest low of the previous 10 bars, provided that the bar exhibits strong internal momentum as measured by its IBS value. An optional trend filter further refines entries by requiring that the close is below a 200-period EMA.
█ WHAT IS INTERNAL BAR STRENGTH (IBS)?
Internal Bar Strength (IBS) measures where the closing price falls within the high-low range of a bar. It is calculated as:
ibs = (close - low) / (high - low)
- Low IBS (≤ 0.2): Indicates the close is near the bar's low, suggesting oversold conditions.
- High IBS (≥ 0.8): Indicates the close is near the bar's high, suggesting overbought conditions.
█ SIGNAL GENERATION
1. SHORT ENTRY
A Short Signal is triggered when:
The current bar’s low is below the lowest low of the past X bars (default: 10).
The bar’s IBS is greater than the specified threshold (default: 0.85).
The signal occurs within the defined trading window (between Start Time and End Time).
If the EMA Filter is enabled, the close must be below the 200-period EMA.
2. EXIT CONDITION
An exit Signal is generated when the current close falls below the previous bar’s low (close < low ), indicating a potential bearish reversal and prompting the strategy to close its short position.
█ ADDITIONAL SETTINGS
Lookback Period: Defines the number of bars (default is 10) over which the lowest low is calculated.
IBS Threshold: Sets the minimum required IBS value (default is 0.85) to qualify as a pullback.
Trading Window: Trades are only executed between the user-defined Start Time and End Time.
EMA Filter (Optional): When enabled, short entries are only considered if the current close is below the 200-period EMA, with the EMA period being adjustable (default is 200).
█ PERFORMANCE OVERVIEW
Designed for shorting opportunities, this strategy aims to capture pullbacks following an aggressive 10-bar low break.
It leverages a combination of a lookback low and IBS measurement to identify overextended bullish moves that may revert.
The optional EMA filter helps confirm a bearish market environment by ensuring the price remains under the trend line.
Suitable for use on various assets, including stocks and ETFs, on daily or similar timeframes.
Backtesting and parameter optimization are recommended to tailor the strategy to specific market conditions.

Volatility Momentum Breakout StrategyDescription:
Overview:
The Volatility Momentum Breakout Strategy is designed to capture significant price moves by combining a volatility breakout approach with trend and momentum filters. This strategy dynamically calculates breakout levels based on market volatility and uses these levels along with trend and momentum conditions to identify trade opportunities.
How It Works:
1. Volatility Breakout:
• Methodology:
The strategy computes the highest high and lowest low over a defined lookback period (excluding the current bar to avoid look-ahead bias). A multiple of the Average True Range (ATR) is then added to (or subtracted from) these levels to form dynamic breakout thresholds.
• Purpose:
This method helps capture significant price movements (breakouts) while ensuring that only past data is used, thereby maintaining realistic signal generation.
2. Trend Filtering:
• Methodology:
A short-term Exponential Moving Average (EMA) is applied to determine the prevailing trend.
• Purpose:
Long trades are considered only when the current price is above the EMA, indicating an uptrend, while short trades are taken only when the price is below the EMA, indicating a downtrend.
3. Momentum Confirmation:
• Methodology:
The Relative Strength Index (RSI) is used to gauge market momentum.
• Purpose:
For long entries, the RSI must be above a mid-level (e.g., above 50) to confirm upward momentum, and for short entries, it must be below a similar threshold. This helps filter out signals during overextended conditions.
Entry Conditions:
• Long Entry:
A long position is triggered when the current closing price exceeds the calculated long breakout level, the price is above the short-term EMA, and the RSI confirms momentum (e.g., above 50).
• Short Entry:
A short position is triggered when the closing price falls below the calculated short breakout level, the price is below the EMA, and the RSI confirms momentum (e.g., below 50).
Risk Management:
• Position Sizing:
Trades are sized to risk a fixed percentage of account equity (set here to 5% per trade in the code, with each trade’s stop loss defined so that risk is limited to approximately 2% of the entry price).
• Stop Loss & Take Profit:
A stop loss is placed a fixed ATR multiple away from the entry price, and a take profit target is set to achieve a 1:2 risk-reward ratio.
• Realistic Backtesting:
The strategy is backtested using an initial capital of $10,000, with a commission of 0.1% per trade and slippage of 1 tick per bar—parameters chosen to reflect conditions faced by the average trader.
Important Disclaimers:
• No Look-Ahead Bias:
All breakout levels are calculated using only past data (excluding the current bar) to ensure that the strategy does not “peek” into future data.
• Educational Purpose:
This strategy is experimental and provided solely for educational purposes. Past performance is not indicative of future results.
• User Responsibility:
Traders should thoroughly backtest and paper trade the strategy under various market conditions and adjust parameters to fit their own risk tolerance and trading style before live deployment.
Conclusion:
By integrating volatility-based breakout signals with trend and momentum filters, the Volatility Momentum Breakout Strategy offers a unique method to capture significant price moves in a disciplined manner. This publication provides a transparent explanation of the strategy’s components and realistic backtesting parameters, making it a useful tool for educational purposes and further customization by the TradingView community.

3 Down, 3 Up Strategy█ STRATEGY DESCRIPTION
The "3 Down, 3 Up Strategy" is a mean-reversion strategy designed to capitalize on short-term price reversals. It enters a long position after consecutive bearish closes and exits after consecutive bullish closes. This strategy is NOT optimized and can be used on any timeframes.
█ WHAT ARE CONSECUTIVE DOWN/UP CLOSES?
- Consecutive Down Closes: A sequence of trading bars where each close is lower than the previous close.
- Consecutive Up Closes: A sequence of trading bars where each close is higher than the previous close.
█ SIGNAL GENERATION
1. LONG ENTRY
A Buy Signal is triggered when:
The price closes lower than the previous close for Consecutive Down Closes for Entry (default: 3) consecutive bars.
The signal occurs within the specified time window (between Start Time and End Time).
If enabled, the close price must also be above the 200-period EMA (Exponential Moving Average).
2. EXIT CONDITION
A Sell Signal is generated when the price closes higher than the previous close for Consecutive Up Closes for Exit (default: 3) consecutive bars.
█ ADDITIONAL SETTINGS
Consecutive Down Closes for Entry: Number of consecutive lower closes required to trigger a buy. Default = 3.
Consecutive Up Closes for Exit: Number of consecutive higher closes required to exit. Default = 3.
EMA Filter: Optional 200-period EMA filter to confirm long entries in bullish trends. Default = disabled.
Start Time and End Time: Restrict trading to specific dates (default: 2014-2099).
█ PERFORMANCE OVERVIEW
Designed for volatile markets with frequent short-term reversals.
Performs best when price oscillates between clear support/resistance levels.
The EMA filter improves reliability in trending markets but may reduce trade frequency.
Backtest to optimize consecutive close thresholds and EMA period for specific instruments.

Big Candle Identifier with RSI Divergence and Advanced Stops1. Strategy Objective
The main goal of this strategy is to:
Identify significant price momentum (big candles).
Enter trades at opportune moments based on market signals (candlestick patterns and RSI divergence).
Limit initial risk through a fixed stop loss.
Maximize profits by using a trailing stop that activates only after the trade moves a specified distance in the profitable direction.
2. Components of the Strategy
A. Big Candle Identification
The strategy identifies big candles as indicators of strong momentum.
A big candle is defined as:
The body (absolute difference between close and open) of the current candle (body0) is larger than the bodies of the last five candles.
The candle is:
Bullish Big Candle: If close > open.
Bearish Big Candle: If open > close.
Purpose: Big candles signal potential continuation or reversal of trends, serving as the primary entry trigger.
B. RSI Divergence
Relative Strength Index (RSI): A momentum oscillator used to detect overbought/oversold conditions and divergence.
Fast RSI: A 5-period RSI, which is more sensitive to short-term price movements.
Slow RSI: A 14-period RSI, which smoothens fluctuations over a longer timeframe.
Divergence: The difference between the fast and slow RSIs.
Positive divergence (divergence > 0): Bullish momentum.
Negative divergence (divergence < 0): Bearish momentum.
Visualization: The divergence is plotted on the chart, helping traders confirm momentum shifts.
C. Stop Loss
Initial Stop Loss:
When entering a trade, an immediate stop loss of 200 points is applied.
This stop loss ensures the maximum risk is capped at a predefined level.
Implementation:
Long Trades: Stop loss is set below the entry price at low - 200 points.
Short Trades: Stop loss is set above the entry price at high + 200 points.
Purpose:
Prevents significant losses if the price moves against the trade immediately after entry.
D. Trailing Stop
The trailing stop is a dynamic risk management tool that adjusts with price movements to lock in profits. Here’s how it works:
Activation Condition:
The trailing stop only starts trailing when the trade moves 200 ticks (profit) in the right direction:
Long Position: close - entry_price >= 200 ticks.
Short Position: entry_price - close >= 200 ticks.
Trailing Logic:
Once activated, the trailing stop:
For Long Positions: Trails behind the price by 150 ticks (trail_stop = close - 150 ticks).
For Short Positions: Trails above the price by 150 ticks (trail_stop = close + 150 ticks).
Exit Condition:
The trade exits automatically if the price touches the trailing stop level.
Purpose:
Ensures profits are locked in as the trade progresses while still allowing room for price fluctuations.
E. Trade Entry Logic
Long Entry:
Triggered when a bullish big candle is identified.
Stop loss is set at low - 200 points.
Short Entry:
Triggered when a bearish big candle is identified.
Stop loss is set at high + 200 points.
F. Trade Exit Logic
Trailing Stop: Automatically exits the trade if the price touches the trailing stop level.
Fixed Stop Loss: Exits the trade if the price hits the predefined stop loss level.
G. 21 EMA
The strategy includes a 21-period Exponential Moving Average (EMA), which acts as a trend filter.
EMA helps visualize the overall market direction:
Price above EMA: Indicates an uptrend.
Price below EMA: Indicates a downtrend.
H. Visualization
Big Candle Identification:
The open and close prices of big candles are plotted for easy reference.
Trailing Stop:
Plotted on the chart to visualize its progression during the trade.
Green Line: Indicates the trailing stop for long positions.
Red Line: Indicates the trailing stop for short positions.
RSI Divergence:
Positive divergence is shown in green.
Negative divergence is shown in red.
3. Key Parameters
trail_start_ticks: The number of ticks required before the trailing stop activates (default: 200 ticks).
trail_distance_ticks: The distance between the trailing stop and price once the trailing stop starts (default: 150 ticks).
initial_stop_loss_points: The fixed stop loss in points applied at entry (default: 200 points).
tick_size: Automatically calculates the minimum tick size for the trading instrument.
4. Workflow of the Strategy
Step 1: Entry Signal
The strategy identifies a big candle (bullish or bearish).
If conditions are met, a trade is entered with a fixed stop loss.
Step 2: Initial Risk Management
The trade starts with an initial stop loss of 200 points.
Step 3: Trailing Stop Activation
If the trade moves 200 ticks in the profitable direction:
The trailing stop is activated and follows the price at a distance of 150 ticks.
Step 4: Exit the Trade
The trade is exited if:
The price hits the trailing stop.
The price hits the initial stop loss.
5. Advantages of the Strategy
Risk Management:
The fixed stop loss ensures that losses are capped.
The trailing stop locks in profits after the trade becomes profitable.
Momentum-Based Entries:
The strategy uses big candles as entry triggers, which often indicate strong price momentum.
Divergence Confirmation:
RSI divergence helps validate momentum and avoid false signals.
Dynamic Profit Protection:
The trailing stop adjusts dynamically, allowing the trade to capture larger moves while protecting gains.
6. Ideal Market Conditions
This strategy performs best in:
Trending Markets:
Big candles and momentum signals are more effective in capturing directional moves.
High Volatility:
Larger price swings improve the probability of reaching the trailing stop activation level (200 ticks).

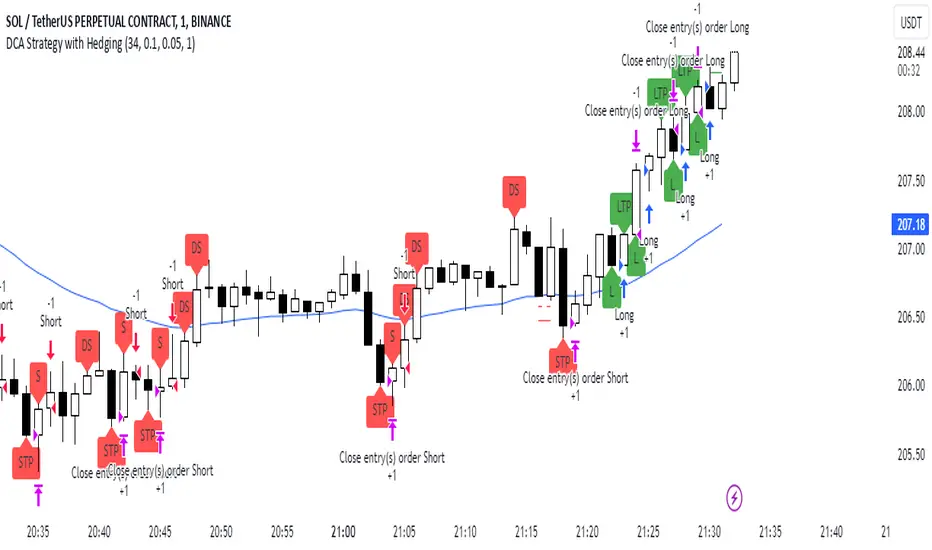
DCA Strategy with HedgingThis strategy implements a dynamic hedging system with Dollar-Cost Averaging (DCA) based on the 34 EMA. It can hold simultaneous long and short positions, making it suitable for ranging and trending markets.
Key Features:
Uses 34 EMA as baseline indicator
Implements hedging with simultaneous long/short positions
Dynamic DCA for position management
Automatic take-profit adjustments
Entry confirmation using 3-candle rule
How it Works
Long Entries:
Opens when price closes above 34 EMA for 3 candles
Adds positions every 0.1% price drop
Takes profit at 0.05% above average entry
Short Entries:
Opens when price closes below 34 EMA for 3 candles
Adds positions every 0.1% price rise
Takes profit at 0.05% below average entry
Settings
EMA Length: Controls the EMA period (default: 34)
DCA Interval: Price movement needed for additional entries (default: 0.1%)
Take Profit: Profit target from average entry (default: 0.05%)
Initial Position: Starting position size (default: 1.0)
Indicators
L: Long Entry
DL: Long DCA
S: Short Entry
DS: Short DCA
LTP: Long Take Profit
STP: Short Take Profit
Alerts
Compatible with all standard TradingView alerts:
Position Opens (Long/Short)
DCA Entries
Take Profit Hits
Note: This strategy works best on lower timeframes with high liquidity pairs. Adjust parameters based on asset volatility.
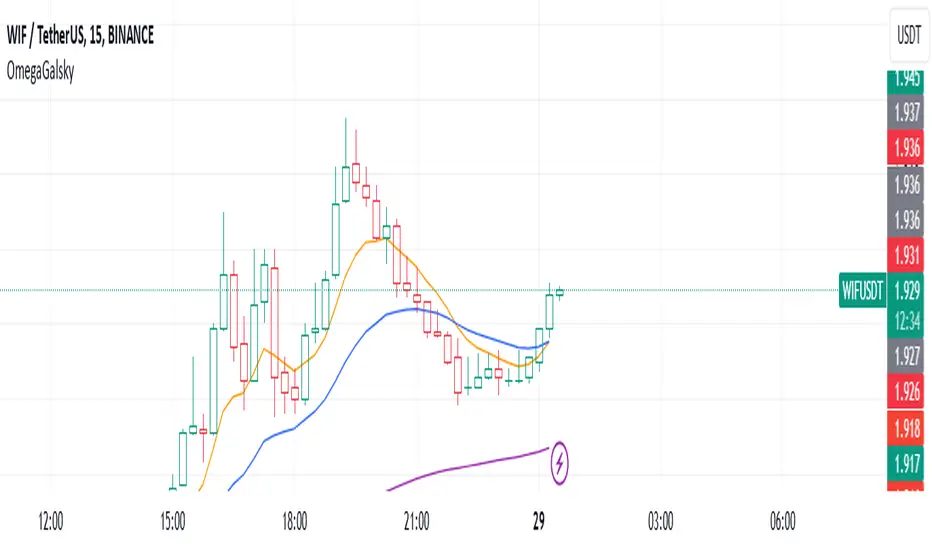
Omega_galskyThe strategy uses three Exponential Moving Averages (EMAs) — EMA8, EMA21, and EMA89 — to decide when to open buy or sell trades. It also includes a mechanism to move the Stop Loss (SL) to the Break-Even (BE) point, which is the entry price, once the price reaches a Risk-to-Reward (R2R) ratio of 1:1.
Key Steps:
Calculating EMAs: The script computes the EMA values for the specified periods. These help identify market trends and potential entry points.
Buy Conditions:
EMA8 crosses above EMA21.
The candle that causes the crossover is green (closing price is higher than the opening price).
The closing price is above EMA89.
If all conditions are met, a buy order is executed.
Sell Conditions:
EMA8 crosses below EMA21.
The candle that causes the crossover is red (closing price is lower than the opening price).
The closing price is below EMA89.
If all conditions are met, a sell order is executed.
Stop Loss and Take Profit:
Initial Stop Loss and Take Profit levels are calculated based on the entry price and a percentage defined by the user.
These levels help protect against large losses and lock in profits.
Break-Even Logic:
When the price moves favorably to reach a 1:1 R2R ratio:
For a buy trade, the Stop Loss is moved to the entry price if the price increases sufficiently.
For a sell trade, the Stop Loss is moved to the entry price if the price decreases sufficiently.
This ensures the trade is risk-free after the price reaches the predefined level.
Visual Representation:
The EMAs are plotted on the chart for easy visualization of trends and crossovers.
Entry and exit points are also marked on the chart to track trades.
Purpose:
The strategy is designed to capitalize on EMA crossovers while minimizing risks using Break-Even logic and predefined Stop Loss/Take Profit levels. It automates decision-making for trend-following traders and ensures disciplined risk management.
Kernel Regression Envelope with SMI OscillatorThis script combines the predictive capabilities of the **Nadaraya-Watson estimator**, implemented by the esteemed jdehorty (credit to him for his excellent work on the `KernelFunctions` library and the original Nadaraya-Watson Envelope indicator), with the confirmation strength of the **Stochastic Momentum Index (SMI)** to create a dynamic trend reversal strategy. The core idea is to identify potential overbought and oversold conditions using the Nadaraya-Watson Envelope and then confirm these signals with the SMI before entering a trade.
**Understanding the Nadaraya-Watson Envelope:**
The Nadaraya-Watson estimator is a non-parametric regression technique that essentially calculates a weighted average of past price data to estimate the current underlying trend. Unlike simple moving averages that give equal weight to all past data within a defined period, the Nadaraya-Watson estimator uses a **kernel function** (in this case, the Rational Quadratic Kernel) to assign weights. The key parameters influencing this estimation are:
* **Lookback Window (h):** This determines how many historical bars are considered for the estimation. A larger window results in a smoother estimation, while a smaller window makes it more reactive to recent price changes.
* **Relative Weighting (alpha):** This parameter controls the influence of different time frames in the estimation. Lower values emphasize longer-term price action, while higher values make the estimator more sensitive to shorter-term movements.
* **Start Regression at Bar (x\_0):** This allows you to exclude the potentially volatile initial bars of a chart from the calculation, leading to a more stable estimation.
The script calculates the Nadaraya-Watson estimation for the closing price (`yhat_close`), as well as the highs (`yhat_high`) and lows (`yhat_low`). The `yhat_close` is then used as the central trend line.
**Dynamic Envelope Bands with ATR:**
To identify potential entry and exit points around the Nadaraya-Watson estimation, the script uses **Average True Range (ATR)** to create dynamic envelope bands. ATR measures the volatility of the price. By multiplying the ATR by different factors (`nearFactor` and `farFactor`), we create multiple bands:
* **Near Bands:** These are closer to the Nadaraya-Watson estimation and are intended to identify potential immediate overbought or oversold zones.
* **Far Bands:** These are further away and can act as potential take-profit or stop-loss levels, representing more extreme price extensions.
The script calculates both near and far upper and lower bands, as well as an average between the near and far bands. This provides a nuanced view of potential support and resistance levels around the estimated trend.
**Confirming Reversals with the Stochastic Momentum Index (SMI):**
While the Nadaraya-Watson Envelope identifies potential overextended conditions, the **Stochastic Momentum Index (SMI)** is used to confirm a potential trend reversal. The SMI, unlike a traditional stochastic oscillator, oscillates around a zero line. It measures the location of the current closing price relative to the median of the high/low range over a specified period.
The script calculates the SMI on a **higher timeframe** (defined by the "Timeframe" input) to gain a broader perspective on the market momentum. This helps to filter out potential whipsaws and false signals that might occur on the current chart's timeframe. The SMI calculation involves:
* **%K Length:** The lookback period for calculating the highest high and lowest low.
* **%D Length:** The period for smoothing the relative range.
* **EMA Length:** The period for smoothing the SMI itself.
The script uses a double EMA for smoothing within the SMI calculation for added smoothness.
**How the Indicators Work Together in the Strategy:**
The strategy enters a long position when:
1. The closing price crosses below the **near lower band** of the Nadaraya-Watson Envelope, suggesting a potential oversold condition.
2. The SMI crosses above its EMA, indicating positive momentum.
3. The SMI value is below -50, further supporting the oversold idea on the higher timeframe.
Conversely, the strategy enters a short position when:
1. The closing price crosses above the **near upper band** of the Nadaraya-Watson Envelope, suggesting a potential overbought condition.
2. The SMI crosses below its EMA, indicating negative momentum.
3. The SMI value is above 50, further supporting the overbought idea on the higher timeframe.
Trades are closed when the price crosses the **far band** in the opposite direction of the trade. A stop-loss is also implemented based on a fixed value.
**In essence:** The Nadaraya-Watson Envelope identifies areas where the price might be deviating significantly from its estimated trend. The SMI, calculated on a higher timeframe, then acts as a confirmation signal, suggesting that the momentum is shifting in the direction of a potential reversal. The ATR-based bands provide dynamic entry and exit points based on the current volatility.
**How to Use the Script:**
1. **Apply the script to your chart.**
2. **Adjust the "Kernel Settings":**
* **Lookback Window (h):** Experiment with different values to find the smoothness that best suits the asset and timeframe you are trading. Lower values make the envelope more reactive, while higher values make it smoother.
* **Relative Weighting (alpha):** Adjust to control the influence of different timeframes on the Nadaraya-Watson estimation.
* **Start Regression at Bar (x\_0):** Increase this value if you want to exclude the initial, potentially volatile, bars from the calculation.
* **Stoploss:** Set your desired stop-loss value.
3. **Adjust the "SMI" settings:**
* **%K Length, %D Length, EMA Length:** These parameters control the sensitivity and smoothness of the SMI. Experiment to find settings that work well for your trading style.
* **Timeframe:** Select the higher timeframe you want to use for SMI confirmation.
4. **Adjust the "ATR Length" and "Near/Far ATR Factor":** These settings control the width and sensitivity of the envelope bands. Smaller ATR lengths make the bands more reactive to recent volatility.
5. **Customize the "Color Settings"** to your preference.
6. **Observe the plots:**
* The **Nadaraya-Watson Estimation (yhat)** line represents the estimated underlying trend.
* The **near and far upper and lower bands** visualize potential overbought and oversold zones based on the ATR.
* The **fill areas** highlight the regions between the near and far bands.
7. **Look for entry signals:** A long entry is considered when the price touches or crosses below the lower near band and the SMI confirms upward momentum. A short entry is considered when the price touches or crosses above the upper near band and the SMI confirms downward momentum.
8. **Manage your trades:** The script provides exit signals when the price crosses the far band. The fixed stop-loss will also close trades if the price moves against your position.
**Justification for Combining Nadaraya-Watson Envelope and SMI:**
The combination of the Nadaraya-Watson Envelope and the SMI provides a more robust approach to identifying potential trend reversals compared to using either indicator in isolation. The Nadaraya-Watson Envelope excels at identifying potential areas where the price is overextended relative to its recent history. However, relying solely on the envelope can lead to false signals, especially in choppy or volatile markets. By incorporating the SMI as a confirmation tool, we add a momentum filter that helps to validate the potential reversals signaled by the envelope. The higher timeframe SMI further helps to filter out noise and focus on more significant shifts in momentum. The ATR-based bands add a dynamic element to the entry and exit points, adapting to the current market volatility. This mashup aims to leverage the strengths of each indicator to create a more reliable trading strategy.

Bitcoin Exponential Profit Strategy### Strategy Description:
The **Bitcoin Trading Strategy** is an **Exponential Moving Average (EMA) crossover strategy** designed to identify bullish trends for Bitcoin.
1. **Indicators**:
- **Fast EMA (default 9 periods)**: Represents the short-term trend.
- **Slow EMA (default 21 periods)**: Represents the longer-term trend.
2. **Entry Condition**:
- A **bullish crossover** occurs when the Fast EMA crosses above the Slow EMA.
- The strategy enters a **long position** with a user-defined order size (default 0.01 BTC).
3. **Exit Conditions**:
- **Take Profit**: Closes the position when the profit target is reached (default $100).
- **Stop Loss**: Closes the position when the price drops below the stop loss level (default $50).
- **Bearish Crossunder**: Closes the position when the Fast EMA crosses below the Slow EMA.
4. **Visual Signals**:
- **BUY signals**: Displayed when a bullish crossover occurs.
- **SELL signals**: Displayed when a bearish crossunder occurs.
This strategy is optimized for trend-following behavior, ensuring positions are aligned with upward-moving trends while managing risk through clear stop-loss and take-profit levels.

Supertrend and MACD strategyThe Supertrend and MACD Strategy is a comprehensive trading approach designed to capitalize on market trends by using a combination of the Supertrend indicator, the Exponential Moving Average (EMA), and the Moving Average Convergence Divergence (MACD). This strategy aims to identify optimal entry and exit points for both long and short trades, while incorporating strict risk management rules.
Indicators Used:
Supertrend: This indicator is used to identify the overall trend direction. It provides clear signals for trend reversals, helping traders to enter trades in the direction of the prevailing trend.
200-period EMA: This long-term moving average is used to determine the primary trend direction. The strategy only takes long trades when the price is above the 200 EMA and short trades when the price is below it.
MACD: The MACD is used to gauge the momentum and confirm the signals provided by the Supertrend and EMA. It consists of the MACD line, the signal line, and the histogram.
Entry Conditions:
Long Entry:
The Supertrend indicator shows an uptrend (direction > 0).
The MACD line is above the signal line (macd > signal).
The price is above the 200-period EMA (close > ema200).
Short Entry:
The Supertrend indicator shows a downtrend (direction < 0).
The MACD line is below the signal line (macd < signal).
The price is below the 200-period EMA (close < ema200).
Exit Conditions:
Long Exit:
Exit the long position when the MACD line crosses below the signal line (ta.crossunder(macd, signal)).
Set a stop loss (SL) below the lowest low of the last 10 periods (lowestLow - 1).
Short Exit:
Exit the short position when the MACD line crosses above the signal line (ta.crossover(macd, signal)).
Set a stop loss (SL) above the highest high of the last 10 periods (highestHigh + 1).
Risk Management:
The strategy ensures that no new positions are opened if there is already an open trade, preventing overexposure in the market.
Alerts:
Alerts are set to notify traders when the MACD crosses the signal line, providing timely updates for potential exit points.

Demo GPT - Day Trading Scalping StrategyOverview:
This strategy is designed for day trading and scalping, utilizing a combination of technical indicators, candlestick patterns, and volume analysis to determine entry and exit points. It focuses on capturing short-term price movements while ensuring that trades are executed under specific market conditions.
Key Components:
Technical Indicators Used:
Exponential Moving Average (EMA): The strategy uses the 20-period EMA to identify the trend direction. The EMA smooths out price data, helping traders make more informed decisions about potential buy or sell signals.
Volume Weighted Average Price (VWAP): VWAP is used to measure the average price a security has traded at throughout the day, based on both volume and price. This indicator helps assess whether the current price is above or below the average trading price.
Camarilla Pivot Points: The strategy calculates four levels of Camarilla pivots (S2, S3, R2, R3) based on the highest and lowest prices over the last 14 daily candles. These levels act as potential support and resistance zones, guiding entry and exit decisions.
Candlestick Analysis:
Buy Condition: A buy signal is triggered when:
The first candle (previous candle) is green (close > open).
The second candle (current candle) is also green and opens above the first candle.
The volume of the current candle exceeds the 20-period moving average of volume, indicating strong buying interest.
Sell Condition: A sell signal is triggered when:
The first candle is red (close < open).
The second candle opens below the first red candle.
The volume of the current candle also exceeds the 20-period moving average of volume, indicating strong selling pressure.
Position Management:
The strategy enters a long position (buy) when the buy condition is met and closes the long position when the sell condition is met. This approach aims to capture upward momentum while avoiding extended exposure to downside risks.
Trading Settings:
Capital Management: The strategy uses 100% of available capital for each trade, allowing for maximum exposure to potential gains.
Commission and Slippage: The script includes settings for a commission rate of 0.1% and slippage of 3, accounting for trading costs and potential price changes during order execution.
Date Filtering: The strategy allows users to set a start date (January 1, 2018) and an end date (December 31, 2069) for trade execution, providing flexibility in backtesting and live trading.
Visualization:
The script plots the 20 EMA, VWAP, and the Camarilla pivot levels on the chart for visual reference.
Buy and sell signals are visually represented with shapes on the chart, making it easy to identify potential trade opportunities at a glance.
Volume is plotted in a separate pane to assess trading activity, and a horizontal line at zero provides a reference point.
Summary:
This Day Trading Scalping Strategy is designed to exploit short-term price movements by using a combination of EMAs, VWAP, and Camarilla pivot levels, alongside candlestick patterns and volume analysis. It is well-suited for traders looking to make quick trades based on real-time market conditions while maintaining a disciplined approach to entry and exit points. The strategy is highly visual, allowing traders to quickly assess market conditions and make informed trading decisions.
Feel free to modify or adjust any aspects of the strategy according to your specific trading goals or preferences!

Nifty scalping 3 minutes options on Dhan
Strategy Description for Publishing: Nifty Scalping 3 Minutes Options on Dhan
Overview:
The Nifty Scalping 3 Minutes Options on Dhan strategy is an enhanced version tailored for trading Nifty Options, building on the core logic used in the previously published Nifty Scalping 3 Minutes Strategy. This strategy provides automated order execution via JSON alerts for seamless integration with the Dhan platform, enabling hands-free options trading.
This system is designed to capture short-term market moves using a combination of technical indicators like the Jurik Moving Average (JMA), Exponential Moving Average (EMA), and Bollinger Bands, while also allowing traders to manage risk effectively with custom inputs for maximum loss per lot and partial profit booking.
For more details on the core logic and performance of the strategy, please refer to our earlier published strategy:
Nifty Scalping 3 Minutes Strategy
Key Features:
JMA and EMA Crossovers: Trades are executed when the Jurik Moving Average (JMA) crosses over (for long trades) or under (for short trades) the Exponential Moving Average (EMA), signaling trend direction.
Price-Volume Spike Detection: Ensures that trades are executed only when significant market activity is detected, avoiding low-momentum conditions. Price-volume relationships are monitored to confirm the strength of market movements.
Bollinger Band Noise Filter: Filters out low-volatility periods by executing trades only when prices break through the upper or lower Bollinger Bands, confirming high volatility.
Customizable Risk Management: Traders can set their own maximum risk per lot (e.g., ₹650), and the strategy adjusts the stop-loss accordingly to ensure that no trade exceeds this threshold.
Partial Profit Booking: A predefined percentage (e.g., 60%) of the position can be booked as profit once the first profit target is reached, with the remaining position trailed using an ATR-based stop.
STBT/BTST Support: The strategy offers the flexibility to carry trades overnight, supporting Sell Today, Buy Tomorrow (STBT) and Buy Today, Sell Tomorrow (BTST).
Time-Based Exit: The strategy automatically closes any open positions by 3:20 PM to avoid the volatile end-of-day market conditions.
Inputs for Traders:
Option Quantity: Select the number of contracts to trade (e.g., 10).
Maximum Risk Per Lot: Set your maximum allowable loss per lot (e.g., ₹650), ensuring that your risk is managed effectively.
Partial Profit Booking Percentage: Define what percentage of your position to book as profit (e.g., 60%) when the first target is hit.
STBT/BTST Option: Choose whether to allow positions to be carried overnight.
Alert Secret Key: Input your secret key for the Dhan platform to trigger automated orders via JSON alerts.
Option Expiry Date: Specify the expiry date for the options being traded.
Trade Logic:
Long Trades: Triggered when JMA crosses above EMA, supported by filters like price-volume spikes and Bollinger Band breakouts. The strategy waits for momentum confirmation before entering long trades, with stop-loss and profit-taking mechanisms in place.
Short Trades: Triggered when JMA crosses below EMA, with confirmation through additional filters to ensure strong market trends before entering short positions.
Risk Management:
Stop-Loss: A dynamic stop-loss is placed for each trade based on the trader's maximum risk per lot. The stop-loss adapts to market conditions using ATR trailing stops to capture further gains as the trade progresses.
Partial Profit Booking: Once the first profit target is hit (2.1x risk for long trades and 2.5x risk for short trades), a percentage of the position is booked as profit, and the remainder is trailed using an ATR stop.
Automation via JSON Alerts:This strategy sends automated JSON alerts to the Dhan platform for seamless execution of orders. The alerts support multi-leg orders for both entry and exit, ensuring that trades are executed efficiently without manual intervention.
Why Use This Strategy?
The Nifty Scalping 3 Minutes Options on Dhan strategy is perfect for traders who want to capitalize on quick market moves in options, backed by strong risk management and automation. With automated alerts, customizable inputs, and advanced technical filters, this strategy is ideal for traders looking to engage in high-probability options trades with minimal effort.
For more detailed information about the underlying logic, you can refer to the previously published Nifty Scalping 3 Minutes Strategy here.
Disclaimer:
This strategy is provided as an educational tool, and we are not affiliated with or sponsored by Dhan. The strategy integrates with the Dhan platform for automated trading, but there is no formal relationship between this strategy and Dhan.
