Hophop Ichimoku Cloud with Fibonacci RetracementThis indicator automatically draws Fibonacci retracement levels on top of the Ichimoku Cloud indicator
There are plenty of great Auto Fib generator indicators, particularly
by KIVANCfr3762 is the one I like a lot.
However if you use Ichimoku Cloud strategy with Fibonacci levels for the cloud settings this indicator will be quite handy on saving the hassle of adjusting the look back period of the auto fib with baseline of Ichimoku,
and also it will save you from using 1 indicators per chart limit which may be an issue for free plan users
BTC Tip: 39bwXN1chms1yHskBaYwz76UhDakc7grJ7
LTC Tip: MGD3U9dBCBVctwnoCa1grU8ompxG6hUhMk
ETH Tip: 0xEE9684a5aceE85036527aB48E596DeE4627bD84b
Bu indikator Ichimoku Cloud indikatoru uzerinde otomatik olarak Fibonacci retracement degerlerini cizmektedir,
Eger sadece otomatik Fibonacci retracement indikatoru ariyorsaniz, KIVANCfr3762 a ait olan indikatorunu cok basarili buluyorum ve onu kullanmanizi tavsiye ederim
Ancak siklikla Ichimoku Cloud ve Fibonacci Retracement kullaniyor iseniz her seferinde iki indikatorun ayarlarini degistirmekten kacinmak ve ayrica grafik uzerindeki indikator limitinden tasarruf etmek isterseniz bu indikatorun isinize yarayacagini dusunuyorum
Bu indikatorden faydalaniyor ve benzerleri uzerinde calismam icin destek olmak isterseniz
BTC Bahsis: 39bwXN1chms1yHskBaYwz76UhDakc7grJ7
LTC Bahsis: MGD3U9dBCBVctwnoCa1grU8ompxG6hUhMk
ETH Bahsis: 0xEE9684a5aceE85036527aB48E596DeE4627bD84b
Tìm kiếm tập lệnh với "fib"

Fibonacci Indicator ⓙAutomatic Daily Fibonacci (by JustUncle) upgraded.
This update is a correction on the way the Fib Zero line is calculated. Previously it was just based on the source of the previous day, which is Ok as long as the Fiblength was set to 2. The new version calculates the Fib Zero from the average of the specified source over the Fiblength, so if Fiblength is now something other than 2 the Fibonacci Zero and other support and resistant levels should calculate correctly.

Hullfib-trailingso I add a trialing function based on volume pf the bars
this will ,ake the system more easy for the trader
1. Hull mean avreage with color changes (green -red that show the trend )
2. signal prouduce by Hull and bollinger fibs
3.signal prouduce by trailing volume bars (B , S)
4. upper and lower daily fibs
togetther you can make good combination when you bet on bitmex
have fun

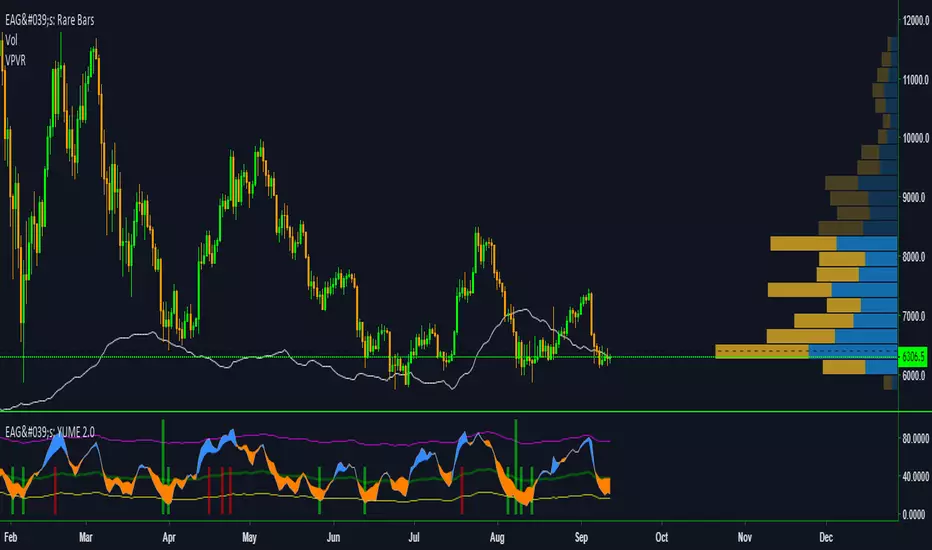
EdgeAnalysisGroup: Yume Wave 2.0This is a upgraded version of the wave with modified parameters for a higher success rate. 3 New Lengths and 75 more lines of code added to the overall algorithm. Also included are 2 sublevel signals based on the Fib MA and pattern trading.
The Wave:
+ The Yume is the Fast length
+ The Akume is the Slow length
+ The Miaku is a median weighted length
+ The Upper Limit is an overbought asset indication
+ The Lower Limit is an oversold asset indication
+ The Wave is the spread between Yume and Miaku
Bullish Indications:
+ The Yume is above the Akume
+ The Yume is above the Miaku
+ The Yume is below the Lower Limit
Bearish Indications:
+ The Yume is below the Akume
+ The Yume is below the Miaku
+ The Yume is above the Upper Limit
Signal Strength Weights:
+ 50 = Yume Wave crossed a Limit Line
+ 100 = Yume Wave crossed a Limit Line + Close to a Fib Moving Average
+ 100 = Edge's Market Bottom/Top Algorithm is marked 'True'
Setting up Signals (Based on a 100 Signal Height):
+ Set the "Bull Signal" to be at 50 or 100
+ Set the "Bear Signal" to be at 50 or 100
+ 50 is Agressive, 100 is Conservative.
+ Bull/Bear are separate so you can play conservative bull with aggressive bear.
Vegas Tunnel V1.0Step 1: Create a 1 hour chart on whatever currency pairs interest. I personally use MT4 platform on Oanda to follow my trades. Overlay 3 time periods: 169 EMA, 144 EMA and a 12 period EMA ( all 1 hour.) The 144 and 169 EMA’s create the tunnel. The 12 EMA is the filter and crossover indicator.
Step 2. Fibonacci numbers are very crucial to trading with the tunnel especially 55,89,144, 233, and 377.
Step 3. Wait for the market to come into the tunnel “area”. When it breaks above the upper tunnel boundary, you go long. When it breaks below the lower tunnel boundary you go short.
Step 4. Stops and reverses are placed on the other side of the tunnel.
Step 5. As the market trades in your direction, you take partial profits at the successive Fib numbers. The final portion of your position is left on until one of the following conditions occur: 1) market hits the last Fib number 377 pips from the EMA’s or 2) the market eventually comes back to the tunnel and violates the other side.
Vegas used the following moving averages, as filters:
5-period Simple Moving Average (SMA)
12-period Exponential Moving Average (EMA)
21-period Exponential Moving Average (EMA)

NGRN BALANCE ALLOCATION INDICATOR v1NGRN BALANCE ALLOCATION INDICATOR - Version 1
Overview
This indicator can be used to determine trade quantities as the market ebb and flows. Deeper red histogram values would indicate more funds allocated to the buy/long condition, and higher green histogram values would indicate a larger percentage of funds to sell or short. Uses volume weighted moving average as the basis for Fibonacci bands where candle crosses/touches are measured.
Features
Length indicator to control period of time to evaluate VWMA basis
Option to use open, close, high, low, hl2, hlc3, ohlc3 as source for VWMA
Option to option to specify the type of contact on fib bands
Option to specify the multiplier for the fib bands
Clean/Simple UI - Facilitating ease of use.
Access
Access to use is FREE however the source code is protected .

zibi fib3This is major update to Zibifi2 with addition of vwma fibs in order to remove issue that can happen with regular daily fibs (they sometime send bad signals)
in this version the addition will help to eliminate that effect
major buy points in green and red
minor buy and sell points are in lime and orange
have fun

zibi fib1So lets make thing smarter:)
ZIBI is volume indicator that i created which calculate prive volume per candle
it set buy point when it cross low fib =green
sell point when it cross down high fib
have fun
alerts inside

Fibonacci+MA+RSI indicator v2Buy Signal: Black traingle upward
Sell Signal: Black traingle downward
Works best on 15min chart. Performance numbers are really good for indices.( Need to change timeframe and values to work for forex or CFDs).
This script generates the fibonacci bars on the fly based on the length of previous candles(user input available).
(1,0.618,0.5,0.382,0 levels are used).
Buy or sell signals are generated only when:
the price nears specific fibonacci levels
and
if RSI is favorable
and
if moving averages are favorable
Almost all the options are user customizable. Default settings are the ones with most profitable %.
Risk points : Number of points to use as stop loss
Contracts, Lots : Order Quantity.
RR Ratio : Risk to Reward Ratio for order limit and stop levels.
RSI High and Low: Used in conjunction with Fib levels and Moving averages ( sma used)(To prevent a buy when RSI is overbought and vice versa)
use MA : To usemoving averages for signal generation. Lengths for short,medium and long term MAs are customizable
Fib length : Number of hours to consider. Internally this is multiplied by 4 to generate signals for 15min charts.
ATR % : % of ATR to consider when price is in proximity (For example fibLevel+atr% and fibLevel-atr% are considered when looking for a crossover with price). Set to minimum to ignore this.
FollowReversal : Enabling will wait for 1 confirmation candle to generate the signal.
Tested on Nifty -0.19% , Dow , S&P 0.20% etc. indices.
Please let me know if you have further questions and suggestions. I am learning to script, any help would be really appreciated.
May make the script public once I am happy with the performance.
Fibonacci Retracement (S)-Silver
The Automatic Fib Retracement - Silver -0.24% script indicates the 50-61.8% pullback region.
The lines of the upper and lower pivots, the support and resistance areas are also highlighted.
Customisable Fib Length - Time period over which max and min pivots are chosen.
Offsetfib - Automatically offsets the pivots and sell zone as your entry position
will be some time after the upper and lower pivots are set.
Works well when used in combination with an oscillator which highlights Divergence.
A strategy based off buying the 50-618 with a defined stop loss and target can be the basis of your strategy.
This tool will automatically plot those points but a defined Risk Management strategy will always be needed.
Works best in Bearish trends but will work on all timeframes (Bearish correction in an uptrend also possible).
Previous pivots shown but be careful to identify which of the several pivots you are using.
Start at a larger timeframe and move down. (Entries consistent on several timeframes are golden)
Pivots and retracements are dynamic. Be sure to note your entry and targets.

Multiple Moving AverageThis EMA script has multiple EMA's in one - 4 at the key Fibonacci levels (8,13,21,55) and 2 additional at 100 & 200 period counts. I've found this script to be extremely helpful to determine when to open or close positions - mostly using the 55 EMA as they key indicator and watching for the other 3 Fib MA's to cross over the 55 as a signal of a market shift. The 100 & 200 give additional Support & Resistance indications. The FIB MA's (hard to see on above chart) work better at lower levels for day trading where as the larger 3 lines work at all intervals.

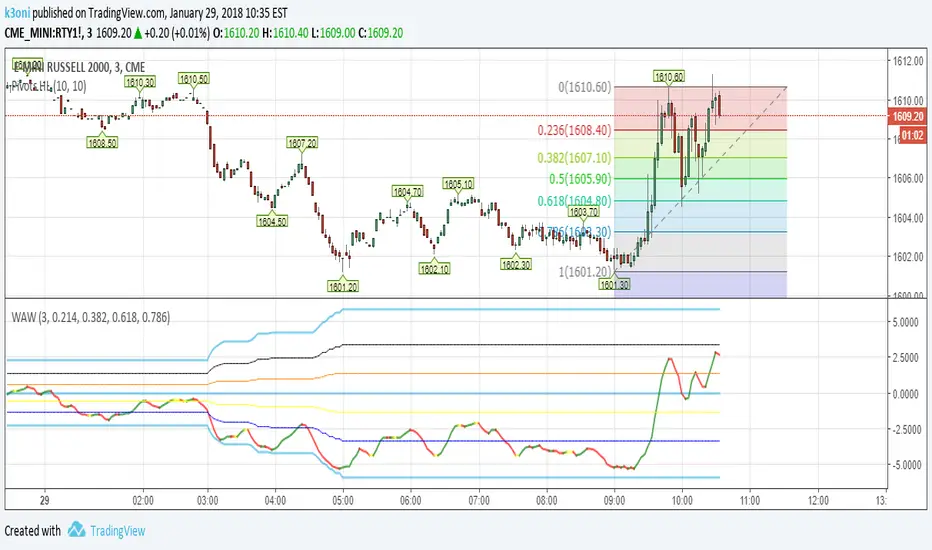
WhereAreWe - WAWShows the current price in relation to yesterday's High/Low values which create the top/middle/bottom. Add the fibs for a better S/R.
If MA Length > 1 it will use a moving average calculation instead of actual H/L to smooth the lines.
Check "Plot Fibs" to plot the fibonacci levels for S/R.
Works on intraday charts(less than 1D).
RSX FracticalityA little project I was working on to avoid studying for finals. Using LazyBear's RSX code for a smoother RSI, then taking the RSX of fib number lengths. Take the average of that, then the JMA of that from the same fib numbers. The average of that is then treated as the trend, take the average of the trend values from the main time frames, the script calls pretty far back so adding a W or M TF I think would throw the calculations off. Then I smoothed that value using the jma's to create the overall trend. I got the idea from Ehler's Empirical Mode Decomposition about identifying peaks and valleys and creating an average of that to create a range. The idea is that if the trend is above the Average Peak then it is a bull trend, less than the average valley it's a bear trend, in between it's ranging. It looks like it turned out alright, I'll be working on this idea of fractals a lot this summer to see if I can improve it or build something better off of the idea.

Fibonacci Commodity Stenth IndexFibonacci Commodity Strength Value tells us about the strength and weakness of bull or bear market.
The main focus in this is too be done at reversal. It can also be used for identifying fake ups/downs.
If all the 4 lines moves upward after a huge up spike, then notice the values of all 4 values. If red fib is smaller than green fib then it is a fake trend. If its more then its uptrend and same for bear movement. ;)
It also represents cci (in terms of values) and rsi (in terms of waves).
Enjoy !!!!!

Automatic Daily Fibonacci v0.3 by JustUncleLThis update is a correction on the way the Fib Zero line is calculated. Previously it was just based on the source of the previous day, which is Ok as long as the Fiblength was set to 2. The new version calculates the Fib Zero from the average of the specified source over the Fiblength, so if Fiblength is now something other than 2 the Fibonacci Zero and other support and resistant levels should calculate correctly.

Vegas TunnelThis indicator adds and subtracts fib levels from the moving average. I suppose profits are meant to be taken at certain levels. Additionally, it may help in finding tops and bottoms. There's more info here: www.forexstrategiesresources.com
The fib levels should be changed depending on time frame:
short) 5, 8, 13, 21
intermediate) 34, 55, 89, 144
long) 55, 89, 144, 233

Indicators: 6 RSI variationsAs we all know, as published by Wilder, RSI makes use of "CLOSE" values. You probably have experimented changing the input to hl2 or hlc3 . I have included many other RSI variations in this chart. Refer to the developers section below to learn how you can use this code in your scripts.
1) RSI with Volume
---------------------------------------------
Suggested by Morris, this idea adds volume to the RSI indicator. Because volume offers one means of determining whether money is entering or leaving a market, this would provide additional information with which to make trading decisions.
2) RSI using last Open
---------------------------------------------
This is RSI with yesterday's open, This basically compares two full days of price action and in the process produces a smoother RSI line.
RSI of today's close is used as a signal (blue line).
3) RSI using SMA
---------------------------------------------
Wilder used his own MA for calculating RSI (check my post on Wilders MA here - -- This closely resembles EMA). One of Morris's suggestion is to try out SMA.
Compared to normal RSI, you will see more squiggles here.
4) RSI using EMA
---------------------------------------------
Same idea as above, but using EMA.
5) RSI with Fibs
---------------------------------------------
How much does RSI retrace? This makes it easy to determine that :)
6) RSI of MACD
---------------------------------------------
As I mentioned earlier, RSI is a pluggable formula. You can substitute "close" with any data series to derive an index out of it.
This shows RSI of MACD. Note that this is range bound.
More info on RSI variations:
drive.google.com
For Pinescript developers:
---------------------------------------------
You can substitute your favorite indicator in the RSI function. I have made the RSI calculation a separate function in all the indicators above.
Following are the reusable functions (simply copy to your script and call with proper arguments):
* WiMA(src, length)
* calc_rsi(fv, length): This is equivalent to stock rsi() in TV.
* calc_rsi_volume(fv, length)
* calc_rsi_sma(fv, length)
* calc_rsi_ema(fv, length)
* calc_rsi_lastopen(fv, length)
* calc_macd(src, fast, slow)
You can also pick up fibs drawing code and put in on any indicator.


Game Shift PlusGame Shift Plus," is a sophisticated multi-factor technical analysis tool designed to identify market structure, institutional zones, and momentum shifts.The indicator combines classic trend-following metrics with SMC (Smart Money Concepts) like Fair Value Gaps (FVG) and Order Blocks (OB). Below is a breakdown of the core mechanics and how the logic translates to price action.1. Market Regime & Trend IdentificationThe script establishes a "Trend Filter" using three primary layers:EMAs (13 & 20): Used for short-term momentum crossover.SuperTrend: Determines the overall directional bias.RSI (Relative Strength Index): Adds a volatility/strength filter ($>55$ for Bullish, $<45$ for Bearish).The bgcolor logic visually separates the chart into three zones: Green (Bullish), Red (Bearish), and Gray (Sideways/Neutral).2. SMC & Institutional LogicThe script looks for "Inefficiencies" and "Institutional footprints" through:Fair Value Gaps (FVG): It identifies gaps where price moves so quickly that it leaves a "void" between the low of Candle 1 and the high of Candle 3. These often act as magnets for future price action.Order Blocks (OB): The current logic flags potential reversals where a previous candle's liquidity is "swept" followed by an engulfing move.Imbalance: Marked by circles, these indicate points where the price is significantly extended relative to the 5-period high/low.3. Market Phases (Accumulation vs. Expansion)The script uses ATR (Average True Range) to detect market cycles:Accumulation: When ATR is lower than its 20-period moving average (Low volatility, consolidation).Expansion: When ATR rises (High volatility, trending move).4. Fibonacci Discount ZonesIt automatically calculates levels based on the 50-bar lookback high and low. These levels (23.6%, 38.2%, and 61.8%) are plotted to show "Discount" or "Premium" areas where institutional traders typically look to enter or exit.Summary of Dashboard OutputsThe floating label (Dashboard) provides a real-time summary of these complex calculations:| Label Item | Derived From || :--- | :--- || Trend | EMA Cross + SuperTrend + RSI || Phase | ATR vs SMA(ATR) || OB Bull/Bear | Liquidity sweep logic || Imbalance | Extremes of the 5-bar range |Potential Improvements for your LogicOB Precision: The current obBull logic is a simple engulfing pattern. To make it a true Smart Money Order Block, you might consider filtering for OBs that specifically lead to a Market Structure Shift (MSS) or a Break of Structure (BOS).Fibonacci dynamic: Currently, the Fibs use a fixed 50-bar lookback. Using a "Swing High/Low" detection (via ta.pivothigh) would make the retracement levels more reactive to actual trend turns.

MyTime Hybrid TargetsThis Pine Script code, titled "Game Shift Plus," is a sophisticated multi-factor technical analysis tool designed to identify market structure, institutional zones, and momentum shifts.The indicator combines classic trend-following metrics with SMC (Smart Money Concepts) like Fair Value Gaps (FVG) and Order Blocks (OB). Below is a breakdown of the core mechanics and how the logic translates to price action.1. Market Regime & Trend IdentificationThe script establishes a "Trend Filter" using three primary layers:EMAs (13 & 20): Used for short-term momentum crossover.SuperTrend: Determines the overall directional bias.RSI (Relative Strength Index): Adds a volatility/strength filter ($>55$ for Bullish, $<45$ for Bearish).The bgcolor logic visually separates the chart into three zones: Green (Bullish), Red (Bearish), and Gray (Sideways/Neutral).2. SMC & Institutional LogicThe script looks for "Inefficiencies" and "Institutional footprints" through:Fair Value Gaps (FVG): It identifies gaps where price moves so quickly that it leaves a "void" between the low of Candle 1 and the high of Candle 3. These often act as magnets for future price action.Order Blocks (OB): The current logic flags potential reversals where a previous candle's liquidity is "swept" followed by an engulfing move.Imbalance: Marked by circles, these indicate points where the price is significantly extended relative to the 5-period high/low.3. Market Phases (Accumulation vs. Expansion)The script uses ATR (Average True Range) to detect market cycles:Accumulation: When ATR is lower than its 20-period moving average (Low volatility, consolidation).Expansion: When ATR rises (High volatility, trending move).4. Fibonacci Discount ZonesIt automatically calculates levels based on the 50-bar lookback high and low. These levels (23.6%, 38.2%, and 61.8%) are plotted to show "Discount" or "Premium" areas where institutional traders typically look to enter or exit.Summary of Dashboard OutputsThe floating label (Dashboard) provides a real-time summary of these complex calculations:| Label Item | Derived From || :--- | :--- || Trend | EMA Cross + SuperTrend + RSI || Phase | ATR vs SMA(ATR) || OB Bull/Bear | Liquidity sweep logic || Imbalance | Extremes of the 5-bar range |Potential Improvements for your LogicOB Precision: The current obBull logic is a simple engulfing pattern. To make it a true Smart Money Order Block, you might consider filtering for OBs that specifically lead to a Market Structure Shift (MSS) or a Break of Structure (BOS).Fibonacci dynamic: Currently, the Fibs use a fixed 50-bar lookback. Using a "Swing High/Low" detection (via ta.pivothigh) would make the retracement levels more reactive to actual trend turns.

MyTime Hybrid TargetsThis script, "MyTime Hybrid Targets," is a professional-grade trading system that combines trend-following momentum with advanced liquidity concepts and volatility-adjusted targets. It is designed to provide traders with a high-probability "Institutional-style" framework for scalping or swing trading.
Here is a point-by-point breakdown of the script’s features:
1. 4-Layer Trend Confirmation Engine
The script uses a strict multi-layer filter to ensure you only trade in the direction of the "Strong Trend."
EMA Hybrid: Uses a 13-period and 20-period EMA crossover logic to detect short-term trend direction.
SuperTrend Integration: Filters entries through the SuperTrend algorithm to ensure the price has broken structural resistance/support.
RSI Momentum Filter: Only triggers Buy signals when RSI > 50 and Sell signals when RSI < 50, ensuring positive or negative momentum is present.
2. Smart Liquidity Sweep Logic
Unlike standard indicators that fire on every crossover, this script includes a Liquidity Sweep check:
Institutional "Stop-Hunts": It identifies when the price has swept the 10-bar low (for buys) or the 10-bar high (for sells).
Smart Money Entry: This identifies the "sweep before the move," allowing you to enter where big players are entering, rather than getting caught in the trap.
3. Volatility-Filtered Candle Entries
ATR Strength Gate: Only "Strong Candles" (Marubozu or high-momentum candles) trigger a signal. The candle body must be at least 50% of the recent ATR, filtering out weak, "indecisive" price action and dojis.
4. Triple-Stage Hybrid Profit Targets
The indicator automatically projects three distinct types of profit targets the moment a signal is fired:
T1 - Structural Fibonacci (0.618): Targets the next major structural level based on the recent 20-bar swing high/low. This is your high-probability "Scalp" target.
T2 - Dynamic Zone (1.5x ATR): A volatility-adjusted target that accounts for the current market environment.
T3 - Trend Extension (2.5x ATR): Designed for "Runners" to capture larger trend extensions during high-volatility moves.
5. Clean & Actionable UI
B/S Labels: Large, clear "B" (Buy) and "S" (Sell) labels appear below and above the bars to ensure you never miss an entry.
Multi-Target Dashboard: Floating labels on the chart tell you exactly which target is which (Fib vs. Zone vs. ATR), keeping your chart organized and professional.
Best Use Cases:
Scalping: 1m to 5m timeframes for quick T1/T2 hits.
Intraday/Swing: 15m to 1h timeframes for trend-following moves toward T3.

Scalping ~ Maniesh🔥 Fibonacci Scalping Indicator
This indicator is built for precision scalping using ACR (Average Candle Range) combined with Fibonacci-based premium & discount zones.
It helps traders identify high-probability reaction areas instead of chasing random moves.
🧠 Indicator Logic
Calculates ACR to understand current market volatility
Uses Fibonacci levels on the ACR range
Clearly marks Premium & Discount zones
Helps filter overextended price moves
Designed for reaction-based scalping, not blind entries
⏱ Best Timeframes
1m / 3m
Works best during London & New York sessions
📌 How to Use
Look for price reaching Fib
Wait for price reaction or confirmation
Enter scalps with tight stop-loss
Ideal for quick entries & partial exits
This indicator does not give buy/sell signals.
It is a framework tool to improve execution and timing.
⚠️ Disclaimer
Trading involves risk.
Always use proper risk management and backtest before live trading.

Universal Po3 Profiler [Pro +] | cephxsUNIVERSAL Po3 PROFILER 🧪
All concepts used in the development of this indicator are open source and available to all on youtube.
Credits go out to Michael J. H. (ICT) as the one putting it out there for all.
A refined approach to multi-timeframe structural analysis. Clean visuals. Precise signals. Nothing more than what matters.
OVERVIEW
Built for traders who value clarity over complexity, this profiler distills institutional price delivery concepts into a visually cohesive overlay. It maps higher timeframe structure directly onto your chart while detecting key divergence patterns across correlated assets.
The design philosophy is intentional minimalism—every element earns its place on your chart. No redundant indicators. No visual noise. Just the structural context you need to frame your trading decisions.
📷 Full indicator overview showing HTF candles, CISD lines, and SMT divergences on a 5m YM chart
CORE FEATURES
🧪 Multi-Timeframe Profiling
Automatically profiles up to three higher timeframes based on your chart's resolution. The system intelligently selects appropriate HTF pairings—or lets you override with manual control. 0 stress, minimal input overload.
Auto Mode: Adapts HTF selection to your chart timeframe
Profiler Source: Choose which HTF defines your structural boundaries
Directional Bias: Filter profiling to bullish or bearish setups only
📷 Side-by-side comparison; Auto mode on 5m chart vs 15m chart showing different HTF selections
🔀 SMT DIVERGENCE DETECTION
Identifies Smart Money divergences between correlated assets in real-time. When the primary asset makes a structural move that correlated pairs fail to confirm by moving in-sync, the system flags potential reversals.
Tracks divergences across multiple HTF sessions
Supports both normal and inverse correlations
Independent chart and HTF candle visualization
Automatic invalidation when divergence resolves
Configurable asset pairs with correlation library integration that is updated regularly
📷 SMT divergence example, ES vs YM showing bearish divergence at session highs
📐 CISD DETECTION & FIBONACCI PROJECTIONS
Change in State of Delivery (CISD) marks the moment price starts to deliver in the opposing direction of where it previously went. The system identifies these pivotal transitions and projects optional Fibonacci extensions to map potential price targets.
Automatic stretch calculation from opposing candle sequences
Confirmation-based detection (not predictive)
Fibonacci projections with customizable levels (-1 to -4.5)
Size filtering to eliminate noise on smaller moves
Visual invalidation when structure breaks
📷 Confirmed CISD with Fibonacci projection levels (other features disabled to highlight)
📷 Multiple CISDs showing bullish and bearish examples simultaneously
🎯 MANIPULATION AREA PROFILING
Detects sweep-and-reversal sequences within HTF candle boundaries. The profiling system identifies when price sweeps the immediate previous candle's extreme then confirms directional commitment after a candle close.
How the manipulation area is calculated (it is not a magic level, it's a simple division : ) )
For C3 : is measured from the Open of C3 to the quadrant C.E of C2
For C4 : is measured from the Open of C4 to the Upper Quadrant (25/75) of C3.
All Based on openly-sourced ICT Concepts
Po3 area visualization on profiler HTF
Sweep line tracking at structural levels
C1/C2/C3 phase progression
Bias filtering for directional focus
📷 Manipulation area highlighting Po3 zone with sweep lines
HTF CANDLE VISUALIZATION
Projects higher timeframe candles to the right of your chart, providing structural context without cluttering price action. Full credit for the base logic used in building this goes to @fadizeidan.
Up to 3 HTF layers with independent candle counts
PSP (Precision Swing Point) divergence detection on candles
Clean, adjustable styling
Session labels with countdown timers
INPUTS
Directional Bias
Po3 Profiling Bias: Auto / Bullish / Bearish — filters manipulation area detection
CISD/SSMT Bias: Auto / Bullish / Bearish — filters divergence detection
HTF Configuration
Auto Mode: Enabled by default. Automatically configures HTF timeframes
HTF 1/2/3: Manual timeframe selection when Auto Mode disabled
Profiler Source: Which HTF defines profiling boundaries
SMT Settings
Enable SMT: Master toggle for divergence detection
Show on Chart: Render divergence lines on price chart
Show on HTF Candles: Render divergence lines on HTF candle visuals
Asset Selection: Configure correlated pairs and inversion settings
CISD Settings
Show CISD: Enable change in state detection
Fibonacci Projections: Enable extension level plotting
Level Configuration: Toggle individual fib levels (-1 through -4.5)
Profiler Status Bar
Position: 9 positions including center options
Styling: Size, bold toggle, custom colors
---
RECOMMENDED USAGE
Start with Auto Mode enabled to learn the HTF relationships
Set your directional bias if you have a higher timeframe thesis
Watch for SMT divergences at session extremes
Use CISD confirmations to identify structural shifts
Reference Fibonacci projections for potential targets
Optimal Timeframes:
Scalping: 1m-3m charts (profiles to 15m-90m)
Intraday: 5m-15m charts (profiles to 1H-4H / Optionally 6H)
Swing: 1H-4H charts (profiles to Daily-Weekly)
---
CORRELATED ASSETS
The SMT system works with major correlations including:
Index Futures: CME_MINI:ES1! , CME_MINI:NQ1! , CBOT_MINI:YM1!
Forex Majors: FOREXCOM:EURUSD , FOREXCOM:GBPUSD , TVC:DXY
Crypto: BINANCE:BTCUSDT , BINANCE:ETHUSDT
Crypto Futures: CME:BTC1! , CME:ETH1!
---
NOTES
This version does not include alert conditions. Visual-first design.
It will be easier to understand if you have a preliminary knowledge of the concepts beforehand
This is not a learning instrument on it's own and could have bugs, Know it for yourself so you can identify bugs if any.
---
DISCLAIMER
This indicator is provided for educational and analytical purposes only. It does not constitute financial advice, and no representation is made regarding future performance.
Trading involves substantial risk of loss. Always conduct your own analysis and use proper risk management. Past structural patterns do not guarantee future price behavior.
---
CREDITS
Inspiration and HTF candle plotting boilerplate: @fadizeidan
Asset correlation library: fstarcapital
Development: cephxs & fstarcapital
---
CHANGELOG
v1.0: Initial Pro+ release — SMT divergences, CISD detection, multi-HTF Po3 profiling
