XAUUSD 1H – FVG Buy/Sell Signals XAUUSD 1H – Fair Value Gap (FVG) Buy/Sell Signals (No Boxes)
What it is:
A clean, signal-only indicator for Gold on the 1-hour chart. It detects 3-bar Fair Value Gaps, waits for a deep retest, then confirms with strong candle structure + trend + ADX before printing a BUY/SELL arrow. No rectangles or clutter—just selective, high-quality signals.
Why it works:
Instead of chasing breakouts, the script hunts for imbalances (FVGs) where price often returns to “fair value.” It only fires when:
price revisits the gap by a configurable depth,
the candle closes beyond the far edge with a small buffer,
the candle body is ≥ ATR × K (confirms intent),
the broader trend (EMA-50/EMA-200) agrees, and
ADX (Wilder, manual) shows sufficient strength.
Key features
✅ Signal-only: arrows/labels—no boxes on chart.
✅ Deep retest logic (percentage of zone), not just a touch.
✅ Strong close filter (edge + buffer) + ATR body filter.
✅ Trend filter (EMA-50 vs EMA-200) to keep trades with the regime.
✅ ADX strength to avoid chop.
✅ One signal per zone (optional “delete on use”).
✅ Alerts for both BUY and SELL.
✅ Built for Pine v6, non-repainting logic on bar close.
Inputs you can tune
Min FVG size (pts) – ignore tiny gaps.
Retest depth (%) – how deep price must come back into the gap.
Close buffer (pts) – extra confirmation beyond zone edge.
Min body ≥ ATR× – candle strength requirement.
Min ADX – trend strength threshold.
Expire after X bars – keep zones fresh.
Delete zone after signal – true = one-shot signals.
How I use it
Apply to XAUUSD 1H.
Keep default filters for selective signals.
For more setups, lower Min FVG size or ADX and reduce retest depth; for stricter signals, do the opposite.
Combine with S/R or session timing (London/NY) for added confluence.
Notes
Signals are generated on bar close.
Designed for clarity and discipline—fewer, cleaner arrows over constant noise.
Works on other symbols/timeframes, but tuned for Gold 1H.
Tags: #XAUUSD #Gold #FVG #SmartMoney #1H #TrendFollowing #ADX #ATR #PineV6 #TradingView
Tìm kiếm tập lệnh với "fvg"

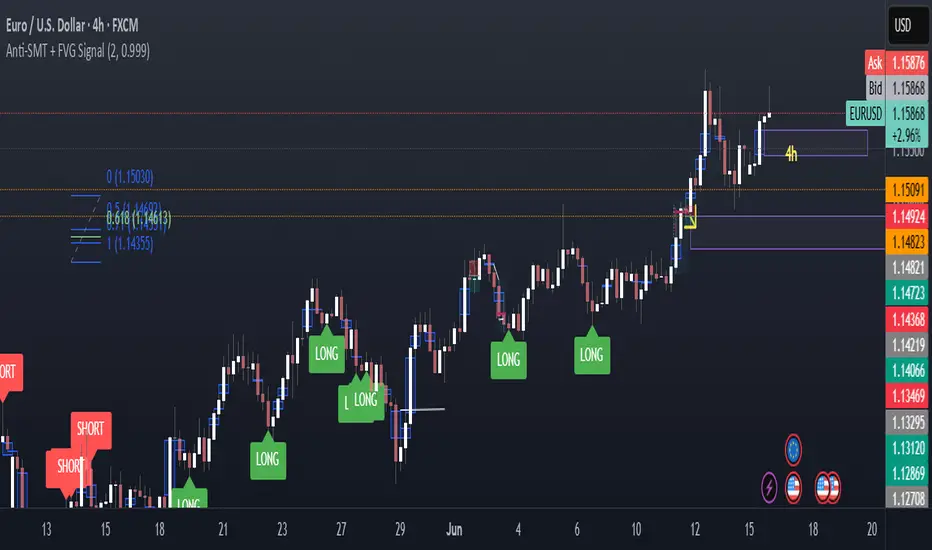
Anti-SMT + FVG SignalMade by Laila
Anti-SMT + FVG Strategy
A contrarian price-action strategy that combines SMT illusion with Fair Value Gap (FVG) confirmation and multiple filters.
Strategy Concept
This strategy challenges traditional SMT divergence logic. Instead of entering trades based on expected SMT divergence between correlated pairs (e.g., EURUSD and DXY), it assumes the divergence is false and will reverse. The concept is to take advantage of these false signals, also known as "SMT illusions."
To confirm the setup, the strategy integrates Fair Value Gaps (FVGs), which are price imbalances left unfilled between candle 1 and 3.
Anti-SMT Logic
Short Entry:
EURUSD makes a new high (Candle 1)
DXY does not make a new low
Long Entry:
EURUSD makes a new low (Candle 1)
DXY does not make a new high
This divergence is considered false, and the strategy expects a reversal.
Fair Value Gap (FVG) Confirmation
A trade is only triggered if the price touches a Fair Value Gap during:
Candle 1 (the candle that forms the SMT illusion), or
Candle 2 (entry confirmation)
This helps avoid low-quality setups and increases entry precision.
Additional Filters
To improve robustness and prevent overfitting, the strategy includes:
EMA Trend Filter:
Long entries are allowed only if price is above the 50 EMA
Short entries are allowed only if price is below the 50 EMA
Time Filter:
Trades are only permitted between 08:00 and 18:00 UTC
Cooldown Filter:
A minimum of 10 candles between trades is required to prevent overtrading
Strategy Parameters and Defaults
Optimized for EURUSD on the 4-hour (4H) timeframe
Includes realistic commission and slippage
Uses conservative position sizing (e.g., 1% per trade)
Backtesting over hundreds of trades shows approximately 57% win rate under default conditions
These results are historical and do not guarantee future performance
Purpose and Value
This strategy offers a structured and logical approach to contrarian trading by:
Introducing the concept of false SMT divergence
Using price inefficiencies (FVGs) as confirmation
Filtering trades with realistic and widely accepted conditions
Encouraging quality over quantity through strict entry rules
It is not a simple mashup but a well-defined trading system that blends institutional concepts in a usable framework.
Pipsttocra Technical Patterns: EV HV FVG & OBPipstocrat Technical Patterns , identifies and visualizes key technical analysis patterns and structures on a TradingView chart. Here's a simple breakdown of what it does:
Fair Value Gaps (FVG):
Detects and highlights bullish and bearish Fair Value Gaps as colored boxes.
Adds centerline markers to indicate potential price levels.
Order Blocks (OB):
Identifies bullish and bearish order blocks (areas of significant buying or selling).
Displays them as colored rectangles extending to the right of the chart.
Candlestick Patterns:
Detects Engulfing Patterns (bullish and bearish) with volume confirmation.
Highlights Hammer and Inverted Hammer patterns with customizable shapes and colors.
Customization Options:
Allows users to adjust colors, sizes, and styles for all patterns and structures.
Provides options to show/hide specific patterns like FVGs, engulfing candles, hammers, etc.
Alerts:
Generates alerts for detected patterns, such as FVGs, order blocks, engulfing candles, and confluence zones (combination of FVGs and order blocks).
Management Features:
Automatically removes older or "filled" patterns (optional).
Tracks and updates patterns dynamically as new bars form.
Purpose:
This tool helps traders spot high-probability trading opportunities by identifying key market structures (like FVGs and order blocks) and candlestick patterns. It combines multiple technical analysis concepts into one comprehensive indicator for better decision-making.

Fair Value Gap FinderFunctionality
Detection of Fair Value Gaps:
A bullish Fair Value Gap (FVG Up) is identified when the low of two candles before the current bar (low ) is greater than the high of the current bar (high ).
A bearish Fair Value Gap (FVG Down) is identified when the high of two candles before the current bar (high ) is lower than the low of the current bar (low ).
Color Coding:
Bullish Fair Value Gaps are highlighted in green to indicate potential areas of support.
Bearish Fair Value Gaps are highlighted in red to indicate potential areas of resistance.
Visualization Using Rectangles:
If an FVG is detected, the script creates a rectangle spanning a fixed number of bars (right=bar_index+5) to visualize the price inefficiency.
The rectangle extends from the upper to the lower boundary of the gap and has a semi-transparent fill (bgcolor=color.new(color, 90)) for better readability.
Implementation Details
Variable Initialization: The script defines floating-point variables (fvgUpTop, fvgUpBottom, fvgDownTop, fvgDownBottom) to store the price levels of identified gaps.
Conditional Assignments: When an FVG is detected, the corresponding top and bottom boundaries are assigned to the respective variables.
Box Creation: The box.new function is used to draw a rectangle on the chart, marking the FVG zones for better visualization.

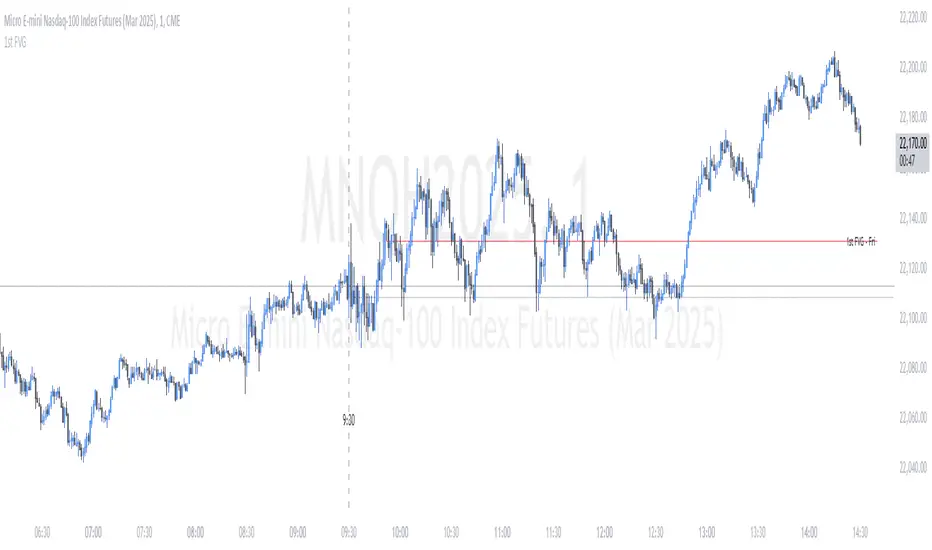
ICT First Presented FVG - NY Open [LuckyAlgo]
This indicator identifies the first Fair Value Gap (FVG) that occurs during the New York trading session, combined with NY session opening price levels. It's an essential tool for traders who follow ICT concepts and focus on the NY trading session.
ICT refers to this as the First Presented FVG, while other traders may call it the 9:30 FVG.
This indicator is best for the 1 minute timeframe, while 5 minute also works.
Detects and marks the first FVG of the NY session
Displays both bullish (green) and bearish (red) FVGs with customizable transparency
Shows the NY session opening price with clear labels
Includes optional vertical line at 9:30 AM NY open
Maintains clean chart visibility with adjustable maximum display days
Includes session date and time labels for easy reference
The indicator helps traders identify potential reversal zones and continuation opportunities by combining two powerful concepts: Fair Value Gaps and NY session opening price. This makes it particularly valuable for day traders and swing traders who want to capitalize on institutional order flow patterns during the most liquid trading session.
You can customize the indicator's appearance, including FVG box colors, time range display, and whether to show the NY open markers. This flexibility allows you to integrate it seamlessly with your existing trading setup.
Fair Value Gap ChartThe Fair Value Gap chart is a new charting method that displays fair value gap imbalances as Japanese candlesticks, allowing traders to quickly see the evolution of historical market imbalances.
The script is additionally able to compute an exponential moving average using the imbalances as input.
🔶 USAGE
The Fair Value Gap chart allows us to quickly display historical fair value gap imbalances. This also allows for filtering out potential noisy variations, showing more compact trends.
Most like other charting methods, we can draw trendlines/patterns from the displayed results, this can be helpful to potentially predict future imbalances locations.
Users can display an exponential moving average computed from the detected fvg's imbalances. Imbalances above the ema can be indicative of an uptrend, while imbalances under the ema are indicative of a downtrend.
Note that due to pinescript limitations a maximum of 500 lines can be displayed, as such displaying the EMA prevent candle wicks from being displayed.
🔶 DETAILS
🔹 Candle Structure
The Fair Value Gap Chart is constructed by keeping a record of all detected fair value gaps on the chart. Each fvg is displayed as a candlestick, with the imbalance range representing the body of the candle, and the range of the imbalance interval being used for the wicks.
🔹 EMA Source Input
The exponential moving average uses the imbalance range to get its input source, the extremity of the range used depends on whether the fvg is bullish or bearish.
When the fvg is bullish, the maximum of the imbalance range is used as ema input, else the minimum of the fvg imbalance is used.

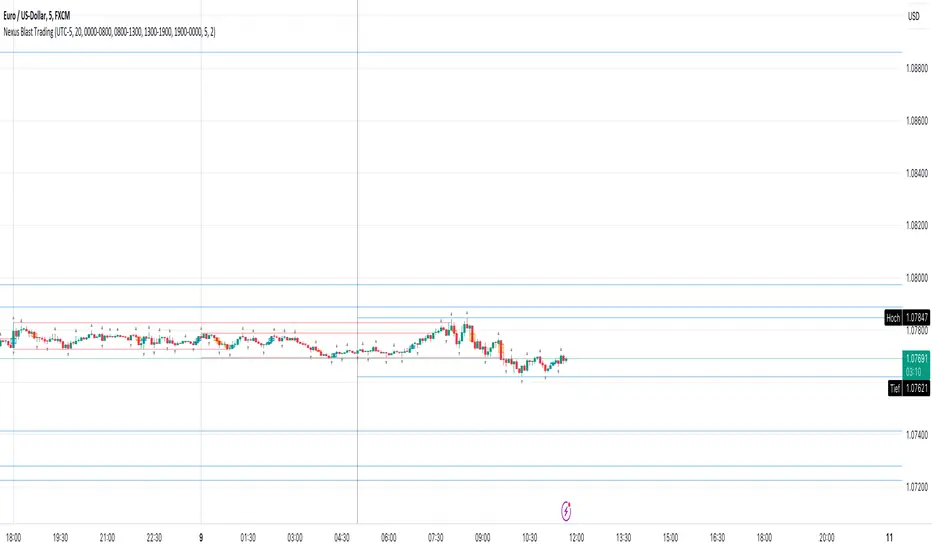
Nexus Blast Trading Strategy [Kaspricci]Nexus Blast Trading Strategy - Kaspricci
This indicator shows the different sessions during the day (London session, New York AM session, New York PM session and Asian session) by adding vertical lines and draws horizontal lines for the high and low during each session. Furthermore those lines turn red once the price has taken this high or low. Blue lines indicate liquidity not yet taken.
On top the indicator draws boxes of different color to indicate bullish and bearish Fair Value Gaps (FVG).
Happy to receive your feedback. Please leave a comment for bugs as well as ideas for improvement.
General Settings
Time Zone - used for marking sessions and end of day.
Sessions
Sessions - start and end time for each session based on set time zone
Number of Days back - for how many days in the past the startegy will draw strategy highs and lows. Theres is a maximum of 50 days defined.
FVG Settings
Threshold in Ticks - you can hide very small FVGs by increasing this threshold
FVG Colors - colors used for the bearish and bullish FVG box
This script is for educational purposes only! It is not meant to be a financial advice.
PS: The former strategy script was removed by TV, as it would violate several rules according to them.
True FVGs v2This script identifies and plots true Fair Value Gaps (FVGs) using a strict three-candle structure, distinguishing between two formation types while accounting for doji candles. It draws shaded boxes to represent untraded price imbalances, with Type A and Type B gaps defined by precise wick-to-body and body-to-body relationships that reflect institutional price displacement. The indicator allows the user to control how far each FVG extends and how many recent FVGs remain visible, keeping the chart clean and relevant. This is helpful because it highlights high-probability areas where price is likely to react, enabling more precise trade planning, entries, and risk management without visual clutter. It expands on the first script (True FVGs) and allows for a more controlled design fitting each trader's desires.

True FVGsThis script highlights 3-candle Fair Value Gaps (FVGs) on your chart, showing areas where price moved quickly and left potential gaps in market structure. Bullish FVGs are shown with green boxes and suggest possible support, while bearish FVGs are shown with red boxes and suggest possible resistance. It also includes doji candles—very small-bodied candles that indicate indecision—so these patterns are not missed. The script displays the most recent 5 FVGs, making it easy to spot recent potential areas where price may react.

Baby ICT Simple Asia H/L + Sweeps + FVG + Alerts + Do-NothingBaby ICT Simple+ is a lightweight, rules-based TradingView indicator designed to help traders visualize key ICT-style concepts without complexity or signal-chasing. It focuses on Asia session liquidity, after, and fair value gapsto su
This tool is intentionally simple and is meant to be used alongside session timing, price action, and risk management — not as a buy/sell signal generator.
🔍 What This Indicator Displays
But
Automatically tracks and plots the Asia session high and low
Fully customizable line colors and width
These levels often act as liquidity pools before London and New York sessions
Liquidity Sweeps (Post-Asia)
Identifies the first time price takes liquidity above or below the Asia range
Sweep detection can be based on wicks or closes
Optional sweep labels help highlight potential stop-run behavior
Asia Break & Sweep Alerts
Alerts when price breaks the Asia high or low after the Asia session ends
Optional alerts for the first sweep only, helping traders focus on high-quality context
Fair Value Gaps (FVGs)
Detects classic 3-candle price imbalances on the active timeframe
Optional filter to show only FVGs that form after a liquidity sweep
Bullish and bearish FVGs are fully customizable with separate fill and border colors
“Do Nothing” Discipline Labels
Optional warning labels during a user-defined kill zone
Designed to discourage over-trading when:
No liquidity has been taken
Price is stuck mid-range
A sweep occurred but no clean displacement or fresh FVG followed
🧠 Intended Use
This indicator supports a “Baby ICT” approach, emphasizing:
Waiting for liquidity to be taken before looking for entries
Using Fair Value Gaps as entry zones, not signals
Avoiding mid-range and low-probability environments
Trading primarily during active sessions (London / New York)
Best used on:
5-minute charts
Index futures (ES, NQ) or liquid FX pairs
With session-based execution and strict risk control
🚫 What This Indicator Is NOT
❌ Not a buy/sell signal tool
❌ Not an automated trading strategy
❌ Not predictive or guaranteed
All trade decisions remain the responsibility of the trader.
⚠️ Risk Disclaimer
Trading involves risk. This indicator is provided for educational and informational purposes only and does not constitute financial advice. Always manage risk responsibly and test any tool thoroughly before using it in live markets.
✨ Final Notes
If you are looking for a clean, non-hype way to visualize:
Where liquidity is likely taken
Where price may rebalance
When it’s best to stand aside
Baby ICT Simple+ was built for that purpose.

Institutional Confluence Nexus [Pro]The Problem: Noise vs. Signal
In the world of Smart Money Concepts (SMC), traders are often overwhelmed by "chart clutter." Standard indicators blindly highlight every Fair Value Gap (FVG) and Order Block (OB), regardless of whether the market is trending, ranging, or dead. This leads to analysis paralysis and low-probability entries.
The Institutional Confluence Nexus was built to solve this. It is not just a structure detector; it is a filtering engine. It uses a multi-factor model to hide low-probability zones and only highlight setups where Structure, Volume, and Momentum align.
The "Quantum" Integration
This script includes a built-in Quantum Regression Oscillator (QRO) engine running in the background. Unlike standard RSI or MACD which are reactive (lagging), the QRO uses Linear Regression mathematics to project momentum trajectory.
By combining institutional structure (Price Action) with quantum momentum (Math), this tool generates specific high-probability signals that only appear when price action and momentum are in perfect agreement.
How It Works & Visual Guide
This indicator is a complete trading suite. Here is what every symbol and color on your chart represents:
1. The "Nexus" Reversal Signals (Triangles)
Symbol : Green Triangle (Up) / Red Triangle (Down) labeled NEXUS.
Logic : These appear when price taps a valid Order Block that aligns with the macro trend (200 EMA).
Meaning : These are your primary "Trend Join" setups. They indicate that the institutional trend is resuming after a retracement.
2. High-Volume Breakouts (Bar Colors)
Symbol : Yellow Candles (Bullish) / Orange Candles (Bearish).
Logic : The script detects when a Break of Structure (BOS) occurs with Above-Average Volume.
Meaning : A breakout without volume is often a fakeout. These colored bars confirm that institutions are fueling the move. If you see a Yellow bar, it means "Smart Money" is buying the breakout.
3. QRO Confluence Signals (Labels)
These are the most advanced signals in the suite, combining Price Action with the internal Oscillator:
SNIPER (Blue/Purple) : The strongest reversal signal.
Condition : Price taps a Fair Value Gap + The internal QRO is at extreme volatility bands (Oversold/Overbought).
PB BUY / PB SELL (Aqua/Orange) : A trend continuation signal.
Condition : Price pulls back into a Fair Value Gap + The internal QRO confirms momentum is still healthy (above/below midline).
Note : These signals automatically draw a Red Line at the invalidation point (Stop Loss) to help you manage risk immediately.
4. The Confluence Dashboard
A non-intrusive Heads-Up Display (HUD) in the corner gives you a snapshot of the market state:
Trend : Is price above/below the 200 EMA?
Volume : Is current volume anomalous (High) or normal?
Structure : Are we breaking up, down, or ranging?
Settings & Customization
Smart Money Structure: Toggle FVGs and Order Blocks on/off.
FVG Extend: Control how far the gap "zones" extend to the right to see them as support/resistance zones.
Volume Filter: Enable/Disable the volume requirement (Keep enabled for higher strike rate).
Risk Management: Adjust the "Lookback" period for the automatic Stop Loss lines.
For Developers (Open Source)
I have kept the code open-source to foster learning in the Pine Script community. You can study how:
ta.linreg is used to smooth RSI data for the internal QRO engine.
box.new and line.new are used for dynamic drawing and extending zones.
var variables are used to store historical FVG levels to detect precise crossovers.
Disclaimer:
This tool is designed to assist with technical analysis and educational purposes. It does not guarantee profits. Always manage your risk and use this in conjunction with your own analysis.

M15 Impulse FVG EntryM15 Impulse FVG Entry
M15 Impulse FVG Entry is a minimalist price-action tool designed to highlight structured entry contexts using impulse candles, decision zones, and Fair Value Gap (FVG) logic.
⸻
Core Logic
1. M15 Impulse Candle
A strong M15 candle is identified using ATR expansion and body-to-range ratio.
This candle defines a decision zone (High / Low).
2. IN Candle
Only the first candle that forms fully inside the decision zone after the M15 impulse is considered.
This candle acts as the structural reference.
3. OUT Candle
Price must break cleanly outside the zone.
The previous candle must already close outside the zone.
No reversal is allowed through the IN candle extreme.
4. FVG Entry Context
The gap between the IN candle and the OUT candle forms the Fair Value Gap.
A midpoint between IN and OUT can be used as a potential entry reference.
⸻
What This Script Shows
• M15 — Impulse candle marker
• Zone — High / Low of the impulse candle
• IN — First valid candle inside the zone
• OUT — Valid breakout candle
⸻
Design Philosophy
• No BUY / SELL bias
• No alerts, no automation
• No indicator stacking
• Clean and chart-friendly
This script provides market context and structure only .
Risk management and execution rules remain the trader’s responsibility.

ICT FVG MNQ (Fixed Stop + Multi-TP Toggles)ICT FVG
use-18 Min timeframe
0) Stabilizer
Evaluation Mode: PriceCh... (PriceChange mode selected)
Bypass Session Filter: OFF (unchecked)
Bypass Open Delay: OFF
Bypass Cooldown: OFF
1) Entry Logic
Swing Strength (past-only): 4
FVG Min Size (ticks): 8
FVG Expire Bars: 12
2) Risk Management
Contracts (integer): 10
Hard Stop (ticks): 65
Use Trailing Stop: OFF
Trail Activation (ticks): 30
Trail Offset (ticks): 15
Use BreakEven (only with Trailing): OFF
BE Trigger (ticks): 20
BE Plus (ticks): 2
Cooldown Bars: 3
Market Open Delay (minutes): 2
2B) Multi Take Profit (No Trailing)
Use TP1/TP2/TP3 when Trailing OFF: ON (checked)
Enable TP1: ON
Enable TP2: ON
Enable TP3: OFF
TP1 Ticks: 29
TP2 Ticks: 54
TP3 Ticks: 54
TP1 %: 30
TP2 %: 60
TP3 %: 30
Move SL to Entry when TP2 fills: OFF (unchecked)
2C) Safety Exits
Force Exit at Session End: ON (checked)
(A “Max Bars In Trade” box is partially visible but not fully shown.)
3) Sessions
Timezone (IANA): America/New... (looks like America/New_York)
Enable Session 1: ON
S1 Start: 0 : 00
S1 End: 16 : 55
Enable Session 2: OFF
(Values shown: S2 Start 18:02, S2 End 23:55, but session 2 is disabled)
4) Visual
Show FVG Zones: ON
Show Dashboard: ON
Dashboard Position: TopRight

ORB + FVG + PDH/PDL ORB + FVG + PDH/PDL is an all-in-one day-trading overlay that plots:
Opening Range (ORB) high/low with optional box and extension
Fair Value Gaps (FVG) with optional “unmitigated” levels + mitigation lines
Previous Day High/Low history (PDH/PDL) drawn as one-day segments (yesterday’s levels plotted across today’s session only)
Includes presets (ORB only / FVG only / Both) and optional alerts for ORB touches, ORB break + retest, FVG entry, and PDH/PDL touches.

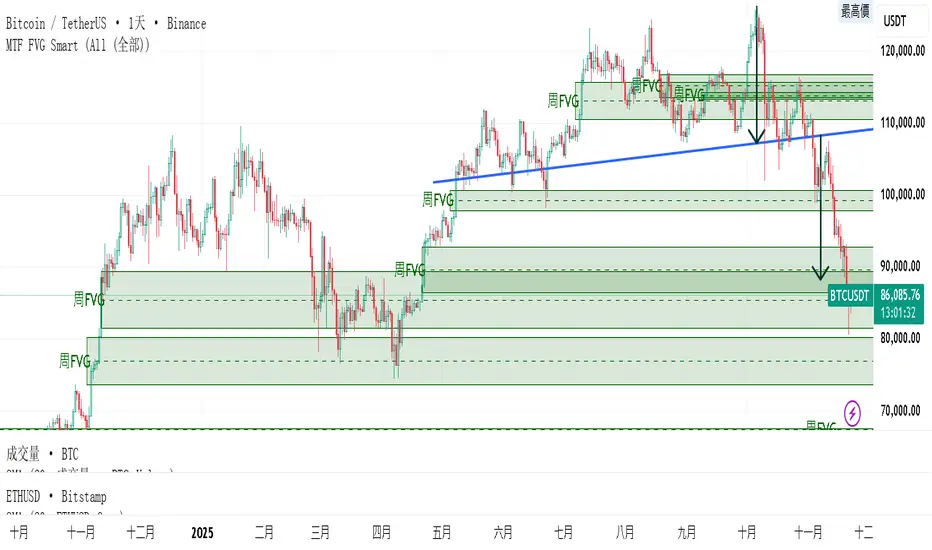
MTF FVG 智能終極版 (Smart Clean)指標名稱:MTF FVG 智能終極版 (Smart Clean)
簡潔介紹
這是一款專為專業交易者設計的 多週期失衡區 (FVG) 監控系統,核心特色如下:
五維度監控:
在任何圖表上同時顯示 月、周、日、4H、2H 五種級別的支撐壓力缺口。
智慧重疊清理 (獨家):
當價格重疊時,自動刪除舊框框,只保留最新的 1~3 個(可設定);若無重疊則完整保留歷史痕跡。確保圖表乾淨且資訊不遺漏。
完美視覺體驗:
大週期無限延伸,小週期固定長度。
文字自動靠右並智慧留白,確保不遮擋右側價格座標。
深色邊框 + 淺色填充 + 中線虛線,層次分明。
Indicator Name: MTF FVG Smart Clean Ultimate Edition
Brief Introduction
This is a multi-timeframe Free Gaps (FVG) monitoring system designed for professional traders. Its core features include:
Five-Dimensional Monitoring: Simultaneously displays support, resistance, and gaps at five timeframes (monthly, weekly, daily, 4H, and 2H) on any chart.
Intelligent Overlap Cleanup (Exclusive): When prices overlap, automatically deletes old boxes, retaining only the latest 1-3 (configurable); if there is no overlap, it retains all historical data. Ensures a clean chart and complete information.
Perfect Visual Experience: Larger timeframes extend infinitely, while smaller timeframes have fixed lengths.
Text automatically aligns to the right with intelligent white space to ensure it doesn't obscure the price coordinates on the right.
Dark borders + light fill + dashed center line create clear visual hierarchy.
ICT Sweep + CHoCH + FVG Alerts
### 🔥 ICT Sweep + CHoCH + FVG Alerts
Script designed to automate ICT entry confirmations using:
• Liquidity Sweep (Buy/Sell Stops taken)
• Change of Character (CHoCH)
• Fair Value Gap (FVG) confirmation
### ✅ Conditions
**Long signal when:**
1. Bearish liquidity sweep
2. Bullish CHoCH
3. Bullish FVG forms and gets respected
**Short signal when:**
1. Bullish liquidity sweep
2. Bearish CHoCH
3. Bearish FVG forms and gets respected
### 🎯 Purpose
This script helps traders detect smart-money setup entries based on ICT logic and receive alerts in real time.
### 📡 Alerts
Supports webhook automation for bots, signal servers, or trading platforms.
*This script does not place trades automatically, alerts only.*
### ⚠️ Disclaimer
This tool is for educational purposes.
Always backtest and use proper risk management.
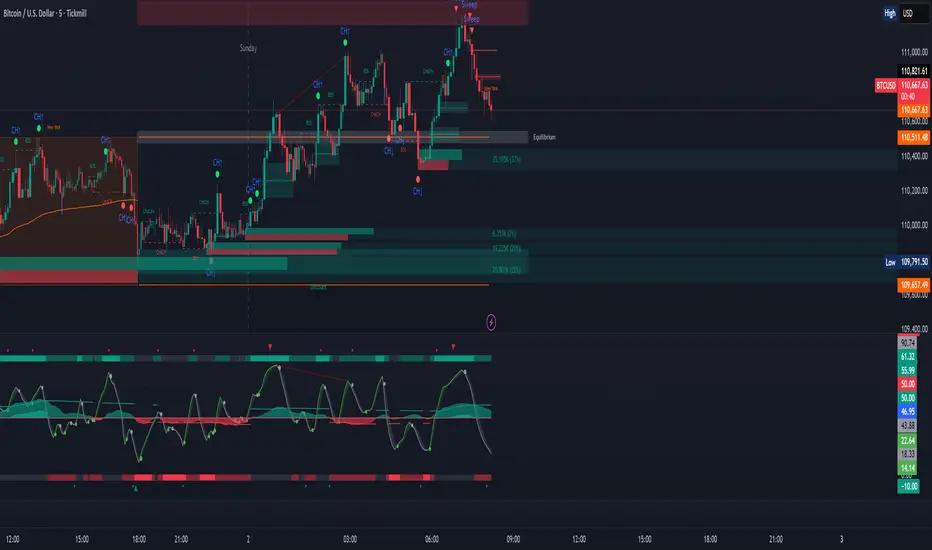
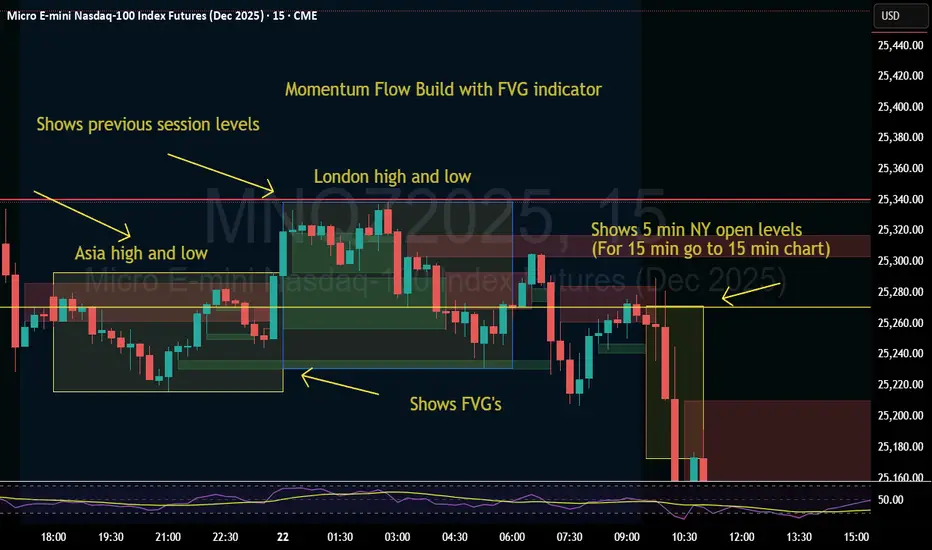
Momentum Flow Build w/ FVG v2Good day.
The Momentum Flow Build w/ FVG v2 indicator
shows the previous session levels of Asia and London,
and the 5 min NY open levels (for 15 min go to 15 min chart).
The indicator also shows the FVGs.
The idea is that if price reaches a key level, we then
watch the level for whether price respects FVGs with a
retracement and engulfing candle at the FVG, or whether
price inverts the FVG (IFVG).
Cool. Be encouraged. Peace
Fair Value Gaps by DGTFair Value Gaps
A refined, multi-timeframe Fair Value Gap (FVG) detection tool that brings institutional imbalance zones to life directly on your chart.
Designed for precision, it visualizes how price delivers into inefficiencies across chart, higher, and lower (intrabar) timeframes — offering a fluid, structural view of liquidity displacement and market flow.
The script continuously tracks unfilled, partially repaired, and fully resolved imbalances, revealing where liquidity inefficiencies concentrate and where price may seek rebalancing.
Overlapping zones naturally expose institutional footprints, potential liquidity targets, and key re-pricing regions within the broader market structure.
KEY FEATURES
⯌ Multi-Timeframe Detection
Detect and display FVGs from the current chart, higher timeframes (HTF), or lower timeframes (LTF)
⯌ Smart Fill Tracking
Automatic real-time monitoring of each FVG’s fill progress with live percentage updates
⯌ Custom Fill Logic
Choose your preferred definition of when a gap is considered filled: Any Touch
Midpoint Reached
Wick Sweep
Body Beyond
⯌ Dynamic Labels & Tooltips
Labels can be toggled on/off. Even when hidden, detailed tooltips remain available by hovering over the FVG midpoint.
⯌ Adaptive Lower-Timeframe Mode
When set to “Auto,” the script intelligently selects the optimal lower timeframe based on the chart resolution.
DISCLAIMER
This script is intended for informational and educational purposes only. It does not constitute financial, investment, or trading advice. All trading decisions made based on its output are solely the responsibility of the user.

ICT SMC — OB & FVG (Enhanced v6)This indicator is a comprehensive implementation of ICT Smart Money Concepts (SMC), focusing on Order Blocks (OB) and Fair Value Gaps (FVG) with enhanced detection logic and session-based filtering.
🔍 Key Features
Impulse-Based OB Detection: Identifies bullish and bearish order blocks using configurable impulse bar logic and ATR-based movement thresholds.
Fair Value Gap Detection: Highlights FVGs based on price displacement logic, helping traders spot potential inefficiencies in price action.
Session Filtering: Allows users to filter signals based on major trading sessions (Sydney, Tokyo, London, New York).
Trend & Volume Confirmation: Integrates EMA slope, market structure breaks, and volume analysis to score trade signals.
Visual Zones: Displays OB and FVG zones using colored boxes with customizable transparency and color settings.
Signal Alerts: Generates long/short trade signals based on a scoring system and session validation, with built-in alert conditions.
⚙️ Customization
Adjustable EMA and ATR lengths
Configurable impulse bar count and movement thresholds
Toggleable session filters
Custom colors for OB and FVG zones
📈 Use Cases
This tool is ideal for traders who follow ICT concepts and want a visual, automated way to identify high-probability zones and trade setups based on smart money principles.

Shamji's Liquidity Sweep + FVG (Follow-up + Filters) Purpose (what it does)
This indicator looks for two related price structures used by many smart-money / liquidity-hunt traders:
Liquidity Sweeps — candles that wick beyond a recent swing high (for buy-side stop-hunts) or swing low (for sell-side stop-hunts), then close back inside. These are flagged as potential stop-hunt events that clear obvious liquidity.
Fair Value Gaps (FVGs) — simple 3-bar style gaps where an older bar’s high is below the current low (bullish FVG) or an older bar’s low is above the current high (bearish FVG). When an FVG appears after a sweep (within a configurable window), this is considered a follow-up alignment.
The script adds optional filters (volume spike and candle-range vs ATR) to increase confidence, and can restrict marking/alerts to only events that meet the follow-up and filter rules.

ICT Sweep + FVG Entry (v6) • Pro Pack 📌 ICT Sweep + FVG Entry Pro Pack
This indicator combines key ICT price action concepts with practical execution tools to help traders spot high-probability setups faster and more objectively. It’s designed for scalpers and intraday traders who want to keep their chart clean but never miss critical market structure events.
🔑 Features
Liquidity Pools (HTF)
• Auto-detects recent swing highs/lows from higher timeframes (5m/15m).
• Draws both lines and optional rectangles/zones for clear liquidity areas.
Liquidity Sweeps (BSL/SSL)
• Identifies when price sweeps above/below liquidity pools and rejects back.
• Optional Grade-A sweep filter (wick size + strong re-entry).
Fair Value Gaps (FVGs)
• Highlights bullish/bearish imbalances.
• Optional midline (50%) entry for precision.
• Auto-invalidation when price fully closes inside the gap.
Killzones (New York)
• Highlights AM (9:30–11:30) and PM (14:00–15:30) killzones.
• Option to block signals outside killzones for higher strike rate.
Bias Badge (DR50)
• Displays if price is trading in a Bull, Bear, or Range context based on displacement range midpoint.
SMT Assist (NQ vs ES)
• Detects simple divergences between indices:
Bearish SMT → NQ makes HH while ES doesn’t.
Bullish SMT → NQ makes LL while ES doesn’t.
SL/TP Helper & R:R Label
• Automatically draws stop loss (at sweep extreme) and target (opposite pool or recent swing).
• Displays expected Risk:Reward ratio and blocks entries if below your chosen minimum.
Filters
• ATR filter ensures signals only appear in sufficient volatility.
• Sweep quality filter avoids weak wicks and fake-outs.
🎯 How to Use
Start on HTF (5m/15m) → Identify liquidity zones and bias.
Drop to LTF (1m) → Wait for a liquidity sweep confirmation.
Check for FVG in the sweep’s direction → Look for retest entry.
Use the SL/TP helper to validate your risk/reward before taking the trade.
Focus entries during NY Killzones for maximum effectiveness.
✅ Why this helps
This tool reduces screen time and hesitation by automating repetitive ICT concepts:
Liquidity pools, sweeps, and FVGs are marked automatically.
Killzone timing and SMT divergence are simplified.
Clear visual signals for entries with built-in RR filter help keep your trading mechanical.
⚠️ Disclaimer: This script is for educational purposes only. It does not provide financial advice or guarantee results. Always use proper risk management.

Smarter Money Concepts - MTF IFVGs [PhenLabs]📊 Smarter Money Concepts - MTF IFVG
Version: PineScript™ v6
📌 Description
This multi-timeframe indicator identifies Inverse Fair Value Gaps (IFVGs) and their inversions across simultaneous chart intervals, helping traders spot liquidity voids and potential reversal zones. By analyzing price action through the lens of institutional order flow patterns, it solves the problem of manual gap tracking across timeframes while incorporating volatility-adjusted parameters and psychological level analysis for higher-probability setups.
🚀 Points of Innovation
• Multi-Timeframe Engine - Simultaneous analysis of 3 higher timeframes
• Adaptive Parameters - Auto-adjusts to market volatility conditions
• Quality Scoring System - Ranks gaps using RVI strength and size metrics
• Inversion Tracking - Monitors failed gaps for counter-trend signals
• Render Optimization - Prevents chart clutter with smart gap management
🔧 Core Components
FVG Detection Logic: Identifies gaps using customizable price source (Close/Wick)
Inversion Tracker: Manages failed gaps and generates counter signals
Multi-Timeframe Engine: Processes 3 independent higher timeframe analyses
Dashboard System: Real-time display of active gaps across all timeframes
🔥 Key Features
• Volatility-adjusted gap size filters (ATR-based)
• Customizable timeframe confluence analysis
• Color-coded quality scoring
• Non-repainting inversion signals
• Mobile-optimized visual rendering
🎨 Visualization
• Colored Boxes: Translucent zones show active gaps (green/bullish, red/bearish)
• Midline Plot: Dashed gray line marks gap midpoint for price targets
• Inversion Markers: Intense colors show failed gaps (dark red/bullish failure, bright green/bearish failure)
• HTF Differentiation: Higher timeframe gaps shown in blue/teal hues
📖 Usage Guidelines
Multi-Timeframe Settings
• Higher Timeframe 1
Default: 30 | Range: Any > Chart TF | Controls primary confluence timeframe
• Show All Timeframes
Default: True | Toggles multi-TF gap displays
Gap Settings
• Source
Default: Close | Options: | Determines gap measurement method
• RVI Period
Default: 14 | Range: 1-50 | Sets momentum confirmation sensitivity
• RVI Value
Default 0.1 | 0 to see all IFVGs | Increase min RVI to see the most powerful IFVGs
✅ Best Use Cases
• Identifying confluence across timeframes
• Spotting institutional order blocks
• High-probability reversal trading
• Trend continuation confirmation
• Volatility breakout setups
⚠️ Limitations
• Repaints historical gap zones
• Requires understanding of FVG concepts
• Higher timeframe data latency
• Quality scores rely on RVI/ATR settings
💡 What Makes This Unique
First FVG indicator with true multi-timeframe processing
Adaptive parameters that auto-adjust to volatility
Quantifiable quality scoring system
Professional-grade dashboard with HTF tracking
🔬 How It Works
Gap Detection: Identifies FVGs using price relationships and RVI confirmation
Inversion Tracking: Monitors price breaches to flag failed gaps
Quality Assessment: Scores gaps based on size, momentum, and location
Adaptive Filtering: Adjusts parameters using ATR-based volatility analysis
Multi-TF Synthesis: Correlates gaps across user-selected timeframes
Visual Rendering: Displays only relevant, active gaps to prevent clutter
💡 Note:
Start with default settings and gradually adjust parameters after observing market interactions. Focus on gaps with quality scores above 7 that align with higher timeframe trends. Combine with price action at psychological levels for highest-probability setups. Remember that higher timeframe gaps generally carry more significance than current chart gaps.

Nirmal Fair Value GapsICT Fair Value Gaps
Trade Wisely
How a Fair Value Gap Works
Formation:
A Fair Value Gap occurs when a strong price movement (usually from institutional orders) creates an imbalance between buyers and sellers.
This is typically seen in a three-candle pattern, where the middle candle has a large body, and the two surrounding candles have wicks but little overlap with the middle candle’s range.
Identification:
The FVG is marked between the high of the first candle and the low of the third candle (for bullish gaps).
For bearish gaps, it’s the low of the first candle and the high of the third candle.
Market Behavior Around FVG:
Price often retraces into the gap before resuming its original direction.
This happens because the market seeks to "fill" the imbalance where few trades occurred.
Traders use FVGs as potential entry zones for trend continuation trades.
Trading Fair Value Gaps
In an Uptrend:
Look for bullish fair value gaps as potential support zones for buy entries.
Price may dip into the gap and then continue upward.
In a Downtrend:
Look for bearish fair value gaps as potential resistance zones for sell entries.
Price may retrace into the gap and then drop further.
Confluence Factors:
FVGs work best when combined with other strategies like order blocks, liquidity zones, or key Fibonacci levels.
