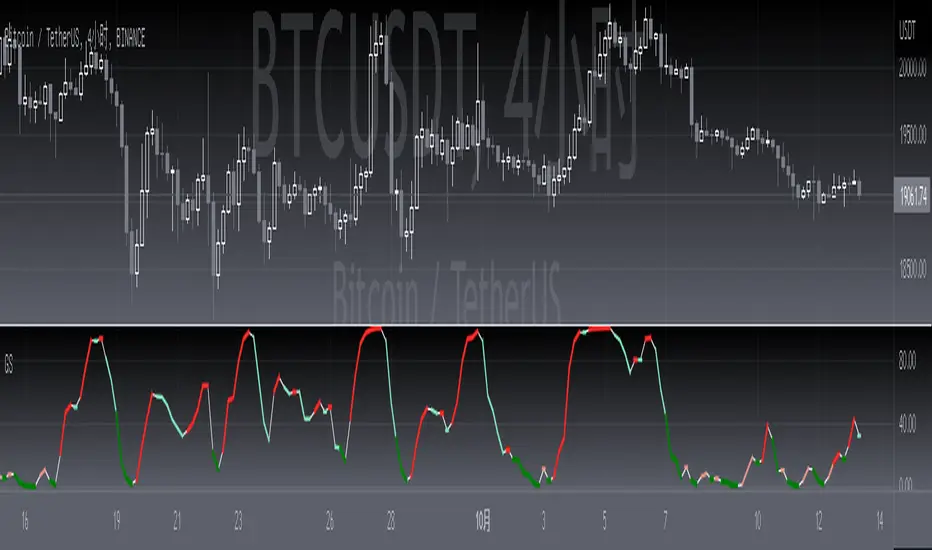
DarkPool's Gann High Low Activator DarkPool's Gann High-Low Activator.
It enhances the traditional trend-following logic by integrating Heikin Ashi smoothing, Multi-Timeframe (MTF) analysis, and volatility filtering. It is designed to filter out market noise and provide clearer trend signals during volatile conditions.
Underlying Concepts
Heikin Ashi Smoothing: Standard price candles can produce erratic signals due to wicks and short-term volatility. This script includes a "Calculation Mode" setting that allows the Gann logic to run on Heikin Ashi average prices. This smoothes out price data, helping traders stay in trends longer by ignoring temporary pullbacks.
Gann High-Low Logic: The core algorithm tracks the Simple Moving Average (SMA) of Highs and Lows over a user-defined period.
Bullish Trend: Price closes above the trailing SMA of Highs.
Bearish Trend: Price closes below the trailing SMA of Lows.
Volatility & Trend Filtering: To reduce false signals during sideways markets, this tool employs two filters:
ADX Filter (Choppiness): Uses the Average Directional Index to detect low-volatility environments. If the ADX is below the defined threshold (default 20), the indicator identifies the market as "choppy" and suppresses signals to preserve capital.
EMA Filter (Baseline): An optional Exponential Moving Average filter ensures trades are only taken in the direction of the longer-term trend (e.g., Longs only above the 200 EMA).
Features
Dual Calculation Modes: Switch between Standard price logic and Heikin Ashi smoothing logic.
Multi-Timeframe (MTF): Calculate the trend based on a higher timeframe (e.g., 4-Hour) while viewing a lower timeframe chart (e.g., 15-Minute).
Automated JSON Alerts: Generates machine-readable JSON alert payloads compatible with external trading bots and webhooks.
Live Dashboard: A data table displaying the current Trend State, Calculation Mode, ADX Value, and risk percentage.
How to Use
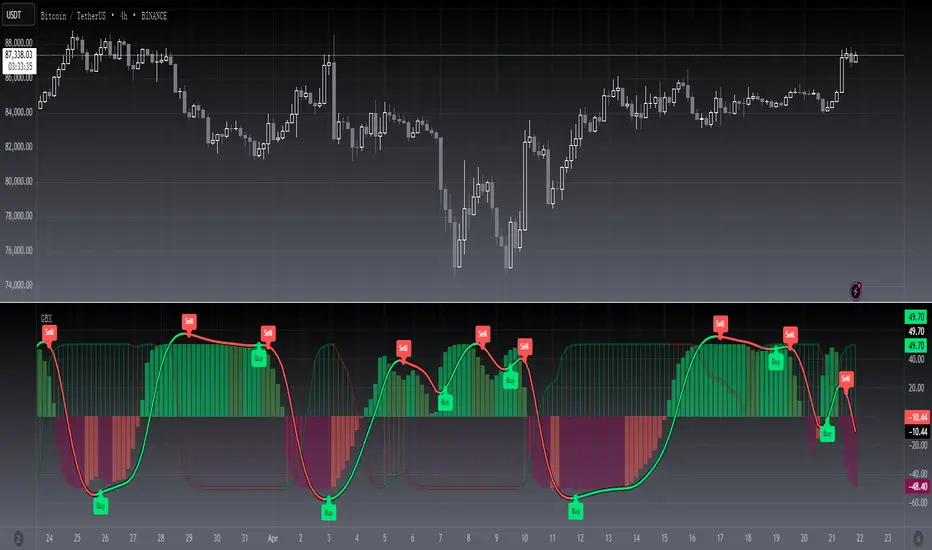
Buy Signal: Generated when the trend flips Bullish, provided the ADX indicates sufficient momentum and the price satisfies the EMA filter (if enabled).
Sell Signal: Generated when the trend flips Bearish, subject to the same momentum and trend filters.
Neutral State (Gray Cloud): When the cloud fill turns gray, the market is in consolidation. It is recommended to avoid entering new positions during this state.
Trailing Stop: The Gann Line serves as a dynamic trailing stop-loss level. A close beyond this line invalidates the current trend.
Settings Configuration
Calculation Mode: Select "Standard" for raw price action or "Heikin Ashi" for smoothed trend following.
Gann Length: Lower values (3-5) are suitable for short-term scalping; higher values (10+) are better for swing trading.
MTF Mode: Enable to lock the calculation to a specific higher timeframe.
ADX Threshold: Adjust based on asset volatility. Recommended: 20-25 for Crypto, 15-20 for Forex/Indices.
Disclaimer
This source code and the information presented here are for educational purposes only. This script does not constitute financial advice, trading recommendations, or a solicitation to buy or sell any financial instruments. Trading in financial markets involves a high degree of risk and may not be suitable for all investors. Past performance is not indicative of future results. The author assumes no responsibility for any losses incurred while using this indicator. Use this tool at your own discretion and risk.
Chỉ báo Pine Script®