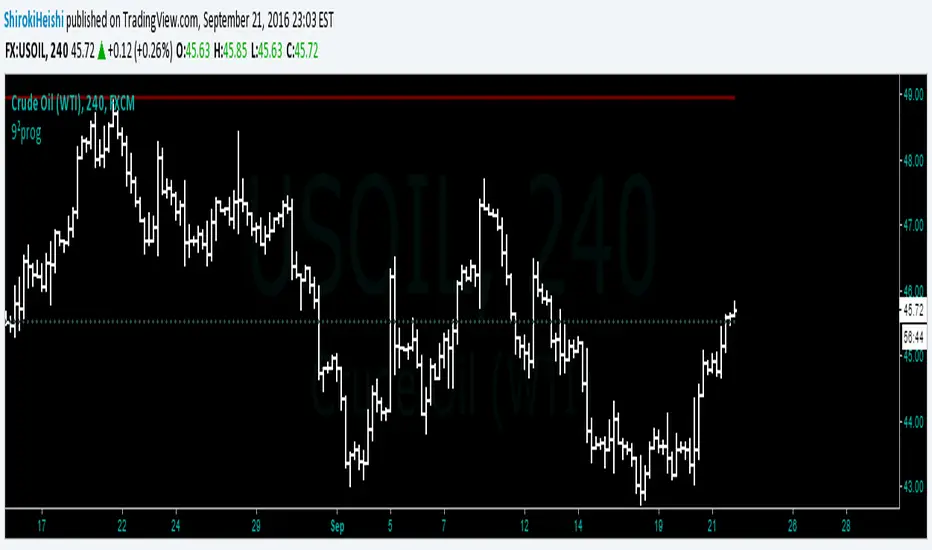
Gann ProgressionsThis is my attempt at progressions along the Gann wheel. Theoretically this script advances a numeral 45 degrees along the square of nine. The degree chosen (negative for bearish projections) can of course be customized and further subdivided as per your needs, but there is a slight flaw in the calculations that I am asking the community to take a look at, hopefully you all can give me a hand here. While the majority of the figures are correct, there seems to be some very slight discrepancies in the prices projected. If you are a Gann user, then you know how accurate they can be and as such, the discrepancies are not tolerable. Take a peek and let me know what you see that I am missing. Hope this script becomes helpful for all users.
Tìm kiếm tập lệnh với "gann"
GANN Friday RulesFriday Rules Indicator Description
Purpose:
The Friday Rules indicator identifies and marks specific Friday candlestick patterns based on
weekly price action and candle body-to-wick relationships.
How it Works:
The indicator tracks the weekly high and low from Monday to Friday, then analyzes Friday's
candle to determine its significance and body/wick characteristics.
Signal Types:
🟢 Green F ▲ - Strong Bullish Friday
- Friday makes the weekly high
- Body closes within 1% of the high (minimal upper wick)
- Indicates strong buying pressure with little rejection
🟡 Yellow F ▲ - Weak Bullish Friday
- Friday makes the weekly high
- Body does NOT close near the high (significant upper wick)
- Shows buying interest but with selling pressure/rejection at highs
🔴 Red F ▼ - Strong Bearish Friday
- Friday makes the weekly low
- Body closes within 1% of the low (minimal lower wick)
- Indicates strong selling pressure with little support
🟠 Orange F ▼ - Weak Bearish Friday
- Friday makes the weekly low
- Body does NOT close near the low (significant lower wick)
- Shows selling pressure but with buying support at lows
⚪ White F - Neutral Friday
- Friday does not make weekly high or low
- Regular Friday with no extreme weekly price action
Key Features:
- Resets weekly tracking every Monday
- All signals positioned above the candle for clean visibility
- Arrow direction indicates bullish (▲) vs bearish (▼) bias
- Color coding shows strength: Green/Red = strong, Yellow/Orange = weak, White = neutral
Usage:
Use this indicator to identify significant Friday price action that may influence next week's
trading, weekend sentiment, and weekly closing patterns.

Gann Percentage SureshCalculates the Gann percentages from covid lows to find the future Supports and resistance Levels
Swing PVT ForecastИндикатор Swing PVT Forecast предназначен для построения целевых и коррекционных зон к выбранному свингу. Пользователь вручную указывает свинг — High (точка A) и Low (точка B). На основе разницы цены и времени между ними - строятся зоны продолжения (Target Levels) и зоны коррекции (Correction Levels), рассчитанные на основании синтеза методик Ганна, Коуэна и Хержика.
----------------------------------------------------------------------------------------------------------------------
The Swing PVT Forecast indicator is designed to plot target and correction zones for a selected swing. The user manually specifies the swing — High (point A) and Low (point B). Based on the price&time difference between them, the indicator builds continuation zones (Target Levels) and correction zones (Correction Levels), calculated using a synthesis of the methods of Gann, Cowan, and Herzik.

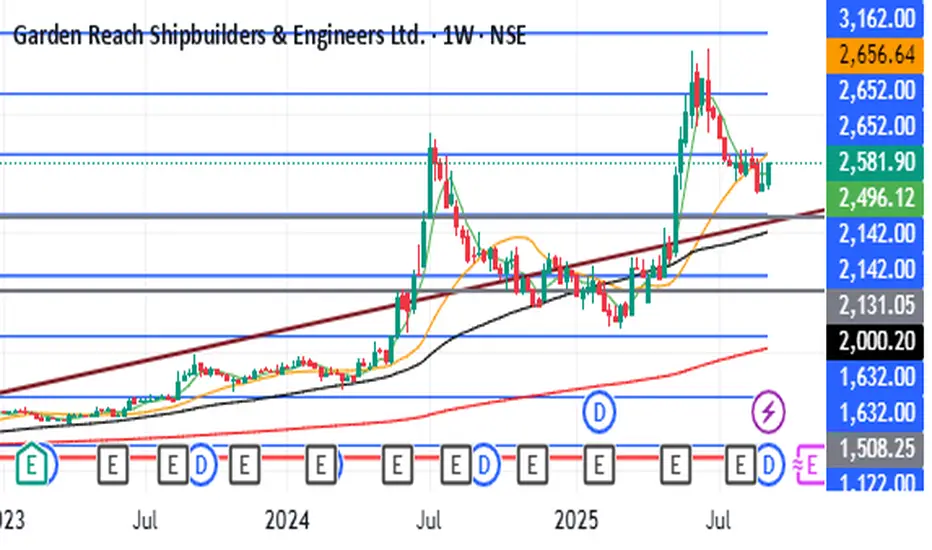
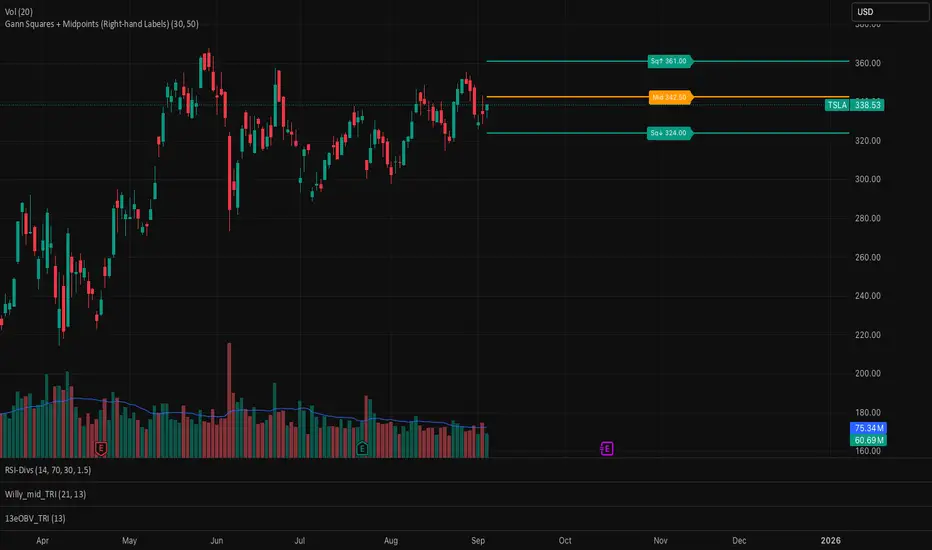
Gann Squares + Midpoints It gives Gann Square and a midpoint closest to the price which act as support and resistance
THOT_GANNThis indicator is based on wd Gann square of 9 levels
i added 3 ema 50 100 and 200 to follow a right trend
also i added VWAP to understand buyer is aggressive or seller.
now study all together we can trade on breakout and reversal.

gann fib levelsDescription of gann fib Levels
Input Value Level:
Purpose: This level is the starting point for calculating support and resistance. Users can input a specific high or low price value that serves as the foundation for subsequent calculations.
Visual Representation: A bold blue line indicates this level prominently on the chart, making it easy to identify. Additionally, a horizontal magenta line provides a reference to this initial price level.
Support Levels:
Definition: Support levels are price points where a downtrend can be expected to pause due to buying interest. They act as a floor that prevents the price from falling further.
Calculation: Support levels are derived by calculating the square root of the input value, adjusting it downward by a defined step (0.25), and squaring the result to find potential support points.
Visual Representation: Each support level is plotted with a red line when the current price is below the support level and changes to green when the price is above it. Every fourth support level is depicted with a bolder line for emphasis.
Resistance Levels:
Definition: Resistance levels are price points where an uptrend can be expected to pause due to selling interest. They serve as a ceiling that prevents the price from rising further.
Calculation: Resistance levels are calculated similarly to support levels, using the square root of the input value but adjusting it upward by the defined step (0.25) before squaring the result.
Visual Representation: Each resistance level is plotted with a green line when the current price is below the resistance level and turns red when the price is above it. Like support levels, every fourth resistance line is bolded for easier identification.
Dynamic Behavior:
Crossing Logic: When the current market price crosses above a resistance level, that level transforms into a support level, effectively changing its role. Conversely, if the price crosses below a support level, it transforms into a resistance level. This dynamic behavior reflects real-time market sentiment and helps traders identify potential reversal points.
Summary
This Pine Script provides a visual representation of dynamic support and resistance levels based on a user-defined input price. With distinct color coding and bold lines for significant levels, traders can quickly assess market conditions, identify potential buy or sell signals, and make informed trading decisions. The system's adaptability allows it to reflect the latest market movements, enhancing its utility as a trading tool.


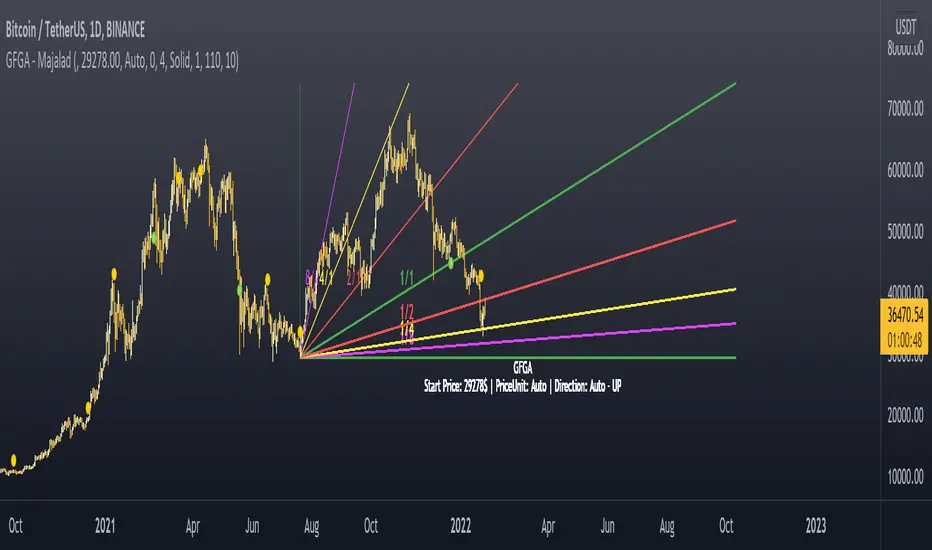
Gann Fan Geometric Angles - majalad
Market geometry is one of the very interesting topics that was talked about by W.D. Gann and many others. The problem with today's charting software is that they lack the concept of scaling and geometry drawing. This fan is different from other fanns as it accounts for that missing peice and really uses the 1 price point per 1 time point concept.
Once this script is added to your chart, it will try to calculate a price per point value and draw your fann geometrically using this price per point value. You will also have the option to defin the proper price per point value for your instrument, if you want to.
How to use
Once you add the script, you will need to select a starting point for your fann
The script will calculate the price per point and the trend direction for you automatically.
If needed, you can change the price per point and the direction from the settings.
Please PM me for access or for any question.
Gann Square Top Bottom - majalad
Price and Time squaring is one of the main concepts that W.D. Gann introduced and talked about in his books. This script uses those techniques to Square a Top or Bottom that you specify on the chart.
You can also choose to square based on the price, price squared or square root of the price with a lot of customization and coloring options. You have the overall control to change any part of the script including lines colors, style, thickness, fill colors and so on.
Please note that although the script tries to set the direction and the price per point automatically for you, sometimes for very fast or very slow instruments you will need to define the price per point for the instrument that you are dealing with.
How to use
Once you add the script, you will need to select the top or bottom that you want to square
The script will calculate the price per point and the trend direction for you automatically.
If needed, you can change the price per point and the direction from the settings.
You can also select to add multiple boxes for the same squared range
Please PM me for access or for any question.

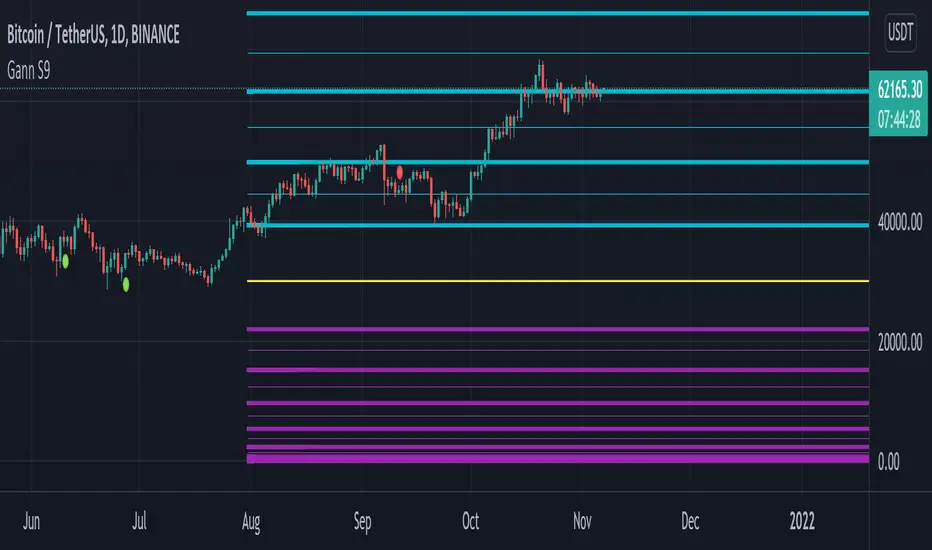
Gann Square of 9 LevelsThis indicator is designed based on Mr. WD Gann's square of nine methods.
Using this indicator, we can enter the desired pivot price and, based on the coefficient we assign to it, extract 8 support and resistance numbers with 8 angles of 45, 90, 135, 180, 225, 270, 315, and 360.
Calculates 8 support and resistance points and draws support and resistance lines.
The coefficient is to triple the number of executions.
To select pivot points in which a price is a large number, by selecting coefficients of 0.1, 0.01, 0.001, and 0.0001, we can have support and resistance points appropriate to the time frame.
For example, the price of Bitcoin, which was 64,854 on April 14, 2021, can be used to perform three-digit calculations by selecting a coefficient of 0.0001.
To select pivot points whose price is a small number, by selecting coefficients higher than 10, 100, 1000, and 10000, we can have support and resistance points appropriate to the time frame.
For example, the price of Dodge coin, which was 0.7399 on May 8, 2021, we can perform three-digit calculations by selecting a coefficient of 100 indicators.
Gann HiLo Activator [CC]The HiLo Activator was created by W.D. Gann and I was surprised to not see more of his technical indicators on here. I will start adding more of his indicators on here if I get more interest. This is the original version of the indicator that performs like a trailing stop that also works well as a trend line. Buy when the line turns green and sell when it turns red.
Let me know if there are any other indicators you want me to publish!

Gann By Day Trader AHTHIS INDICATOR IS ONLY FOR EDUCATIONAL PURPOSE AND THE ORIGINAL CONTENT IS THE PROPERTY OF DAY TRADER AH AND MR. SAVAN AGRAVAT {THE CREATOR}. AND THE CREATOR OF THE INDICATOR IS DATA TRADER.
THIS IS ONLY APPLICABLE TO THE STOCKS OF HIGHER VALUES AND IN INDICES.
How to use the indicator.
In the input option, check in the large stocks section, if the stock price is more than 1500.
In the input option, check in the small stocks section, if the stock price is less than 1500.
NO CHANGES TO BE MADE WITH THE PERIOD.
While making the position please do refer to Gann Levels as well.
the levels labelled as AB, CB , EB... stands for breakout levels (these are dynamic support and resistance levels)
the levels labelled as BR, DR, FR... stands for reversal levels.
rest how to use the levels and how to trade based on them will be soon explained with a video.
Thank You and Happy Trading.
All the best.
DAY TRADER AH

Gann AnglesThis script help you to draw, from the most important Low or High, 4 Gann angles.
The angles are based on the following time factors:
- Daily
- Calendar
- Weekly
- Monthly
What you have to do it is only insert :
- Start date: you must identify the Low/High. Remember to insert date -1 and 00:00 as time
- End date: I suggest you to insert a very far date in the future
- Start Price: High price or Low price
- ANGLES
1X1:
2X1:
4X1.
In the attached example you can see the daily time factor worked pretty well
17x1
34x1
68x1
angles. The next one 17x2 ?

Gann Intraday 5 min hello traders,
this is a script or indicator to use for intraday Trading time frame 5 min ,(less than 15 Min) else it may give wrong signal
i made this using gann ,ema & sma
i am hiding script codes as some may copy to sell it ,
back test it and then use
Note :- rules for trading
1 - price need to come from black background and close above both the lines
2 - to buy price need to close above small line and place above that canndle
3- to sell do invert for 2nd point
to filter it out can use vwap
any suggestion welcome i will update if i found your suggestion worthy
thanks happy trading
vikhyat

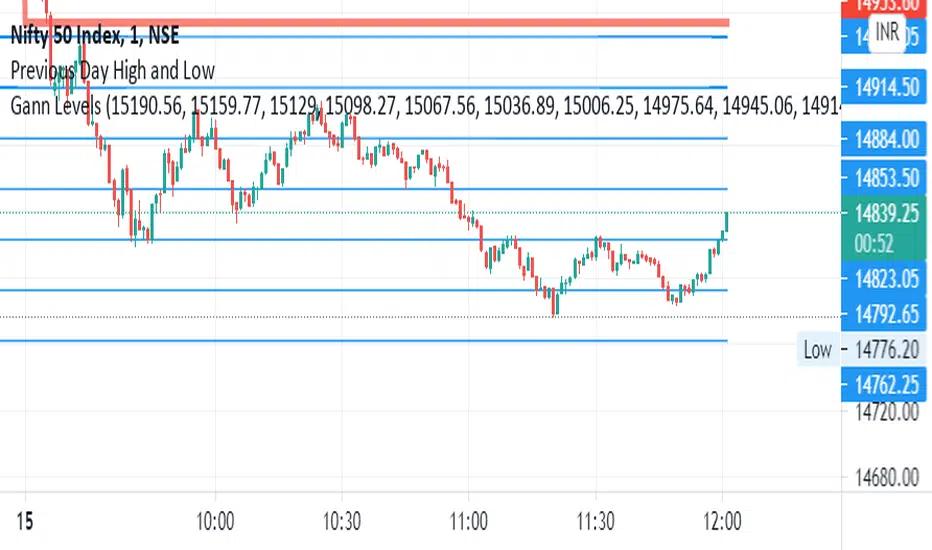
Gann Angles With VolatilityThis script will calculate the intraday levels using Gann angles and volatility principle.


Gann Trend OscillatorDeveloped by Robert Krausz, the Gann Trend Oscillator is a trend-following indicator used to determine the financial instruments long-term price direction.

Gann Lines2.14Plots gann sq9, sq12, and fiblines on the chart. only plots those lines immediately above and below current price.
Input high or low pivot and indicate if you want to plot upwards or downwards from that pivot...

Gann GridA script to draw Gann Grid given Cycle start point, Cycle space (size), Cycle type ( Bullish / Bearish ), Cycle shape, Time levels space and Grid size
The lines are customizable you can change their style and color
When you increase the size you may see that the Grids at the beginning are getting removed, that's pretty normal because TradingView has a limit of 55 line per indicator you won't need the old grids anyway but if you want you can decrease the size and they will show again
My Telegram :- @Kirolos_T


