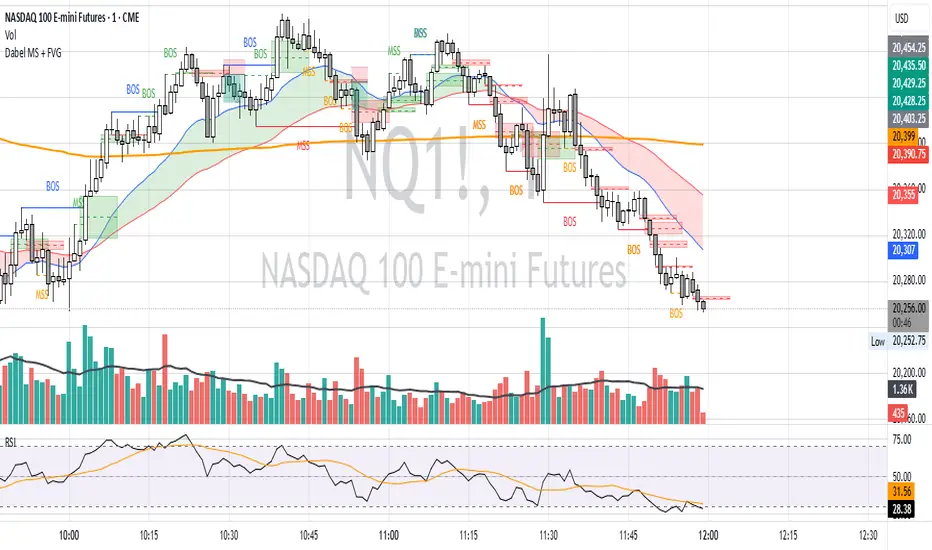
Dabel MS + FVGThis script is designed to assist traders by identifying market structures, imbalances, and potential trade opportunities using Break of Structure (BOS) and Market Structure Shifts (MSS). It visually highlights imbalances in price action, key pivots, and market structure changes, providing actionable information for making trading decisions.
Key features:
Imbalances Detection: Highlights bullish and bearish price gaps (Fair Value Gaps) using colored boxes. Users can choose the line style (solid, dashed, or dotted) for imbalance midlines.
Market Structure Analysis: Tracks pivot highs and lows to identify BOS and MSS in two separate market structures with adjustable pivot strengths.
Customizable Visualization: Allows users to choose line styles, colors, and display options for both imbalances and market structures.
Alerts: Alerts traders when BOS or MSS occur, helping to monitor the market effectively.
Trading Strategy
Imbalance Trading:
Imbalances (gaps) represent areas where supply or demand was left unfilled. These gaps often act as magnet zones where the price revisits to fill.
Bullish Imbalance: Look for buying opportunities when price enters a green imbalance zone.
Bearish Imbalance: Look for selling opportunities when price enters a red imbalance zone.
Use the midline of the imbalance box as a key reference point for potential reversals.
Break of Structure (BOS) and Market Structure Shift (MSS):
BOS: Indicates a continuation of the existing trend. For example:
Bullish BOS: Look for continuation in the uptrend after a high is broken.
Bearish BOS: Look for continuation in the downtrend after a low is broken.
MSS: Suggests a potential reversal in market structure. For example:
Bullish MSS: Indicates a possible shift from a bearish to bullish market.
Bearish MSS: Indicates a potential shift from a bullish to bearish market.
Multiple Market Structures:
This script provide two sets of market structures, allowing traders to compare short-term and long-term trends.
Adjust the pivot strength to suit your trading style (lower for intraday trading, higher for swing or positional trading).
Entry and Exit:
Entry: Look for entries near imbalances or after confirmed BOS/MSS in line with the overall trend.
Exit: Place stop-loss below/above recent pivots and take profit at nearby support/resistance or imbalance zones.
For New Traders
Focus on Basics: Understand what BOS and MSS mean and how they signal trend direction or reversals.
Use Alerts: Rely on the script's alert system to catch important moments without staring at charts all day.
Start Small: Test this strategy on a demo account before using it live. You can understand it more with practice.
Tìm kiếm tập lệnh với "gaps"
FVG Detector (Gholam version)The Fair Value Gap (FVG) Detector is a powerful tool designed to identify and highlight potential imbalance areas in the market. Fair Value Gaps, also known as "FVG" or "Liquidity Gaps," are price ranges where there has been little or no trading activity. These gaps can often act as key levels of support or resistance and may represent areas where price is likely to return to for a fill, providing potential trading opportunities.
This indicator automatically scans and marks these gaps on the chart, helping traders quickly spot areas of interest for potential reversals or continuation patterns.

FVG Breakout/BreakdownThe FVG Breakout/Breakdown indicator is designed to identify potential breakout and breakdown opportunities in the market, based on the concept of Fair Value Gaps (FVGs). FVGs are areas where price moves too quickly, leaving behind gaps between candlesticks, often seen as areas of inefficiency or imbalance that the market tends to revisit.
Key Concepts:
Fair Value Gaps (FVG):
FVG occurs when a price gap is created between candlesticks, typically when the high of one candle is lower than the low of the previous candle (for a bearish FVG) or the low of one candle is higher than the high of the previous candle (for a bullish FVG).
These gaps represent an imbalance between buying and selling pressure, and the market often revisits them, making them valuable for identifying potential entry points.
Bullish FVG: This occurs when the low of the current candle is higher than the high of the previous candle.
Condition: low > high
Bearish FVG: This occurs when the high of the current candle is lower than the low of the previous candle.
Condition: high < low
Breakout/Breakdown Signals:
Breakout: A bullish breakout signal occurs when the price breaks above a defined resistance level after an FVG gap. This suggests that the market may continue moving higher.
Breakdown: A bearish breakdown signal occurs when the price breaks below a defined support level after an FVG gap. This suggests that the market may continue moving lower.
NWOG (New Week Opening Gap):
The NWOG can be used as an additional factor to confirm the FVG signal. The gap between Friday's close and Monday's open is a crucial level for identifying the start of a new move for the week.
NWOG helps to further refine the timing of breakout or breakdown signals, only triggering them when price moves relative to the Monday Open and shows a new direction.
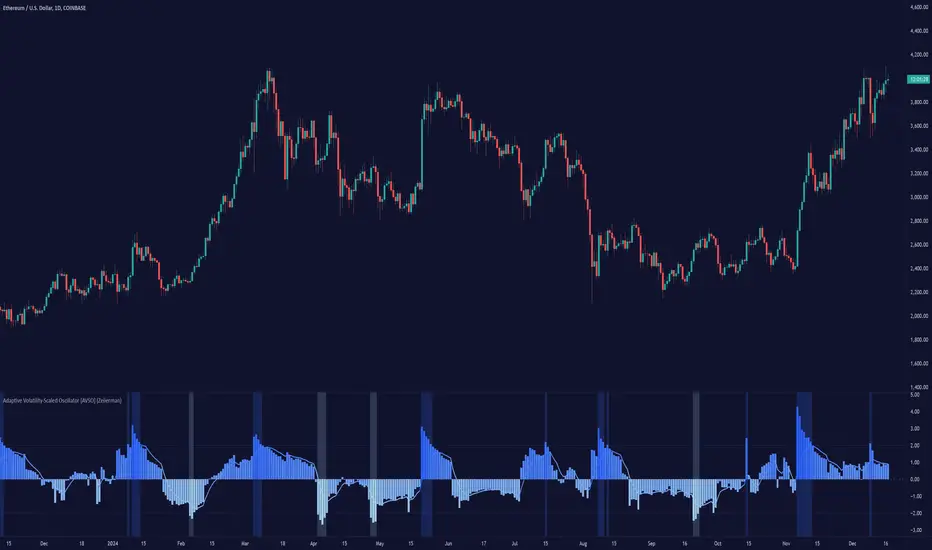
Adaptive Volatility-Scaled Oscillator [AVSO] (Zeiierman)█ Overview
The Adaptive Volatility-Scaled Oscillator (AVSO) is a dynamic trading indicator that measures and visualizes volatility-adjusted market behavior. By scaling various metrics (such as volume, price changes, standard deviation, ATR, and Yang-Zhang volatility) and applying adaptive smoothing, AVSO helps traders identify market conditions where volatility deviates significantly from the norm.
This indicator uses standardized scaling (Z-Score logic) to highlight periods of abnormally high or low volatility relative to recent history. With gradient coloring and clear volatility zones, AVSO provides a visually intuitive way to analyze market volatility and adapt trading strategies accordingly.
█ How It Works
⚪ Scaling Metrics: The indicator scales user-selected metrics (e.g., volume, ATR, standard deviation) relative to the market and price, providing a standardized volatility measure.
⚪ Z-Score Standardization: The scaled metric is normalized using a Z-Score to measure how far current volatility deviates from its recent mean.
Positive Z-Score: Above-average volatility.
Negative Z-Score: Below-average volatility.
⚪ Adaptive Smoothing: An Adaptive EMA smooths the Z-Score, dynamically adjusting its length based on the strength of the volatility. Stronger deviations result in shorter smoothing, increasing responsiveness.
█ Unique Feature: Yang-Zhang Volatility
The Yang-Zhang volatility estimator sets this indicator apart by providing a more robust and accurate measure of volatility compared to traditional methods like ATR or standard deviation.
⚪ What Makes Yang-Zhang Volatility Unique?
Comprehensive Calculation: It combines overnight price gaps (log returns from the previous close to the current open) and intraday price movements (high, low, and close).
Accurate for Gapped Markets: Traditional volatility measures can misrepresent price movement when significant gaps occur between sessions. Yang-Zhang accounts for these gaps, making it highly reliable for assets prone to overnight price jumps, such as stocks, cryptocurrencies, and futures.
Adaptable to Real Market Conditions : By including both close-to-open returns and intraday volatility, it provides a balanced and adaptive measure that captures the full volatility picture.
⚪ Why This Matters to Traders
Better Volatility Insights: Yang-Zhang offers a clearer view of true market volatility, especially in markets with price gaps or uneven trading sessions.
Improved Trade Timing: By identifying volatility spikes and calm periods more effectively, traders can time their entries and exits with greater confidence.
█ How to Use
Identify High and Low Volatility
A high Z-Score (>2) indicates significant market volatility. This can signal momentum-driven moves, breakouts, or areas of increased risk.
A low Z-Score (<-2) suggests low volatility or a calm market environment. This often occurs before a potential breakout or reversal.
Trade Signals
High Volatility Zones (background highlight): Monitor for potential breakouts, trend continuations, or reversals.
Low Volatility Zones: Anticipate range-bound conditions or upcoming volatility spikes.
█ Settings
Source: Select the price source for scaling calculations (close, high, low, open).
Metric Measure: Choose the volatility measure:
Volume: Scales raw volume.
Close: Uses closing price changes.
Standard Deviation: Price dispersion.
ATR: Average True Range.
Yang: Yang-Zhang volatility estimate.
Bars to Analyze: Number of historical bars used to calculate the mean and standard deviation of the scaled metric.
ATR / Standard Deviation Period: Lookback period for ATR or Standard Deviation calculation.
Yang Volatility Period: Period for the Yang-Zhang volatility estimator.
Smoothing Period: Base smoothing length for the adaptive smoothing line.
-----------------
Disclaimer
The information contained in my Scripts/Indicators/Ideas/Algos/Systems does not constitute financial advice or a solicitation to buy or sell any securities of any type. I will not accept liability for any loss or damage, including without limitation any loss of profit, which may arise directly or indirectly from the use of or reliance on such information.
All investments involve risk, and the past performance of a security, industry, sector, market, financial product, trading strategy, backtest, or individual's trading does not guarantee future results or returns. Investors are fully responsible for any investment decisions they make. Such decisions should be based solely on an evaluation of their financial circumstances, investment objectives, risk tolerance, and liquidity needs.
My Scripts/Indicators/Ideas/Algos/Systems are only for educational purposes!
XAUUSD Weekly Gap Indicator (oberlunar)The XAUUSD Weekly Gap Indicator is a technical tool designed specifically for tracking weekly price gaps in the XAUUSD (gold) market. It identifies and visualizes the price difference between the Friday close and the Monday open, providing valuable insights into market dynamics over the weekend.
Gap Detection:
Measures the price difference between Friday's closing price and Monday's opening price.
Highlights whether the gap is bullish (Monday opens above Friday’s close) or bearish (Monday opens below Friday’s close).
Visualization:
Draws a line or rectangle to connect the Friday close and the Monday open, clearly marking the gap on the chart.
Displays an indicator label with the gap value, often in pips or points, to quantify the gap size.
Color Coding:
Green: Bullish gap (positive price movement).
Red: Bearish gap (negative price movement).
Market Sentiment:
Large gaps can indicate significant market sentiment shifts due to weekend events, such as economic reports or geopolitical news.
Support and Resistance:
Weekly gaps often act as temporary support or resistance levels, as the market may attempt to revisit or "fill" the gap.
Trading Strategies:
Gap Filling: XAUUSD often tends to "fill" these gaps, providing trading opportunities.
Continuation or Reversal: The reaction to the gap can signal whether the trend is likely to continue or reverse.

Custom V2 KillZone US / FVG / EMAThis indicator is designed for traders looking to analyze liquidity levels, opportunity zones, and the underlying trend across different trading sessions. Inspired by the ICT methodology, this tool combines analysis of Exponential Moving Averages (EMA), session management, and Fair Value Gap (FVG) detection to provide a structured and disciplined approach to trading effectively.
Indicator Features
Identifying the Underlying Trend with Two EMAs
The indicator uses two EMAs on different, customizable timeframes to define the underlying trend:
EMA1 (default set to a daily timeframe): Represents the primary underlying trend.
EMA2 (default set to a 4-hour timeframe): Helps identify secondary corrections or impulses within the main trend.
These two EMAs allow traders to stay aligned with the market trend by prioritizing trades in the direction of the moving averages. For example, if prices are above both EMAs, the trend is bullish, and long trades are favored.
Analysis of Market Sessions
The indicator divides the day into key trading sessions:
Asian Session
London Session
US Pre-Open Session
Liquidity Kill Session
US Kill Zone Session
Each session is represented by high and low zones as well as mid-lines, allowing traders to visualize liquidity levels reached during these periods. Tracking the price levels in different sessions helps determine whether liquidity levels have been "swept" (taken) or not, which is essential for ICT methodology.
Liquidity Signal ("OK" or "STOP")
A specific signal appears at the end of the "Liquidity Kill" session (just before the "US Kill Zone" session):
"OK" Signal: Indicates that liquidity conditions are favorable for trading the "US Kill Zone" session. This means that liquidity levels have been swept in previous sessions (Asian, London, US Pre-Open), and the market is ready for an opportunity.
"STOP" Signal: Indicates that it is not favorable to trade the "US Kill Zone" session, as certain liquidity conditions have not been met.
The "OK" or "STOP" signal is based on an analysis of the high and low levels from previous sessions, allowing traders to ensure that significant liquidity zones have been reached before considering positions in the "Kill Zone".
Detection of Fair Value Gaps (FVG) in the US Kill Zone Session
When an "OK" signal is displayed, the indicator identifies Fair Value Gaps (FVG) during the "US Kill Zone" session. These FVGs are areas where price may return to fill an "imbalance" in the market, making them potential entry points.
Bullish FVG: Detected when there is a bullish imbalance, providing a buying opportunity if conditions align with the underlying trend.
Bearish FVG: Detected when there is a bearish imbalance, providing a selling opportunity in the trend direction.
FVG detection aligns with the ICT Silver Bullet methodology, where these imbalance zones serve as probable entry points during the "US Kill Zone".
How to Use This Indicator
Check the Underlying Trend
Before trading, observe the two EMAs (daily and 4-hour) to understand the general market trend. Trades will be prioritized in the direction indicated by these EMAs.
Monitor Liquidity Signals After the Asian, London, and US Pre-Open Sessions
The high and low levels of each session help determine if liquidity has already been swept in these areas. At the end of the "Liquidity Kill" session, an "OK" or "STOP" label will appear:
"OK" means you can look for trading opportunities in the "US Kill Zone" session.
"STOP" means it is preferable not to take trades in the "US Kill Zone" session.
Look for Opportunities in the US Kill Zone if the Signal is "OK"
When the "OK" label is present, focus on the "US Kill Zone" session. Use the Fair Value Gaps (FVG) as potential entry points for trades based on the ICT methodology. The identified FVGs will appear as colored boxes (bullish or bearish) during this session.
Use ICT Methodology to Manage Your Trades
Follow the FVGs as potential reversal zones in the direction of the trend, and manage your positions according to your personal strategy and the rules of the ICT Silver Bullet method.
Customizable Settings
The indicator includes several customization options to suit the trader's preferences:
EMA: Length, source (close, open, etc.), and timeframe.
Market Sessions: Ability to enable or disable each session, with color and line width settings.
Liquidity Signals: Customization of colors for the "OK" and "STOP" labels.
FVG: Option to display FVGs or not, with customizable colors for bullish and bearish FVGs, and the number of bars for FVG extension.
-------------------------------------------------------------------------------------------------------------
Cet indicateur est conçu pour les traders souhaitant analyser les niveaux de liquidité, les zones d’opportunité, et la tendance de fond à travers différentes sessions de trading. Inspiré de la méthodologie ICT, cet outil combine l'analyse des moyennes mobiles exponentielles (EMA), la gestion des sessions de marché, et la détection des Fair Value Gaps (FVG), afin de fournir une approche structurée et disciplinée pour trader efficacement.

FVG Price & Volume Graph [LuxAlgo]The FVG Price & Volume Graph tool plot recently detected fair value gaps relative to the volume traded within their area during their formation. This allows us to effectively visualize significant fair value gaps caused by high liquidity.
The indicator also returns levels from the fair value gaps areas average with the highest associated volume.
Do note that the indicator can consider the chart's visible range when being computed, which will recalculate the indicator when the chart's visible range changes.
🔶 USAGE
Fair Value Gaps (FVG) are core price action concepts occurring when the disparity between supply and demand is significant. Price has a tendency to come back to those areas and mitigating them, that is filling them.
The provided tools allow for effective visualization of both FVG's area's height as well as the volume originating from their creation, which is defined by the total traded volume located within the FVG during its creation. FVG's with more associated volume are displayed to the rightmost of the chart.
Users can determine the amount of most recent FVG's to display from the "Display Amount" setting. Disabling the "Consider Mitigation" setting will return mitigated FVGs in the plot, which can be useful to know where most FVGs were located.
We can use the area average of the FVGs with the most associated volume as potential support/resistance levels. Users can extend more FVG's averages by increasing the "Highest Volume Averages" setting.
🔹 Visualizing Volume/Price Relationships of FVG's
A linear regression is fit between FVG's areas average and their associated volume, with this linear regression helping us see where FVG's with specific volume might be located in the future based on existing FVG's.
Note that FVG's do not tend to exhibit linear relationships with their associated volume, the provided linear regression can give a general sense of tendency, but nothing necessarily accurate.
🔶 DETAILS
🔹 Intrabar Data TF
Given a formation of three candles causing an FVG, the volume traded within that FVG area is obtained by looking at the lower timeframe intrabar candles located within the intermediary candle of the formation. The volume of the intrabar candles located within the FVG areas is added up to obtain the associated volume of the FVG.
Using a lower "Intrabar Data TF" allows obtaining more precise volume results, at the cost of computation time and data availability (if there is a high difference between the "Intrabar Data TF" and the chart TF then less FVG can have their associated volume calculated due to Tradingview limitations).
🔹 Display
Users have access to multiple graphical settings affecting how the indicator is displayed.
The "Graph Resolution" setting determines the length of the X axis, with higher values returning more precise results on the location of FVGs over the X axis. Users can also control the number of labels displayed on the X-axis using the numerical input to the right of "Show X-Axis Labels".
Additionally, users can color FVG areas using a gradient relative to the size of the area, or the volume associated with the FVG.
🔶 SETTINGS
Display Amount: Amount of most recent FVGs to display.
Highest Volume Averages: Amount of FVG averages levels with the highest volume to display and extend.
Consider Mitigation: Only display unmitigated FVGs.
Filter FVGs Outside Visible Range: Only display FVGs areas that are located within the user chart visible range.
Intrabar Data TF: Timeframe used to obtain intrabar data. Should be lower than the user chart timeframe.

FVG Instantaneous Mitigation Signals [LuxAlgo]The FVG Instantaneous Mitigation Signals indicator detects and highlights "instantaneously" mitigated fair value gaps (FVG), that is FVGs that get mitigated one bar after their creation, returning signals upon mitigation.
Take profit/stop loss areas, as well as a trailing stop loss are also included to complement the signals.
🔶 USAGE
Instantaneous Fair Value Gap mitigation is a new concept introduced in this script and refers to the event of price mitigating a fair value gap one bar after its creation.
The resulting signal sentiment is opposite to the bias of the mitigated fair value gap. As such an instantaneously mitigated bearish FGV results in a bullish signal, while an instantaneously mitigated bullish FGV results in a bearish signal.
Fair value gap areas subject to instantaneous mitigation are highlighted alongside their average level, this level is extended until reached in a direction opposite to the FVG bias and can be used as a potential support/resistance level.
Users can filter out less volatile fair value gaps using the "FVG Width Filter" setting, with higher values highlighting more volatile fair value gaps subject to instantaneous mitigation.
🔹 TP/SL Areas
Users can enable take-profit/stop-loss areas. These are displayed upon a new signal formation, with an area starting from the mitigated FVG area average to this average plus/minus N ATRs, where N is determined by their respective multiplier settings.
Using a higher multiplier will return more distant areas from the price, requiring longer-term variations to be reached.
🔹 Trailing Stop Loss
A trailing-stop loss is included, increasing when the price makes a new higher high or lower low since the trailing has been set. Using a higher trailing stop multiplier will allow its initial position to be further away from the price, reducing its chances of being hit.
The trailing stop can be reset on "Every Signal", whether they are bullish or bearish, or only on an "Inverse Signal", which will reset the trailing when a signal of opposite bias is detected, this will preserve an existing trailing stop when a new signal of the same bias to the present one is detected.
🔶 DETAILS
Fair Value Gaps are ubiquitous to price action traders. These patterns arise when there exists a disparity between supply and demand. The action of price coming back and filling these imbalance areas is referred to as "mitigation" or "rebalancing".
"Instantaneous mitigation" refers to the event of price quickly mitigating a prior fair value gap, which in the case of this script is one bar after their creation. These events are indicative of a market more attentive to imbalances, and more willing to correct disparities in supply and demand.
If the market is particularly sensitive to imbalances correction then these can be excessively corrected, leading to further imbalances, highlighting a potential feedback process.
🔶 SETTINGS
FVG Width Filter: Filter out FVGs with thinner areas from returning a potential signal.
🔹 TP/SL
TP Area: Enable take-profit areas for new signals.
Multiplier: Control the distance from the take profit and the price, with higher values returning more distant TP's.
SL Area: Enable stop-loss areas for new signals.
Multiplier: Control the distance from the stop loss and the price, with higher values returning more distant SL's.
🔹 Trailing Stop
Reset Trailing Stop: Determines when the trailing stop is reset.
Multiplier: Controls the initial position of the trailing stop, with higher values returning more distant trailing stops.

Precise Gap FinderPrecise Gap Finder
This indicator identifies Fair Value Gaps (FVGs) in price action and it is perfect for traders looking to exploit price imbalances and capitalize on trading opportunities.
How It Works:
The Precise Gap Finder detects Fair Value Gaps by analyzing three consecutive candles. A gap is identified when the middle candle’s price range (open to close) is not overlapped by the high and low prices of the surrounding candles. This indicates a price imbalance, which can be a strong signal for potential market moves.
How to Use for Trading:
Identify Entry Points: Use the highlighted Fair Value Gaps to spot potential entry points. An upward FVG can indicate a potential buying opportunity, while a downward FVG can signal a potential selling opportunity.
Confirm Trends: Combine the FVG signals with other technical indicators to confirm trends and enhance the accuracy of your trades.
Risk Management: Use FVGs to identify potential stop-loss and take-profit levels. Gaps can serve as natural support and resistance levels.
Backtesting: Analyze historical data to understand how FVGs have impacted price movements in the past, helping you refine your trading strategy

Morning & Evening Star [TradingFinder] Stock Indices Gap Candle🔵 Introduction
In "technical analysis", there are certain reversal patterns that alert us to a potential reversal of a stock's previous trajectory.
Two significant patterns in this regard are the "Morning Star" pattern and the "Evening Star" pattern, which are formed by a combination of three different candlesticks and are considered as reversal patterns.
Here, we will examine how to identify these patterns and how to respond to them.
🟣 Morning Star Pattern
This pattern forms at the end of a downtrend and indicates the beginning of an uptrend.
The pattern consists of three candlesticks in the following order :
1.A large bearish candlestick
2.A candlestick with a short body
3.A bullish candlestick
With the formation of the morning star pattern, it is expected that the stock price will change direction and continue to rise. Therefore, in such situations, it is advisable to enter a long position and follow the uptrend.
Signs of the morning star pattern :
•The first sign of this pattern is the presence of a small-bodied candlestick at the end of the trend, accompanied by a gap from the previous candlestick (a bearish candlestick with a large body). Therefore, the bodies of the first and second candlesticks do not overlap.
•The second candlestick indicates market confusion and uncertainty. The color of the middle candlestick is not significant.
•The third candlestick must be positive and have a higher price than the previous candlestick (i.e., the small-bodied candlestick).
•The closing price of the third candlestick must be higher than half of the first candlestick.
🟣 Evening Star Pattern
This pattern forms at the end of an uptrend and indicates the beginning of a downtrend.
The pattern consists of three candlesticks in the following order :
1.A large bullish candlestick
2.A candlestick with a short body
3.A bearish candlestick
With the formation of the evening star pattern, it is expected that the stock price will change direction and continue to fall. Therefore, in such situations where this pattern is identified, it is advisable to refrain from entering a long position.
If the stock is traded in a two-way market, it is possible to profit by taking a short position after the formation of the evening star pattern.
Signs of the evening star pattern :
•The first sign of this pattern is the presence of a small-bodied candlestick at the end of the trend, accompanied by a gap from the previous candlestick (a bullish candlestick with a large body). Therefore, the bodies of the first and second candlesticks do not overlap.
•The second candlestick indicates market confusion and uncertainty. The color of the middle candlestick is not significant.
•The third candlestick must be negative and have a lower price than the previous candlestick (i.e., the small-bodied candlestick).
•The closing price of the third candlestick must be lower than half of the first candlestick.
🔵 How to Use
The "Filter" and "Market" features are available in the settings section, allowing you to customize the output of the indicator according to your needs.
With the "Filter" feature, you can filter the "Morning Star" and "Evening Star" patterns as "strong" or "weak." The difference between strong and weak patterns lies in their "Candle Body."
In strong patterns, the candle bodies account for more than 80% of the total candle range, while in weak patterns, the bodies comprise between 60% to 80% of the candle range.
If the "Filter" feature is set to "On," only strong patterns will be displayed. If it's set to "Off," all patterns will be displayed. By default, it's set to "Off."
The "Market" feature allows you to include "gaps" in your pattern identification calculations. You can choose between "Forex" and "Stock" modes. In the Forex pattern, calculations are performed without considering gaps since there are fewer gaps in the Forex market.
If gap calculations were to be part of the pattern identification conditions, only a very small number of patterns would be identified. However, in the "Stock" mode, gaps are considered as part of the identification conditions.

CNTLibraryLibrary "CNTLibrary"
Custom Functions To Help Code In Pinescript V5
Coded By Christian Nataliano
First Coded In 10/06/2023
Last Edited In 22/06/2023
Huge Shout Out To © ZenAndTheArtOfTrading and his ZenLibrary V5, Some Of The Custom Functions Were Heavily Inspired By Matt's Work & His Pine Script Mastery Course
Another Shout Out To The TradingView's Team Library ta V5
//====================================================================================================================================================
// Custom Indicator Functions
//====================================================================================================================================================
GetKAMA(KAMA_lenght, Fast_KAMA, Slow_KAMA)
Calculates An Adaptive Moving Average Based On Perry J Kaufman's Calculations
Parameters:
KAMA_lenght (int) : Is The KAMA Lenght
Fast_KAMA (int) : Is The KAMA's Fastes Moving Average
Slow_KAMA (int) : Is The KAMA's Slowest Moving Average
Returns: Float Of The KAMA's Current Calculations
GetMovingAverage(Source, Lenght, Type)
Get Custom Moving Averages Values
Parameters:
Source (float) : Of The Moving Average, Defval = close
Lenght (simple int) : Of The Moving Average, Defval = 50
Type (string) : Of The Moving Average, Defval = Exponential Moving Average
Returns: The Moving Average Calculation Based On Its Given Source, Lenght & Calculation Type (Please Call Function On Global Scope)
GetDecimals()
Calculates how many decimals are on the quote price of the current market © ZenAndTheArtOfTrading
Returns: The current decimal places on the market quote price
Truncate(number, decimalPlaces)
Truncates (cuts) excess decimal places © ZenAndTheArtOfTrading
Parameters:
number (float)
decimalPlaces (simple float)
Returns: The given number truncated to the given decimalPlaces
ToWhole(number)
Converts pips into whole numbers © ZenAndTheArtOfTrading
Parameters:
number (float)
Returns: The converted number
ToPips(number)
Converts whole numbers back into pips © ZenAndTheArtOfTrading
Parameters:
number (float)
Returns: The converted number
GetPctChange(value1, value2, lookback)
Gets the percentage change between 2 float values over a given lookback period © ZenAndTheArtOfTrading
Parameters:
value1 (float)
value2 (float)
lookback (int)
BarsAboveMA(lookback, ma)
Counts how many candles are above the MA © ZenAndTheArtOfTrading
Parameters:
lookback (int)
ma (float)
Returns: The bar count of how many recent bars are above the MA
BarsBelowMA(lookback, ma)
Counts how many candles are below the MA © ZenAndTheArtOfTrading
Parameters:
lookback (int)
ma (float)
Returns: The bar count of how many recent bars are below the EMA
BarsCrossedMA(lookback, ma)
Counts how many times the EMA was crossed recently © ZenAndTheArtOfTrading
Parameters:
lookback (int)
ma (float)
Returns: The bar count of how many times price recently crossed the EMA
GetPullbackBarCount(lookback, direction)
Counts how many green & red bars have printed recently (ie. pullback count) © ZenAndTheArtOfTrading
Parameters:
lookback (int)
direction (int)
Returns: The bar count of how many candles have retraced over the given lookback & direction
GetSwingHigh(Lookback, SwingType)
Check If Price Has Made A Recent Swing High
Parameters:
Lookback (int) : Is For The Swing High Lookback Period, Defval = 7
SwingType (int) : Is For The Swing High Type Of Identification, Defval = 1
Returns: A Bool - True If Price Has Made A Recent Swing High
GetSwingLow(Lookback, SwingType)
Check If Price Has Made A Recent Swing Low
Parameters:
Lookback (int) : Is For The Swing Low Lookback Period, Defval = 7
SwingType (int) : Is For The Swing Low Type Of Identification, Defval = 1
Returns: A Bool - True If Price Has Made A Recent Swing Low
//====================================================================================================================================================
// Custom Risk Management Functions
//====================================================================================================================================================
CalculateStopLossLevel(OrderType, Entry, StopLoss)
Calculate StopLoss Level
Parameters:
OrderType (int) : Is To Determine A Long / Short Position, Defval = 1
Entry (float) : Is The Entry Level Of The Order, Defval = na
StopLoss (float) : Is The Custom StopLoss Distance, Defval = 2x ATR Below Close
Returns: Float - The StopLoss Level In Actual Price As A
CalculateStopLossDistance(OrderType, Entry, StopLoss)
Calculate StopLoss Distance In Pips
Parameters:
OrderType (int) : Is To Determine A Long / Short Position, Defval = 1
Entry (float) : Is The Entry Level Of The Order, NEED TO INPUT PARAM
StopLoss (float) : Level Based On Previous Calculation, NEED TO INPUT PARAM
Returns: Float - The StopLoss Value In Pips
CalculateTakeProfitLevel(OrderType, Entry, StopLossDistance, RiskReward)
Calculate TakeProfit Level
Parameters:
OrderType (int) : Is To Determine A Long / Short Position, Defval = 1
Entry (float) : Is The Entry Level Of The Order, Defval = na
StopLossDistance (float)
RiskReward (float)
Returns: Float - The TakeProfit Level In Actual Price
CalculateTakeProfitDistance(OrderType, Entry, TakeProfit)
Get TakeProfit Distance In Pips
Parameters:
OrderType (int) : Is To Determine A Long / Short Position, Defval = 1
Entry (float) : Is The Entry Level Of The Order, NEED TO INPUT PARAM
TakeProfit (float) : Level Based On Previous Calculation, NEED TO INPUT PARAM
Returns: Float - The TakeProfit Value In Pips
CalculateConversionCurrency(AccountCurrency, SymbolCurrency, BaseCurrency)
Get The Conversion Currecny Between Current Account Currency & Current Pair's Quoted Currency (FOR FOREX ONLY)
Parameters:
AccountCurrency (simple string) : Is For The Account Currency Used
SymbolCurrency (simple string) : Is For The Current Symbol Currency (Front Symbol)
BaseCurrency (simple string) : Is For The Current Symbol Base Currency (Back Symbol)
Returns: Tuple Of A Bollean (Convert The Currency ?) And A String (Converted Currency)
CalculateConversionRate(ConvertCurrency, ConversionRate)
Get The Conversion Rate Between Current Account Currency & Current Pair's Quoted Currency (FOR FOREX ONLY)
Parameters:
ConvertCurrency (bool) : Is To Check If The Current Symbol Needs To Be Converted Or Not
ConversionRate (float) : Is The Quoted Price Of The Conversion Currency (Input The request.security Function Here)
Returns: Float Price Of Conversion Rate (If In The Same Currency Than Return Value Will Be 1.0)
LotSize(LotSizeSimple, Balance, Risk, SLDistance, ConversionRate)
Get Current Lot Size
Parameters:
LotSizeSimple (bool) : Is To Toggle Lot Sizing Calculation (Simple Is Good Enough For Stocks & Crypto, Whilst Complex Is For Forex)
Balance (float) : Is For The Current Account Balance To Calculate The Lot Sizing Based Off
Risk (float) : Is For The Current Risk Per Trade To Calculate The Lot Sizing Based Off
SLDistance (float) : Is The Current Position StopLoss Distance From Its Entry Price
ConversionRate (float) : Is The Currency Conversion Rate (Used For Complex Lot Sizing Only)
Returns: Float - Position Size In Units
ToLots(Units)
Converts Units To Lots
Parameters:
Units (float) : Is For How Many Units Need To Be Converted Into Lots (Minimun 1000 Units)
Returns: Float - Position Size In Lots
ToUnits(Lots)
Converts Lots To Units
Parameters:
Lots (float) : Is For How Many Lots Need To Be Converted Into Units (Minimun 0.01 Units)
Returns: Int - Position Size In Units
ToLotsInUnits(Units)
Converts Units To Lots Than Back To Units
Parameters:
Units (float) : Is For How Many Units Need To Be Converted Into Lots (Minimun 1000 Units)
Returns: Float - Position Size In Lots That Were Rounded To Units
ATRTrail(OrderType, SourceType, ATRPeriod, ATRMultiplyer, SwingLookback)
Calculate ATR Trailing Stop
Parameters:
OrderType (int) : Is To Determine A Long / Short Position, Defval = 1
SourceType (int) : Is To Determine Where To Calculate The ATR Trailing From, Defval = close
ATRPeriod (simple int) : Is To Change Its ATR Period, Defval = 20
ATRMultiplyer (float) : Is To Change Its ATR Trailing Distance, Defval = 1
SwingLookback (int) : Is To Change Its Swing HiLo Lookback (Only From Source Type 5), Defval = 7
Returns: Float - Number Of The Current ATR Trailing
DangerZone(WinRate, AvgRRR, Filter)
Calculate Danger Zone Of A Given Strategy
Parameters:
WinRate (float) : Is The Strategy WinRate
AvgRRR (float) : Is The Strategy Avg RRR
Filter (float) : Is The Minimum Profit It Needs To Be Out Of BE Zone, Defval = 3
Returns: Int - Value, 1 If Out Of Danger Zone, 0 If BE, -1 If In Danger Zone
IsQuestionableTrades(TradeTP, TradeSL)
Checks For Questionable Trades (Which Are Trades That Its TP & SL Level Got Hit At The Same Candle)
Parameters:
TradeTP (float) : Is The Trade In Question Take Profit Level
TradeSL (float) : Is The Trade In Question Stop Loss Level
Returns: Bool - True If The Last Trade Was A "Questionable Trade"
//====================================================================================================================================================
// Custom Strategy Functions
//====================================================================================================================================================
OpenLong(EntryID, LotSize, LimitPrice, StopPrice, Comment, CommentValue)
Open A Long Order Based On The Given Params
Parameters:
EntryID (string) : Is The Trade Entry ID, Defval = "Long"
LotSize (float) : Is The Lot Size Of The Trade, Defval = 1
LimitPrice (float) : Is The Limit Order Price To Set The Order At, Defval = Na / Market Order Execution
StopPrice (float) : Is The Stop Order Price To Set The Order At, Defval = Na / Market Order Execution
Comment (string) : Is The Order Comment, Defval = Long Entry Order
CommentValue (string) : Is For Custom Values In The Order Comment, Defval = Na
Returns: Void
OpenShort(EntryID, LotSize, LimitPrice, StopPrice, Comment, CommentValue)
Open A Short Order Based On The Given Params
Parameters:
EntryID (string) : Is The Trade Entry ID, Defval = "Short"
LotSize (float) : Is The Lot Size Of The Trade, Defval = 1
LimitPrice (float) : Is The Limit Order Price To Set The Order At, Defval = Na / Market Order Execution
StopPrice (float) : Is The Stop Order Price To Set The Order At, Defval = Na / Market Order Execution
Comment (string) : Is The Order Comment, Defval = Short Entry Order
CommentValue (string) : Is For Custom Values In The Order Comment, Defval = Na
Returns: Void
TP_SLExit(FromID, TPLevel, SLLevel, PercentageClose, Comment, CommentValue)
Exits Based On Predetermined TP & SL Levels
Parameters:
FromID (string) : Is The Trade ID That The TP & SL Levels Be Palced
TPLevel (float) : Is The Take Profit Level
SLLevel (float) : Is The StopLoss Level
PercentageClose (float) : Is The Amount To Close The Order At (In Percentage) Defval = 100
Comment (string) : Is The Order Comment, Defval = Exit Order
CommentValue (string) : Is For Custom Values In The Order Comment, Defval = Na
Returns: Void
CloseLong(ExitID, PercentageClose, Comment, CommentValue, Instant)
Exits A Long Order Based On A Specified Condition
Parameters:
ExitID (string) : Is The Trade ID That Will Be Closed, Defval = "Long"
PercentageClose (float) : Is The Amount To Close The Order At (In Percentage) Defval = 100
Comment (string) : Is The Order Comment, Defval = Exit Order
CommentValue (string) : Is For Custom Values In The Order Comment, Defval = Na
Instant (bool) : Is For Exit Execution Type, Defval = false
Returns: Void
CloseShort(ExitID, PercentageClose, Comment, CommentValue, Instant)
Exits A Short Order Based On A Specified Condition
Parameters:
ExitID (string) : Is The Trade ID That Will Be Closed, Defval = "Short"
PercentageClose (float) : Is The Amount To Close The Order At (In Percentage) Defval = 100
Comment (string) : Is The Order Comment, Defval = Exit Order
CommentValue (string) : Is For Custom Values In The Order Comment, Defval = Na
Instant (bool) : Is For Exit Execution Type, Defval = false
Returns: Void
BrokerCheck(Broker)
Checks Traded Broker With Current Loaded Chart Broker
Parameters:
Broker (string) : Is The Current Broker That Is Traded
Returns: Bool - True If Current Traded Broker Is Same As Loaded Chart Broker
OpenPC(LicenseID, OrderType, UseLimit, LimitPrice, SymbolPrefix, Symbol, SymbolSuffix, Risk, SL, TP, OrderComment, Spread)
Compiles Given Parameters Into An Alert String Format To Open Trades Using Pine Connector
Parameters:
LicenseID (string) : Is The Users PineConnector LicenseID
OrderType (int) : Is The Desired OrderType To Open
UseLimit (bool) : Is If We Want To Enter The Position At Exactly The Previous Closing Price
LimitPrice (float) : Is The Limit Price Of The Trade (Only For Pending Orders)
SymbolPrefix (string) : Is The Current Symbol Prefix (If Any)
Symbol (string) : Is The Traded Symbol
SymbolSuffix (string) : Is The Current Symbol Suffix (If Any)
Risk (float) : Is The Trade Risk Per Trade / Fixed Lot Sizing
SL (float) : Is The Trade SL In Price / In Pips
TP (float) : Is The Trade TP In Price / In Pips
OrderComment (string) : Is The Executed Trade Comment
Spread (float) : is The Maximum Spread For Execution
Returns: String - Pine Connector Order Syntax Alert Message
ClosePC(LicenseID, OrderType, SymbolPrefix, Symbol, SymbolSuffix)
Compiles Given Parameters Into An Alert String Format To Close Trades Using Pine Connector
Parameters:
LicenseID (string) : Is The Users PineConnector LicenseID
OrderType (int) : Is The Desired OrderType To Close
SymbolPrefix (string) : Is The Current Symbol Prefix (If Any)
Symbol (string) : Is The Traded Symbol
SymbolSuffix (string) : Is The Current Symbol Suffix (If Any)
Returns: String - Pine Connector Order Syntax Alert Message
//====================================================================================================================================================
// Custom Backtesting Calculation Functions
//====================================================================================================================================================
CalculatePNL(EntryPrice, ExitPrice, LotSize, ConversionRate)
Calculates Trade PNL Based On Entry, Eixt & Lot Size
Parameters:
EntryPrice (float) : Is The Trade Entry
ExitPrice (float) : Is The Trade Exit
LotSize (float) : Is The Trade Sizing
ConversionRate (float) : Is The Currency Conversion Rate (Used For Complex Lot Sizing Only)
Returns: Float - The Current Trade PNL
UpdateBalance(PrevBalance, PNL)
Updates The Previous Ginve Balance To The Next PNL
Parameters:
PrevBalance (float) : Is The Previous Balance To Be Updated
PNL (float) : Is The Current Trade PNL To Be Added
Returns: Float - The Current Updated PNL
CalculateSlpComm(PNL, MaxRate)
Calculates Random Slippage & Commisions Fees Based On The Parameters
Parameters:
PNL (float) : Is The Current Trade PNL
MaxRate (float) : Is The Upper Limit (In Percentage) Of The Randomized Fee
Returns: Float - A Percentage Fee Of The Current Trade PNL
UpdateDD(MaxBalance, Balance)
Calculates & Updates The DD Based On Its Given Parameters
Parameters:
MaxBalance (float) : Is The Maximum Balance Ever Recorded
Balance (float) : Is The Current Account Balance
Returns: Float - The Current Strategy DD
CalculateWR(TotalTrades, LongID, ShortID)
Calculate The Total, Long & Short Trades Win Rate
Parameters:
TotalTrades (int) : Are The Current Total Trades That The Strategy Has Taken
LongID (string) : Is The Order ID Of The Long Trades Of The Strategy
ShortID (string) : Is The Order ID Of The Short Trades Of The Strategy
Returns: Tuple Of Long WR%, Short WR%, Total WR%, Total Winning Trades, Total Losing Trades, Total Long Trades & Total Short Trades
CalculateAvgRRR(WinTrades, LossTrades)
Calculates The Overall Strategy Avg Risk Reward Ratio
Parameters:
WinTrades (int) : Are The Strategy Winning Trades
LossTrades (int) : Are The Strategy Losing Trades
Returns: Float - The Average RRR Values
CAGR(StartTime, StartPrice, EndTime, EndPrice)
Calculates The CAGR Over The Given Time Period © TradingView
Parameters:
StartTime (int) : Is The Starting Time Of The Calculation
StartPrice (float) : Is The Starting Price Of The Calculation
EndTime (int) : Is The Ending Time Of The Calculation
EndPrice (float) : Is The Ending Price Of The Calculation
Returns: Float - The CAGR Values
//====================================================================================================================================================
// Custom Plot Functions
//====================================================================================================================================================
EditLabels(LabelID, X1, Y1, Text, Color, TextColor, EditCondition, DeleteCondition)
Edit / Delete Labels
Parameters:
LabelID (label) : Is The ID Of The Selected Label
X1 (int) : Is The X1 Coordinate IN BARINDEX Xloc
Y1 (float) : Is The Y1 Coordinate IN PRICE Yloc
Text (string) : Is The Text Than Wants To Be Written In The Label
Color (color) : Is The Color Value Change Of The Label Text
TextColor (color)
EditCondition (int) : Is The Edit Condition of The Line (Setting Location / Color)
DeleteCondition (bool) : Is The Delete Condition Of The Line If Ture Deletes The Prev Itteration Of The Line
Returns: Void
EditLine(LineID, X1, Y1, X2, Y2, Color, EditCondition, DeleteCondition)
Edit / Delete Lines
Parameters:
LineID (line) : Is The ID Of The Selected Line
X1 (int) : Is The X1 Coordinate IN BARINDEX Xloc
Y1 (float) : Is The Y1 Coordinate IN PRICE Yloc
X2 (int) : Is The X2 Coordinate IN BARINDEX Xloc
Y2 (float) : Is The Y2 Coordinate IN PRICE Yloc
Color (color) : Is The Color Value Change Of The Line
EditCondition (int) : Is The Edit Condition of The Line (Setting Location / Color)
DeleteCondition (bool) : Is The Delete Condition Of The Line If Ture Deletes The Prev Itteration Of The Line
Returns: Void
//====================================================================================================================================================
// Custom Display Functions (Using Tables)
//====================================================================================================================================================
FillTable(TableID, Column, Row, Title, Value, BgColor, TextColor, ToolTip)
Filling The Selected Table With The Inputed Information
Parameters:
TableID (table) : Is The Table ID That Wants To Be Edited
Column (int) : Is The Current Column Of The Table That Wants To Be Edited
Row (int) : Is The Current Row Of The Table That Wants To Be Edited
Title (string) : Is The String Title Of The Current Cell Table
Value (string) : Is The String Value Of The Current Cell Table
BgColor (color) : Is The Selected Color For The Current Table
TextColor (color) : Is The Selected Color For The Current Table
ToolTip (string) : Is The ToolTip Of The Current Cell In The Table
Returns: Void
DisplayBTResults(TableID, BgColor, TextColor, StartingBalance, Balance, DollarReturn, TotalPips, MaxDD)
Filling The Selected Table With The Inputed Information
Parameters:
TableID (table) : Is The Table ID That Wants To Be Edited
BgColor (color) : Is The Selected Color For The Current Table
TextColor (color) : Is The Selected Color For The Current Table
StartingBalance (float) : Is The Account Starting Balance
Balance (float)
DollarReturn (float) : Is The Account Dollar Reture
TotalPips (float) : Is The Total Pips Gained / loss
MaxDD (float) : Is The Maximum Drawdown Over The Backtesting Period
Returns: Void
DisplayBTResultsV2(TableID, BgColor, TextColor, TotalWR, QTCount, LongWR, ShortWR, InitialCapital, CumProfit, CumFee, AvgRRR, MaxDD, CAGR, MeanDD)
Filling The Selected Table With The Inputed Information
Parameters:
TableID (table) : Is The Table ID That Wants To Be Edited
BgColor (color) : Is The Selected Color For The Current Table
TextColor (color) : Is The Selected Color For The Current Table
TotalWR (float) : Is The Strategy Total WR In %
QTCount (int) : Is The Strategy Questionable Trades Count
LongWR (float) : Is The Strategy Total WR In %
ShortWR (float) : Is The Strategy Total WR In %
InitialCapital (float) : Is The Strategy Initial Starting Capital
CumProfit (float) : Is The Strategy Ending Cumulative Profit
CumFee (float) : Is The Strategy Ending Cumulative Fee (Based On Randomized Fee Assumptions)
AvgRRR (float) : Is The Strategy Average Risk Reward Ratio
MaxDD (float) : Is The Strategy Maximum DrawDown In Its Backtesting Period
CAGR (float) : Is The Strategy Compounded Average GRowth In %
MeanDD (float) : Is The Strategy Mean / Average Drawdown In The Backtesting Period
Returns: Void
//====================================================================================================================================================
// Custom Pattern Detection Functions
//====================================================================================================================================================
BullFib(priceLow, priceHigh, fibRatio)
Calculates A Bullish Fibonacci Value (From Swing Low To High) © ZenAndTheArtOfTrading
Parameters:
priceLow (float)
priceHigh (float)
fibRatio (float)
Returns: The Fibonacci Value Of The Given Ratio Between The Two Price Points
BearFib(priceLow, priceHigh, fibRatio)
Calculates A Bearish Fibonacci Value (From Swing High To Low) © ZenAndTheArtOfTrading
Parameters:
priceLow (float)
priceHigh (float)
fibRatio (float)
Returns: The Fibonacci Value Of The Given Ratio Between The Two Price Points
GetBodySize()
Gets The Current Candle Body Size IN POINTS © ZenAndTheArtOfTrading
Returns: The Current Candle Body Size IN POINTS
GetTopWickSize()
Gets The Current Candle Top Wick Size IN POINTS © ZenAndTheArtOfTrading
Returns: The Current Candle Top Wick Size IN POINTS
GetBottomWickSize()
Gets The Current Candle Bottom Wick Size IN POINTS © ZenAndTheArtOfTrading
Returns: The Current Candle Bottom Wick Size IN POINTS
GetBodyPercent()
Gets The Current Candle Body Size As A Percentage Of Its Entire Size Including Its Wicks © ZenAndTheArtOfTrading
Returns: The Current Candle Body Size IN PERCENTAGE
GetTopWickPercent()
Gets The Current Top Wick Size As A Percentage Of Its Entire Body Size
Returns: Float - The Current Candle Top Wick Size IN PERCENTAGE
GetBottomWickPercent()
Gets The Current Bottom Wick Size As A Percentage Of Its Entire Bodu Size
Returns: Float - The Current Candle Bottom Size IN PERCENTAGE
BullishEC(Allowance, RejectionWickSize, EngulfWick, NearSwings, SwingLookBack)
Checks If The Current Bar Is A Bullish Engulfing Candle
Parameters:
Allowance (int) : To Give Flexibility Of Engulfing Pattern Detection In Markets That Have Micro Gaps, Defval = 0
RejectionWickSize (float) : To Filter Out long (Upper And Lower) Wick From The Bullsih Engulfing Pattern, Defval = na
EngulfWick (bool) : To Specify If We Want The Pattern To Also Engulf Its Upper & Lower Previous Wicks, Defval = false
NearSwings (bool) : To Specify If We Want The Pattern To Be Near A Recent Swing Low, Defval = true
SwingLookBack (int) : To Specify How Many Bars Back To Detect A Recent Swing Low, Defval = 10
Returns: Bool - True If The Current Bar Matches The Requirements of a Bullish Engulfing Candle
BearishEC(Allowance, RejectionWickSize, EngulfWick, NearSwings, SwingLookBack)
Checks If The Current Bar Is A Bearish Engulfing Candle
Parameters:
Allowance (int) : To Give Flexibility Of Engulfing Pattern Detection In Markets That Have Micro Gaps, Defval = 0
RejectionWickSize (float) : To Filter Out long (Upper And Lower) Wick From The Bearish Engulfing Pattern, Defval = na
EngulfWick (bool) : To Specify If We Want The Pattern To Also Engulf Its Upper & Lower Previous Wicks, Defval = false
NearSwings (bool) : To Specify If We Want The Pattern To Be Near A Recent Swing High, Defval = true
SwingLookBack (int) : To Specify How Many Bars Back To Detect A Recent Swing High, Defval = 10
Returns: Bool - True If The Current Bar Matches The Requirements of a Bearish Engulfing Candle
Hammer(Fib, ColorMatch, NearSwings, SwingLookBack, ATRFilterCheck, ATRPeriod)
Checks If The Current Bar Is A Hammer Candle
Parameters:
Fib (float) : To Specify Which Fibonacci Ratio To Use When Determining The Hammer Candle, Defval = 0.382 Ratio
ColorMatch (bool) : To Filter Only Bullish Closed Hammer Candle Pattern, Defval = false
NearSwings (bool) : To Specify If We Want The Doji To Be Near A Recent Swing Low, Defval = true
SwingLookBack (int) : To Specify How Many Bars Back To Detect A Recent Swing Low, Defval = 10
ATRFilterCheck (float) : To Filter Smaller Hammer Candles That Might Be Better Classified As A Doji Candle, Defval = 1
ATRPeriod (simple int) : To Change ATR Period Of The ATR Filter, Defval = 20
Returns: Bool - True If The Current Bar Matches The Requirements of a Hammer Candle
Star(Fib, ColorMatch, NearSwings, SwingLookBack, ATRFilterCheck, ATRPeriod)
Checks If The Current Bar Is A Hammer Candle
Parameters:
Fib (float) : To Specify Which Fibonacci Ratio To Use When Determining The Hammer Candle, Defval = 0.382 Ratio
ColorMatch (bool) : To Filter Only Bullish Closed Hammer Candle Pattern, Defval = false
NearSwings (bool) : To Specify If We Want The Doji To Be Near A Recent Swing Low, Defval = true
SwingLookBack (int) : To Specify How Many Bars Back To Detect A Recent Swing Low, Defval = 10
ATRFilterCheck (float) : To Filter Smaller Hammer Candles That Might Be Better Classified As A Doji Candle, Defval = 1
ATRPeriod (simple int) : To Change ATR Period Of The ATR Filter, Defval = 20
Returns: Bool - True If The Current Bar Matches The Requirements of a Hammer Candle
Doji(MaxWickSize, MaxBodySize, DojiType, NearSwings, SwingLookBack)
Checks If The Current Bar Is A Doji Candle
Parameters:
MaxWickSize (float) : To Specify The Maximum Lenght Of Its Upper & Lower Wick, Defval = 2
MaxBodySize (float) : To Specify The Maximum Lenght Of Its Candle Body IN PERCENT, Defval = 0.05
DojiType (int)
NearSwings (bool) : To Specify If We Want The Doji To Be Near A Recent Swing High / Low (Only In Dragonlyf / Gravestone Mode), Defval = true
SwingLookBack (int) : To Specify How Many Bars Back To Detect A Recent Swing High / Low (Only In Dragonlyf / Gravestone Mode), Defval = 10
Returns: Bool - True If The Current Bar Matches The Requirements of a Doji Candle
BullishIB(Allowance, RejectionWickSize, EngulfWick, NearSwings, SwingLookBack)
Checks If The Current Bar Is A Bullish Harami Candle
Parameters:
Allowance (int) : To Give Flexibility Of Harami Pattern Detection In Markets That Have Micro Gaps, Defval = 0
RejectionWickSize (float) : To Filter Out long (Upper And Lower) Wick From The Bullsih Harami Pattern, Defval = na
EngulfWick (bool) : To Specify If We Want The Pattern To Also Engulf Its Upper & Lower Previous Wicks, Defval = false
NearSwings (bool) : To Specify If We Want The Pattern To Be Near A Recent Swing Low, Defval = true
SwingLookBack (int) : To Specify How Many Bars Back To Detect A Recent Swing Low, Defval = 10
Returns: Bool - True If The Current Bar Matches The Requirements of a Bullish Harami Candle
BearishIB(Allowance, RejectionWickSize, EngulfWick, NearSwings, SwingLookBack)
Checks If The Current Bar Is A Bullish Harami Candle
Parameters:
Allowance (int) : To Give Flexibility Of Harami Pattern Detection In Markets That Have Micro Gaps, Defval = 0
RejectionWickSize (float) : To Filter Out long (Upper And Lower) Wick From The Bearish Harami Pattern, Defval = na
EngulfWick (bool) : To Specify If We Want The Pattern To Also Engulf Its Upper & Lower Previous Wicks, Defval = false
NearSwings (bool) : To Specify If We Want The Pattern To Be Near A Recent Swing High, Defval = true
SwingLookBack (int) : To Specify How Many Bars Back To Detect A Recent Swing High, Defval = 10
Returns: Bool - True If The Current Bar Matches The Requirements of a Bearish Harami Candle
//====================================================================================================================================================
// Custom Time Functions
//====================================================================================================================================================
BarInSession(sess, useFilter)
Determines if the current price bar falls inside the specified session © ZenAndTheArtOfTrading
Parameters:
sess (simple string)
useFilter (bool)
Returns: A boolean - true if the current bar falls within the given time session
BarOutSession(sess, useFilter)
Determines if the current price bar falls outside the specified session © ZenAndTheArtOfTrading
Parameters:
sess (simple string)
useFilter (bool)
Returns: A boolean - true if the current bar falls outside the given time session
DateFilter(startTime, endTime)
Determines if this bar's time falls within date filter range © ZenAndTheArtOfTrading
Parameters:
startTime (int)
endTime (int)
Returns: A boolean - true if the current bar falls within the given dates
DayFilter(monday, tuesday, wednesday, thursday, friday, saturday, sunday)
Checks if the current bar's day is in the list of given days to analyze © ZenAndTheArtOfTrading
Parameters:
monday (bool)
tuesday (bool)
wednesday (bool)
thursday (bool)
friday (bool)
saturday (bool)
sunday (bool)
Returns: A boolean - true if the current bar's day is one of the given days
AUSSess()
Checks If The Current Australian Forex Session In Running
Returns: Bool - True If Currently The Australian Session Is Running
ASIASess()
Checks If The Current Asian Forex Session In Running
Returns: Bool - True If Currently The Asian Session Is Running
EURSess()
Checks If The Current European Forex Session In Running
Returns: Bool - True If Currently The European Session Is Running
USSess()
Checks If The Current US Forex Session In Running
Returns: Bool - True If Currently The US Session Is Running
UNIXToDate(Time, ConversionType, TimeZone)
Converts UNIX Time To Datetime
Parameters:
Time (int) : Is The UNIX Time Input
ConversionType (int) : Is The Datetime Output Format, Defval = DD-MM-YYYY
TimeZone (string) : Is To Convert The Outputed Datetime Into The Specified Time Zone, Defval = Exchange Time Zone
Returns: String - String Of Datetime

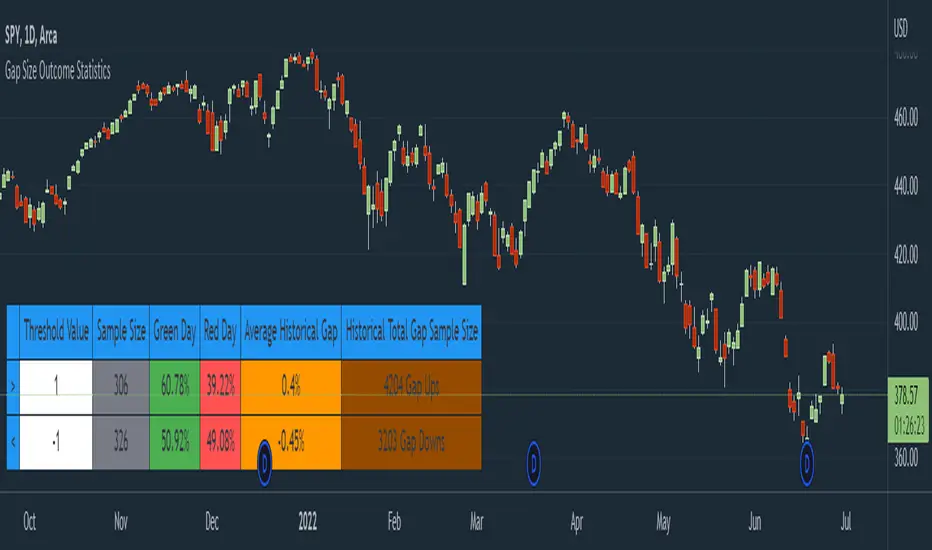
Gap Size Outcome Statistics [vnhilton]This indicator displays a table with statistics showing the outcomes of gap ups or downs based on your threshold (i.e. does the day end in green or red?). This can be useful for trading, where you're using relevant ETFs & see that they've gapped up/down, & can assume based on statistics that the ETF will end in green/red depending on which has the higher probability (however, you can use these on any other instruments such as stocks to find edges e.g. seeing whether stock XYZ is more likely to end in green/red when it gaps up 100%).
The table also includes sample sizes for your threshold tests for more confidence in the statistics, & also displays average gap up & downs & their respective sample sizes as well. This indicator is intended to be used on the daily timeframe, but can be used on lower or higher timeframes if you prefer.
In the chart snapshot image above, we can see that when the SPY gaps up > 1%, the day is more likely to end in green than in red. But when the SPY gaps down < -1%, it's also more likely to end in green than in red.
( IMPORTANT NOTE : There's 1 limitation with this indicator & it's that it assumes that days where close=open are green days, & that 0% gaps exact are considered gap ups.)
How to avoid repainting when using security() - PineCoders FAQNOTE
The non-repainting technique in this publication that relies on bar states is now deprecated, as we have identified inconsistencies that undermine its credibility as a universal solution. The outputs that use the technique are still available for reference in this publication. However, we do not endorse its usage. See this publication for more information about the current best practices for requesting HTF data and why they work.
This indicator shows how to avoid repainting when using the security() function to retrieve information from higher timeframes.
What do we mean by repainting?
Repainting is used to describe three different things, in what we’ve seen in TV members comments on indicators:
1. An indicator showing results that change during the realtime bar, whether the script is using the security() function or not, e.g., a Buy signal that goes on and then off, or a plot that changes values.
2. An indicator that uses future data not yet available on historical bars.
3. An indicator that uses a negative offset= parameter when plotting in order to plot information on past bars.
The repainting types we will be discussing here are the first two types, as the third one is intentional—sometimes even intentionally misleading when unscrupulous script writers want their strategy to look better than it is.
Let’s be clear about one thing: repainting is not caused by a bug ; it is caused by the different context between historical bars and the realtime bar, and script coders or users not taking the necessary precautions to prevent it.
Why should repainting be avoided?
Repainting matters because it affects the behavior of Pine scripts in the realtime bar, where the action happens and counts, because that is when traders (or our systems) take decisions where odds must be in our favor.
Repainting also matters because if you test a strategy on historical bars using only OHLC values, and then run that same code on the realtime bar with more than OHLC information, scripts not properly written or misconfigured alerts will alter the strategy’s behavior. At that point, you will not be running the same strategy you tested, and this invalidates your test results , which were run while not having the additional price information that is available in the realtime bar.
The realtime bar on your charts is only one bar, but it is a very important bar. Coding proper strategies and indicators on TV requires that you understand the variations in script behavior and how information available to the script varies between when the script is running on historical and realtime bars.
How does repainting occur?
Repainting happens because of something all traders instinctively crave: more information. Contrary to trader lure, more information is not always better. In the realtime bar, all TV indicators (a.k.a. studies ) execute every time price changes (i.e. every tick ). TV strategies will also behave the same way if they use the calc_on_every_tick = true parameter in their strategy() declaration statement (the parameter’s default value is false ). Pine coders must decide if they want their code to use the realtime price information as it comes in, or wait for the realtime bar to close before using the same OHLC values for that bar that would be used on historical bars.
Strategy modelers often assume that using realtime price information as it comes in the realtime bar will always improve their results. This is incorrect. More information does not necessarily improve performance because it almost always entails more noise. The extra information may or may not improve results; one cannot know until the code is run in realtime for enough time to provide data that can be analyzed and from which somewhat reliable conclusions can be derived. In any case, as was stated before, it is critical to understand that if your strategy is taking decisions on realtime tick data, you are NOT running the same strategy you tested on historical bars with OHLC values only.
How do we avoid repainting?
It comes down to using reliable information and properly configuring alerts, if you use them. Here are the main considerations:
1. If your code is using security() calls, use the syntax we propose to obtain reliable data from higher timeframes.
2. If your script is a strategy, do not use the calc_on_every_tick = true parameter unless your strategy uses previous bar information to calculate.
3. If your script is a study and is using current timeframe information that is compared to values obtained from a higher timeframe, even if you can rely on reliable higher timeframe information because you are correctly using the security() function, you still need to ensure the realtime bar’s information you use (a cross of current close over a higher timeframe MA, for example) is consistent with your backtest methodology, i.e. that your script calculates on the close of the realtime bar. If your system is using alerts, the simplest solution is to configure alerts to trigger Once Per Bar Close . If you are not using alerts, the best solution is to use information from the preceding bar. When using previous bar information, alerts can be configured to trigger Once Per Bar safely.
What does this indicator do?
It shows results for 9 different ways of using the security() function and illustrates the simplest and most effective way to avoid repainting, i.e. using security() as in the example above. To show the indicator’s lines the most clearly, price on the chart is shown with a black line rather than candlesticks. This indicator also shows how misusing security() produces repainting. All combinations of using a 0 or 1 offset to reference the series used in the security() , as well as all combinations of values for the gaps= and lookahead= parameters are shown.
The close in the call labeled “BEST” means that once security has reached the upper timeframe (1 day in our case), it will fetch the previous day’s value.
The gaps= parameter is not specified as it is off by default and that is what we need. This ensures that the value returned by security() will not contain na values on any of our chart’s bars.
The lookahead security() to use the last available value for the higher timeframe bar we are using (the previous day, in our case). This ensures that security() will return the value at the end of the higher timeframe, even if it has not occurred yet. In our case, this has no negative impact since we are requesting the previous day’s value, with has already closed.
The indicator’s Settings/Inputs allow you to set:
- The higher timeframe security() calls will use
- The source security() calls will use
- If you want identifying labels printed on the lines that have no gaps (the lines containing gaps are plotted using very thick lines that appear as horizontal blocks of one bar in length)
For the lines to be plotted, you need to be on a smaller timeframe than the one used for the security() calls.
Comments in the code explain what’s going on.
Look first. Then leap.

Gap Gain Test V1.0 by @overratedtraderOddball indicators for entertainment purposes only. This is best used on daily chart.
Look at the 20 ALMA to gauge likelihood of stock following its up or down gap.
- if above the 20 ALMA , follow the gap direction
- if below the 20 ALMA , take counter trend trade
If stock gaps up AND closes higher than it opens, that gain % (close/open) is colored green and if stock gaps down and closes lower than it opens, that gain % (close/open) is colored green
Conversely if the stock gaps up BUT closes lower than it opens, red and if a stop gaps down but closes higher than it opens, red.
Enjoy and follow me on twitter @overratedtrader for more nonsensical and out-of-the-box ideas.

SMA Indicator Signals [MK]Overview
The SMA Indicator Signals indicator is designed to identify high-probability trend-following entries using a dual SMA system and RSI filtering. Unlike traditional crossover indicators that rely on ta.crossover (which often fails during volatile market gaps), this script uses state-based logic to capture signals even when the price "jumps" over the moving average.
The "Gap-Over" Problem Solved
In fast-moving markets or at market open, price often gaps significantly. If the price opens above the SMA 20 after being below it, a standard indicator usually misses the signal because no "physical" cross occurred on the chart.
This indicator compares the current state to the previous state. If the price is now above the SMA while previously being below, the signal triggers regardless of the gap.
Key Features
Persistent Signals: Unlike strategies that hide signals while a trade is active, this indicator plots an icon for every valid occurrence, allowing you to scale into positions or identify secondary entries.
Trend-Filtered: Long signals only appear when the 20 SMA is above the 50 SMA (and vice-versa for shorts).
RSI Guardrail: Built-in RSI logic prevents you from chasing "Longs" into overbought territory or "Shorts" into oversold conditions.
Universal Alerts: Includes pre-configured alertcondition calls for Longs, Shorts, or both.
How to Trade it
The Signal: Look for the Green (Long) or Red (Short) triangles.
User Discretion: Since this version removes automated ADX/Expansion filters, the trader should look at the "width" of the gap between the Blue (20) and Orange (50) SMAs. Wider gaps usually indicate stronger momentum.
Alerts: Create an alert and select "Any SSMA Signal" to be notified on your phone or desktop the moment a setup forms.
Settings
Fast SMA (20): Your primary trigger line.
Slow SMA (50): Your primary trend filter.
RSI Thresholds: Customize how "early" or "late" you want to be filtered out of a move based on momentum.

fmfm12 chosen chart timeframe. It monitors the price to determine:
Whether resistance has been broken → BUY signal
Or support has been broken → SELL signal
After a breakout or breakdown, the indicator automatically draws price targets (T1 / T2 / T3) as percentages from the breakout point, and also displays FVG (Fair Value Gaps) zones that indicate imbalances between supply and demand.
⚙️ Main Components
Support and Resistance Levels (Key Levels)
Automatically calculated from the 4-hour timeframe (180 minutes).
Draws lines:
Green = Resistance
Red = Support
Option to display a midline (blue).
Line style (solid / dashed / dotted), thickness, and label size are customizable.
Trading Signals (Signals)
When resistance is broken upward → BUY signal (green).
When support is broken downward → SELL signal (red).
Signal size is adjustable (small / large, etc.).
Price Targets (Targets)
After confirming a breakout or breakdown, the indicator draws:
T1 / T2 / T3 as horizontal lines in the breakout direction.
Target percentages are adjustable (default: 0.5%, 1%, 1.5%).
Different colors for bullish and bearish targets.
Fair Value Gaps (FVG)
Detects bullish and bearish gaps within a set number of candles (default: 10).
Draws transparent colored zones:
Light Green = Bullish Gap
Light Red = Bearish Gap
📊 Practical Usage
Add the indicator to TradingView (paste the code into the Pine Editor, save, and add it to the chart).
When the price approaches a support or resistance line, observe:

FVG Scanner CareCA Fair Value Gap detection indicator that identifies institutional order flow imbalances by highlighting price gaps where buyers or sellers overwhelmingly dominated. It marks bullish FVGs (green gaps where buyers controlled) and bearish FVGs (red gaps where sellers controlled), providing clear visual zones for potential support/resistance retests and institutional entry points.
Perfect for identifying smart money footprints and combining with other indicators to find high-probability reversal zones during scalping.

SMC-Clean v5 [BOS + OB + FVG]SMC-Clean v5 is a clean and lightweight Smart Money Concepts indicator designed to visualize market structure, Order Blocks, and Fair Value Gaps in a clear and non-repainting way.
The indicator automatically identifies Break of Structure (BOS) and Change of Character (CHoCH) using pivot-based structure logic, helping traders understand trend continuation and potential reversals. Bullish and bearish structures are clearly marked on the chart for quick visual interpretation.
It also detects Bullish and Bearish Order Blocks based on strong displacement candles filtered by ATR. Order Blocks are drawn as zones and are automatically removed once mitigated, keeping the chart clean and relevant.
Additionally, the script highlights Fair Value Gaps (FVG) using a three-candle imbalance model, filtered by minimum ATR size. These gaps can be used for pullback entries, mean reversion, and confluence with structure and Order Blocks.
SMC-Clean v5 is designed to be minimal, fast, and practical. It works on all markets and timeframes and is best used as a market structure and context tool, not as a standalone signal system. The script can be further customized and expanded into advanced SMC models.

Order Blocks & ImbalanceThis indicator automatically identifies and plots Order Blocks (also known as Fair Value Gaps or Imbalances) based on Smart Money Concepts (SMC) and ICT methodology. It detects significant price inefficiencies (gaps between candles) that often act as institutional supply or demand zones.
How It Works (Technical Methodology)
1. Fair Value Gap (FVG) Detection
The indicator identifies classic 3-candle imbalances:
- Bullish Order Block (Demand): When the low of the current candle is significantly below the high of the candle two bars ago (low - high ).
- Bearish Order Block (Supply): When the high of the current candle is significantly above the low of the candle two bars ago (low - high ).
A minimum size threshold is enforced using ATR(14) × user-defined multiplier (default 0.5) to filter out minor gaps and focus on meaningful inefficiencies.
2. Zone Creation
- Bullish zones are created at the candle two bars ago (the "origin" candle where inefficiency occurred).
- Bearish zones use the same origin candle.
- Zone boundaries:
Top = high of origin candle
Bottom = low of origin candle
This captures the full range where price moved aggressively, leaving an imbalance that institutions may later revisit.
3. Mitigation Detection
Zones can be mitigated in two ways (user-selectable):
- "Close": Zone is considered touched only if the close price enters the zone.
- "Wick": Zone is touched if any wick (high/low) enters the zone (more sensitive).
When mitigated:
- Background becomes more transparent
- Border turns dotted
- Label changes to "Mitigated"
Broken zones (price fully closes beyond the opposite side) are automatically deleted.
4. Zone Lifecycle Management
- Active Zone: Strong color fill (green for demand, red for supply) with solid border.
- Mitigated Zone: Faded color, dotted border – indicates partial fill or reduced strength.
- Broken Zone: Automatically removed from chart to reduce clutter.
Old zones are also pruned when exceeding 450 total to maintain performance.
5. Smart Visibility Engine (Optional)
When enabled:
- All zones are initially hidden.
- Only the closest relevant zones are shown:
- Up to user-defined limit (default 10) highest bullish zones (closest below price)
- Up to user-defined limit (default 10) lowest bearish zones (closest above price)
- Visible zones are automatically extended to the right and styled appropriately.
This keeps the chart clean while highlighting the most actionable zones near current price.
6. Visual Elements
- Demand Zones: Green fill, labeled "OB Demand"
- Supply Zones: Red fill, labeled "OB Supply"
- Tiny text size to minimize chart clutter
- Zones drawn as boxes using bar_index positioning
How to Use
Order Blocks represent areas of price inefficiency where smart money likely entered/exited positions aggressively.
- Demand Zones (Green): Potential long entry areas when price returns. Expect buying pressure to defend these levels. Best setups when price retests an active (non-mitigated) zone.
- Supply Zones (Red): Potential short entry areas when price returns. Expect selling pressure to emerge.
- Mitigated Zones: Lower probability – may act as weaker support/resistance.
- Smart Visibility: Highly recommended for cleaner charts. Focuses attention on zones most likely to be tested soon.
- Combine with:
- Break of Structure (BOS)/Change of Character (CHOCH)
- Liquidity grabs
- Higher timeframe confluence
- Volume or momentum confirmation
Use higher FVG threshold (e.g., 0.8–1.0) for fewer, higher-quality zones. Lower threshold for more aggressive detection.
Disclaimer
This indicator is a technical analysis tool and should be used in conjunction with other forms of analysis. Past performance does not guarantee future results. Always use proper risk management.

Iridescent Liquidity Prism [JOAT]Iridescent Liquidity Prism | Peer Momentum HUD
A multi-layered order-flow indicator that combines microstructure analysis, smart-money footprint detection, and intermarket momentum signals. The script uses dynamic color-shifting themes to visualize liquidity patterns, structure, and peer momentum data directly on the chart.
There is so much to choose from inside the settings, if you think it's a mess on the chart it's because you have to personally customize it based on your needs...
Core Functionality
The indicator calculates and displays several analytical layers simultaneously:
Order-Flow Imbalance (OFI): Calculates buy vs. sell volume pressure using volume-weighted price distribution within each bar. Uses an EMA filter (default: 55 periods) to smooth the signal. Values are normalized using standard deviation to identify significant imbalances.
Smart Money Footprints: Detects accumulation and distribution zones by comparing volume rate of change (ROC) against price ROC. When volume ROC exceeds a threshold (default: 65%) and price ROC is positive, accumulation is detected. When volume ROC is high but price ROC is negative, distribution is detected.
Fractal Structure Mapping: Identifies pivot highs and lows using a fractal detection algorithm (default: 5-bar period). Maintains a rolling window of recent structure points (default: 4 levels) and draws connecting lines to show trend structure.
Fair Value Gap (FVG) Detection: Automatically detects price gaps where three consecutive candles create an imbalance. Bullish FVGs occur when the current low exceeds the high two bars ago. Bearish FVGs occur when the current high is below the low two bars ago. Gaps persist for a configurable duration (default: 320 bars) and fade when price fills the gap.
Liquidity Void Detection: Identifies candles where the high-low range exceeds an ATR threshold (default: 1.7x ATR) while volume is below average (default: 65% of 20-bar average). These conditions suggest areas where liquidity may be thin.
Price/Volume Divergence: Uses linear regression to detect when price trend direction disagrees with volume trend direction. A divergence alert appears when price is trending up while volume is trending down, or vice versa.
Peer Momentum Heatmap (PMH): Calculates composite momentum scores for up to 6 symbols across 4 timeframes. Each score combines RSI (default: 14 periods) and StochRSI (default: 14 periods, 3-bar smooth) to create a momentum composite between -1 and +1. The highest absolute momentum score across all combinations is displayed in the HUD.
Custom settings using Fractal Pivots, Skeleton Structure, Pulse Liquidity Voids, Bottom Colorful HeatMaps, and Iridescent Field.
---
Visual Components
Spectrum Aura Glow: ATR-weighted bands (default: 0.25x ATR) that expand and contract around price action, indicating volatility conditions. The thickness adapts to market volatility.
Chromatic Flow Trail: A blended line combining EMA and WMA of price (default: 8-period EMA blended with WMA at 65% ratio). The trail uses gradient colors that shift based on a phase oscillator, creating an iridescent effect.
Volume Heat Projection: Creates horizontal volume profile bands at price levels (default: 14 levels). Scans recent bars (default: 150 bars) to calculate volume concentration. Each level is colored based on its volume density relative to the maximum volume level.
Structure Skeleton: Dashed lines connecting fractal pivot points. Uses two layers: a primary line (2-3px width) and an optional glow overlay (4-5px width) for enhanced visibility.
Fractal Markers: Diamond shapes placed at pivot high and low points. Color-coded: primary color for highs, secondary color for lows.
Iridescent Color Themes: Five color themes available: Iridescent (default), Pearlescent, Prismatic, ColorShift, and Metallic. Colors shift dynamically using a phase oscillator that cycles through the color spectrum based on bar index and a speed multiplier (default: 0.35).
---
HUD Console Metrics
The right-side HUD displays seven key metrics:
Flow: Shows OFI status: ▲ FLOW BUY when normalized OFI exceeds imbalance threshold (default: 2.2), ▼ FLOW SELL when below -2.2, or ◆ FLOW BAL when balanced.
Struct: Structure trend bias: ▲ STRUCT BULL when microtrend > 2, ▼ STRUCT BEAR when < -2, or ◆ STRUCT RANGE when neutral.
Smart$: Institutional activity: ◈ ACCUM when smart money index = 1, ◈ DISTRIB when = -1, or ○ IDLE when inactive.
Liquid: Liquidity state: ⚡ VOID when a liquidity void is detected, or ● NORMAL otherwise.
Diverg: Divergence status: ⚠ ALERT when price/volume divergence detected, or ✓ CLEAR when aligned.
PMH: Peer Momentum Heatmap status: Shows dominant timeframe and momentum score. Displays 🪩 for bull surge (above 0.55 threshold) or 🧨 for bear surge (below -0.55).
FVG: Fair Value Gap status: Shows active gap count or CLEAR when no gaps exist. Displays GAP LONG when bullish gap detected, GAP SHORT when bearish gap detected.
Pearlscent Color with Volume Heatmap.
Parameters and Settings
Microstructure Engine:
Analysis Depth: 20-250 bars (default: 55) - Controls OFI smoothing period
Liquidity Threshold ATR: 1.0-4.0 (default: 1.7) - Multiplier for void detection
Imbalance Ratio: 1.5-6.0 (default: 2.2) - Standard deviations for OFI significance
Smart Money Layer:
Smart Money Window: 10-150 bars (default: 24) - Period for ROC calculations
Accumulation Threshold: 40-95% (default: 65%) - Volume ROC threshold
Structural Mapping:
Fractal Pivot Period: 3-15 bars (default: 5) - Period for pivot detection
Structure Memory: 2-8 levels (default: 4) - Number of structure points to track
Volume Heat Projection:
Heat Map Lookback: 60-400 bars (default: 150) - Bars to analyze for volume profile
Heat Map Levels: 5-30 levels (default: 14) - Number of price level bands
Heat Map Opacity: 40-100% (default: 92%) - Transparency of heat map boxes
Heat Map Width Limit: 6-80 bars (default: 26) - Maximum width of heat map boxes
Heat Map Visibility Threshold: 0.0-0.5 (default: 0.08) - Minimum density to display
Iridescent Enhancements:
Visual Theme: Iridescent, Pearlescent, Prismatic, ColorShift, or Metallic
Color Shift Speed: 0.05-1.00 (default: 0.35) - Speed of color phase oscillation
Aura Thickness (ATR): 0.05-1.0 (default: 0.25) - Multiplier for aura band width
Chromatic Trail Length: 2-50 bars (default: 8) - Period for trail calculation
Trail Blend Ratio: 0.1-0.95 (default: 0.65) - EMA/WMA blend percentage
FVG Persistence: 50-600 bars (default: 320) - Bars to keep FVG boxes active
Max Active FVG Boxes: 10-200 (default: 40) - Maximum boxes on chart
FVG Base Opacity: 20-95% (default: 80%) - Transparency of FVG boxes
Peer Momentum Heatmap:
Peer Symbols: Comma-separated list of up to 6 symbols (e.g., "BTCUSD,ETHUSD")
Peer Timeframes: Comma-separated list of up to 4 timeframes (default: "60,240,D")
PMH RSI Length: 5-50 periods (default: 14)
PMH StochRSI Length: 5-50 periods (default: 14)
PMH StochRSI Smooth: 1-10 periods (default: 3)
Super Momentum Threshold: 0.2-0.95 (default: 0.55) - Threshold for surge detection
Clarity & Readability:
Liquidity Void Opacity: 5-90% (default: 30%)
Smart Money Footprint Opacity: 5-90% (default: 35%)
HUD Background Opacity: 40-95% (default: 70%)
Iridescent Field:
Field Opacity: 20-100% (default: 86%) - Background color intensity
Field Smooth Length: 10-200 bars (default: 34) - Smoothing for background gradient
---
Alerts
The indicator provides seven alert conditions:
Liquidity Void Detected - Triggers when void conditions are met
Strong Order Flow - Triggers when normalized OFI exceeds imbalance ratio
Smart Money Activity - Triggers when accumulation or distribution detected
Price/Volume Divergence - Triggers when divergence conditions occur
Structure Shift - Triggers when structure polarity changes significantly
PMH Bull Surge - Triggers when PMH exceeds positive threshold (if enabled)
PMH Bear Surge - Triggers when PMH exceeds negative threshold (if enabled)
Bull/Bear Prismatic FVG - Triggers when new FVG is detected (if FVG display enabled)
---
Usage Considerations
Performance may vary on lower timeframes due to the volume heat map calculations scanning multiple bars. Consider reducing heat map lookback or levels if experiencing slowdowns.
The PMH feature requires data requests to other symbols/timeframes, which may impact performance. Limit the number of peer symbols and timeframes for optimal performance.
FVG boxes automatically expire after the persistence period to prevent chart clutter. The maximum box limit (default: 40) prevents excessive memory usage.
Color themes affect all visual elements. Choose a theme that provides good contrast with your chart background.
The indicator is designed for overlay display. All visual elements are positioned relative to price action.
Structure lines are drawn dynamically as new pivots form. On fast-moving markets, structure may update frequently.
Volume calculations assume typical volume data availability. Symbols without volume may show incomplete data for volume-dependent features.
---
Technical Notes
Built on Pine Script v6 with dynamic request capability for PMH functionality.
Uses exponential moving averages (EMA) and weighted moving averages (WMA) for trail calculations to balance responsiveness and smoothness.
Volume profile calculation uses price level buckets. Higher levels provide finer granularity but require more computation.
Iridescent color engine uses a phase oscillator with sine wave calculations for smooth color transitions.
Box management includes automatic cleanup of expired boxes to maintain performance.
All visual elements use color gradients and transparency for smooth blending with price action.
---
Customization Examples
Intraday Scalping Setup:
Analysis Depth: 30 bars
Heat Map Lookback: 100 bars
FVG Persistence: 150 bars
PMH Window: 15 bars
Fast color shift speed: 0.5+
Macro Structure Tracking:
Analysis Depth: 100+ bars
Heat Map Lookback: 300+ bars
FVG Persistence: 500+ bars
Structure Memory: 6-8 levels
Slower color shift speed: 0.2
---
Limitations
Volume heat map calculations may be computationally intensive on lower timeframes with high lookback values.
PMH requires valid symbol names and accessible timeframes. Invalid symbols or timeframes will return no data.
FVG detection requires at least 3 bars of history. Early bars may not show FVG boxes.
Structure lines connect points but do not predict future structure. They reflect historical pivot relationships.
Color themes are aesthetic choices and do not affect calculation logic.
The indicator does not provide trading signals. All visual elements are analytical tools that require interpretation in context of market conditions.
Open Source
This indicator is open source and available for modification and distribution. The code is published with Pine Script v6 compliance. Users are free to customize parameters, modify calculations, and adapt the visual elements to their trading needs.
For questions, suggestions, or anything please talk to me in private messages or comments below!
Would love to help!
- officialjackofalltrades

First presented FVG (w/stats) w/statistical hourly ranges & biasOverview
This indicator identifies the first Fair Value Gap (FVG) that forms during each hourly session and provides comprehensive statistical analysis based on 12 years of historical NASDAQ (NQ) data. It combines price action analysis with probability-based statistics to help traders make informed decisions.
⚠️ IMPORTANT - Compatibility
Market: This indicator is designed exclusively for NASDAQ futures (NQ/MNQ)
Timeframe: Statistical data is based on FVGs formed on the 5-minute timeframe
FVG Detection: Works on any timeframe, but use 5-minute for accuracy matching the statistical analysis
All hardcoded statistics are derived from 12 years of NQ historical data
What It Does
1. FVG Detection & Visualization
Automatically detects the first FVG (bullish or bearish) that forms each hour
Draws colored boxes around FVGs:
Blue boxes = Bullish FVG (gap up)
Red boxes = Bearish FVG (gap down)
FVG boxes extend to the end of the hour
Optional midpoint lines show the center of each FVG
Uses volume imbalance logic (outside prints) to refine FVG boundaries
2. Hourly Reference Lines
Vertical Delimiter: Marks the start of each hour
Hourly Open Line: Shows where the current hour opened
Expected Range Lines: Projects the anticipated high/low based on historical data
Choose between Mean (average) or Median (middle value) statistics
Upper range line (teal/green)
Lower range line (red)
All lines span exactly one hour from the moment it opens
Optional labels show price values at line ends
3. Real-Time Statistics Table
The table displays live data for the current hour only:
Hour: Current hour in 12-hour format (AM/PM)
FVG Status: Shows if a Bull FVG, Bear FVG, or no FVG has formed yet
Green background = Bullish FVG detected
Red background = Bearish FVG detected
1st 15min: Direction of the first 15 minutes (Bullish/Bearish/Neutral/Pending)
Continuation %: Historical probability that the hour continues in the first 15-minute direction
Color-coded: Green for bullish, red for bearish
Avg Range %: Expected percentage range for the current hour (based on 12-year mean)
FVG Effect %: Historical probability that FVG direction predicts hourly close direction
Shows BISI→Bull % for bullish FVGs
Shows SIBI→Bear % for bearish FVGs
Blank if no FVG has formed yet
Time Left: Countdown timer showing MM:SS remaining in the hour (updates in real-time)
Hourly Bias: Historical directional tendency (bullish % or bearish %)
H Open: Current hour's opening price
Exp Range: Projected price range (Low - High) based on historical average
Customization Options
Detection Settings:
Lower Timeframe Selection (15S, 1min, 5min) - controls FVG detection granularity
Display Settings:
FVG box colors (bullish/bearish)
Midpoint lines (show/hide, color, style)
Table Settings:
Position (9 locations: corners, edges, center)
Text size (Tiny, Small, Normal, Large)
Hourly Lines:
Toggle each line type on/off
Hour delimiter (color, width)
Open line (color, width, style)
Range lines (color, width, style)
Choose Mean or Median statistics for range calculation
Show/hide labels with customizable text size
How to Use
Apply to NQ futures chart (NQ1! or MNQ1!)
Set chart to 5-minute timeframe for optimal FVG detection matching the statistical data
Watch for the first FVG to form each hour
Reference the table for probability-based decision support:
High continuation % = strong directional bias
FVG Effect % shows reliability of the FVG signal
Time Left helps manage entries/exits within the hour
Use range lines as potential targets or reversal zones
Statistical Foundation
All statistics are derived from:
12 years of NASDAQ (NQ) historical data
Hourly analysis of FVG formation patterns
First 15-minute directional analysis
Mean and Median calculations for range expectations
Data encompasses 2,400+ samples per hour
Best Practices
✅ Use on NQ/MNQ futures only
✅ Best on 5-minute charts (matches statistical data)
✅ Combine FVG signals with continuation probabilities
✅ Use range lines as potential profit targets
✅ Watch the countdown timer for hour-end setups
❌ Do not use on other markets (statistics won't apply)
❌ Avoid using during low-liquidity hours (5PM ET has minimal data)
Technical Notes
Timezone: America/New_York (EST/EDT)
Weekend filtering: Automatically hides data during market closure
Updates in real-time on live bars
Maximum 500 boxes/lines for performance
FVG detection includes volume imbalance (body gap) refinement
Credits
Statistical analysis based on 12 years of NASDAQ historical data. FVG detection methodology follows ICT concepts with volume imbalance refinement.
Disclaimer: This indicator provides statistical analysis based on historical data. Past performance does not guarantee future results. Always use proper risk management.
Would you like me to adjust any section or add/remove anything?6-9 Session & Levels - Customizable Range Analysis Indicator
Description:
This indicator provides comprehensive session-based range analysis designed for intraday traders. It calculates and displays key levels based on a customizable session period (default 6:00-9:00 AM ET).
Core Features:
Sespastedthis is a summary for another indicator- i was hoping for something more like this in terms of content etc22:23Architected comprehensive indicator summary matching professional documentation style.The user wants me to rewrite the summary for their FVG indicator in a similar style to the example provided. The example is more structured, detailed, and professional. Let me create a comprehensive summary that follows that format:
Clear title
Description/Overview
Core Features (broken down into sections)
Input Settings Explained (detailed breakdown of all customization options)
How It Works section
Use Case
Note/Disclaimer
Let me make it thorough and match the style while being accurate to their indicator's functionality.Here's a detailed summary in that format:
Every Hour 1st FVG with Statistical Analysis - NASDAQ Hourly Trading Intelligence
Description:
This indicator identifies the first Fair Value Gap (FVG) that forms during each hourly session and provides comprehensive probability-based statistical analysis derived from 12 years of NASDAQ (NQ) historical data. It combines real-time FVG detection with hardcoded statistical probabilities to help intraday traders make informed decisions based on historical patterns and hourly price action dynamics.
IMPORTANT: This indicator is specifically calibrated for NASDAQ futures (NQ/MNQ) only. All statistical data is derived from 12 years of NQ historical analysis with FVGs detected on the 5-minute timeframe. Using this indicator on other markets will produce invalid statistical results.
Core Features:
FVG Detection & Visualization
Automatically detects and displays the first Fair Value Gap (bullish or bearish) that forms within each hourly session
Color-coded boxes mark FVG zones: Blue for bullish FVGs (gap up), Red for bearish FVGs (gap down)
FVG boxes extend precisely to the end of the hour boundary
Optional midpoint lines show the center point of each FVG
Uses volume imbalance logic (outside prints) to refine FVG boundaries beyond simple wick-to-wick gaps
Supports both chart timeframe detection and lower timeframe detection via request.security_lower_tf
Hourly Reference Lines
Vertical Hour Delimiter: Marks the exact start of each new hour with an extendable vertical line
Hourly Open Line: Displays the opening price of the current hour
Expected Range Lines: Projects anticipated high and low levels based on 12 years of statistical data
Choose between Mean (average) or Median (middle value) calculations
Upper range line shows expected high
Lower range line shows expected low
All lines span exactly one hour from open to close
Optional labels display exact price values at the end of each line
Real-Time Statistics Table
Displays comprehensive live data for the current hour only:
Hour: Current hour in 12-hour format (e.g., "9AM", "2PM")
FVG Status: Shows detection state with color coding
"None Yet" (white background) - No FVG detected
"Bull FVG" (green background) - Bullish FVG identified
"Bear FVG" (red background) - Bearish FVG identified
1st 15min: Direction of first 15 minutes (Bullish/Bearish/Neutral/Pending)
Continuation %: Historical probability that the hour closes in the direction of the first 15 minutes
Green background with up arrow (↑) for bullish continuation probability
Red background with down arrow (↓) for bearish continuation probability
Avg Range %: Expected percentage range for the current hour based on 12-year mean
FVG Effect %: Historical effectiveness of FVG directional prediction
Shows "BISI→Bull %" for bullish FVGs (gap up predicting bullish hourly close)
Shows "SIBI→Bear %" for bearish FVGs (gap down predicting bearish hourly close)
Displays blank if no FVG has formed yet
Time Left: Real-time countdown timer showing minutes and seconds remaining in the hour (MM:SS format)
Hourly Bias: Historical directional tendency showing bullish or bearish percentage bias
H Open: Current hour's opening price
Exp Range: Projected price range showing "Low - High" based on selected statistic (mean or median)
Input Settings Explained:
Detection Settings
Lower Timeframe: Select the base timeframe for FVG detection
Options: 15S (15 seconds), 1 (1 minute), 5 (5 minutes)
Recommendation: Use 5-minute to match the statistical data sample
The indicator uses this timeframe to scan for FVG patterns even when viewing higher timeframes
Display Settings
Bullish FVG Color: Set the color and transparency for bullish (upward) FVG boxes
Bearish FVG Color: Set the color and transparency for bearish (downward) FVG boxes
Show Midpoint Lines: Toggle horizontal lines at the center of each FVG box
Midpoint Line Color: Customize the midpoint line color
Midpoint Line Style: Choose between Solid, Dotted, or Dashed line styles
Table Settings
Table Position: Choose from 9 locations:
Top: Left, Center, Right
Middle: Left, Center, Right
Bottom: Left, Center, Right
Table Text Size: Select from Tiny, Small, Normal, or Large for readability on different screen sizes
Hourly Lines Settings
Show Hourly Lines: Master toggle for all hourly reference lines
Show Hour Delimiter: Toggle the vertical line marking each hour's start
Delimiter Color: Customize color and transparency
Delimiter Width: Set line thickness (1-5)
Show Hourly Open: Toggle the horizontal line at the hour's opening price
Open Line Color: Customize color
Open Line Width: Set thickness (1-5)
Open Line Style: Choose Solid, Dashed, or Dotted
Show Range Lines: Toggle the expected high/low projection lines
Range Statistic: Choose "Mean" (12-year average) or "Median" (12-year middle value)
Range High Color: Customize upper range line color and transparency
Range Low Color: Customize lower range line color and transparency
Range Line Width: Set thickness (1-5)
Range Line Style: Choose Solid, Dashed, or Dotted
Show Line Labels: Toggle price labels at the end of all horizontal lines
Label Text Size: Choose Tiny, Small, or Normal
How It Works:
FVG Detection Logic:
The indicator scans price action on the selected lower timeframe (default: 1-minute) looking for Fair Value Gaps using a 3-candle pattern:
Bullish FVG: Formed when candle 's high is below candle 's low, creating an upward gap
Bearish FVG: Formed when candle 's low is above candle 's high, creating a downward gap
The detection is refined using volume imbalance logic by checking for body gaps (outside prints) on both sides of the middle candle. This narrows the FVG zone to areas where bodies don't touch, indicating stronger imbalances.
Only the first FVG that forms during each hour is displayed. If a bullish FVG forms first, it takes priority. The FVG box is drawn from the formation time through to the end of the hour.
Statistical Analysis:
All probability statistics are hardcoded from 12 years (2,400+ samples per hour) of NASDAQ futures analysis:
First 15-Minute Direction: At 15 minutes into each hour, the indicator determines if price closed above, below, or equal to the hour's opening price
Continuation Probability: Historical analysis shows the likelihood that the hour closes in the same direction as the first 15 minutes
Example: If 9AM's first 15 minutes are bullish, there's a 60.1% chance the entire 9AM hour closes bullish (lowest continuation hour)
4PM shows the highest continuation at 86.1% for bullish first 15 minutes
FVG Effectiveness: Tracks how often the first FVG's direction correctly predicts the hourly close direction
BISI (Bullish Imbalance/Sell-side Inefficiency) → Bullish close probability
SIBI (Bearish Imbalance/Buy-side Inefficiency) → Bearish close probability
Range Expectations: Mean and median values represent typical price movement percentage for each hour
9AM and 10AM show the largest ranges (~0.6%)
5PM shows minimal range (~0.06%) due to low liquidity
Hourly Reference Lines:
When each new hour begins:
Vertical delimiter marks the hour's start
Hourly open line plots at the first bar's opening price
Range projection lines calculate expected high/low:
Upper Range = Hourly Open + (Range% / 100 × Hourly Open)
Lower Range = Hourly Open - (Range% / 100 × Hourly Open)
Lines extend exactly to the hour's end time
Labels appear at line endpoints showing exact prices
Real-Time Updates:
FVG Status: Updates immediately when the first FVG forms
First 15min Direction: Locked in at the 15-minute mark
Countdown Timer: Uses timenow to update every second
Table Statistics: Refresh on every bar close
Timezone Handling:
All times are in America/New_York (Eastern Time)
Automatically filters weekend periods (Saturday and Sunday before 6PM)
Hour detection accounts for daylight saving time changes
Use Cases:
Intraday Trading Strategy Development:
FVG Entry Signals: Use the first hourly FVG as a directional bias
Bullish FVG + High continuation % = Strong long setup
Bearish FVG + High continuation % = Strong short setup
First 15-Minute Breakout: Combine first 15-min direction with continuation probabilities
Wait for first 15 minutes to complete
If continuation % is above 70%, trade in that direction
Example: 4PM bullish first 15 min = 86.1% chance hour closes bullish
Range Targeting: Use expected high/low lines as profit targets or reversal zones
Price approaching mean high = potential resistance
Price approaching mean low = potential support
Compare mean vs median for different risk tolerance (median is more conservative)
Hour Selection: Focus trading on hours with:
High FVG effectiveness (11AM: 81.5% BISI→Bull)
High continuation rates (4PM: 86.1% bull continuation)
Avoid low-continuation hours like 9AM (60.1%)
Time Management: Use the countdown timer to:
Enter early in the hour when FVG forms
Exit before hour-end if no follow-through
Avoid late-hour entries with <15 minutes remaining
Statistical Edge Identification:
Compare current hour's FVG against historical effectiveness
Identify when first 15-min direction contradicts FVG direction (conflict = caution)
Use hourly bias to confirm or contradict FVG signals
Monitor if price stays within expected range or breaks out (outlier moves)
Risk Management:
Expected range lines provide logical stop-loss placement
FVG Effect % helps size positions (higher % = larger position)
Time Left countdown aids in time-based stop management
Avoid trading hours with neutral bias or low continuation rates
Statistical Foundation:
All embedded statistics are derived from:
12 years of NASDAQ futures (NQ) continuous contract data
5-minute timeframe FVG detection methodology
24 hours per day analysis (excluding weekends)
2,400+ samples per hour for robust statistical validity
America/New_York timezone for session alignment
Data includes:
Hourly range analysis (mean, median, standard deviation)
First 15-minute directional analysis
FVG formation frequency and effectiveness
Continuation probability matrices
Bullish/bearish bias percentages
Best Practices:
✅ Do:
Use exclusively on NASDAQ futures (NQ1! or MNQ1!)
Apply on 5-minute charts for optimal FVG detection matching statistical samples
Wait for first 15 minutes to complete before acting on continuation probabilities
Combine FVG signals with continuation % and FVG Effect % for confluence
Use expected range lines as initial profit targets
Monitor the countdown timer for time-based trade management
Focus on hours with high statistical edges (4PM, 11AM, 10AM)
❌ Don't:
Use on other markets (ES, RTY, YM, stocks, forex, crypto) - statistics will be invalid
Rely solely on FVG without confirming with continuation probabilities
Trade during low-liquidity hours (5PM shows only 0.06% average range)
Ignore the first 15-minute direction when it conflicts with FVG direction
Apply to timeframes significantly different from 5-minute for FVG detection
Use median range expectations aggressively (they're conservative)
Technical Implementation Notes:
Timezone: Fixed to America/New_York with automatic DST adjustment
Weekend Filtering: Automatically hides data Saturday and Sunday before 6PM ET
Performance: Maximum 500 boxes and 500 lines for optimal chart rendering
Update Frequency: Table updates on every bar close; timer updates every second using timenow
FVG Priority: Bullish FVGs take precedence when both form simultaneously
Lower Timeframe Detection: Uses request.security_lower_tf for accurate sub-chart-timeframe FVG detection
Precision: All price labels use format.mintick for appropriate decimal precision
Big thanks to @Trades-Dont-Lie for the FPFVG code in his excellent indicator that I've used here
