RSI-all in one_Pro[vn]👉Hello traders.
Introducing the " RSI all-in-one " Bot that includes the functions:
+ Automatically scan RSI divergence
+ Automatically scan RSI trendlines
+ Create an alert when there is a golden signal (RSI creates a divergence and then breaks its trendline, signaling a trend reversal)
Explain:
During trading when using the indicator "RSI - trendlines - div " in my library on TW web page:
- I have an idea to create a Bot indicator about "Automatically scan RSI divergences and trendlines". Because those are the top strengths when traders use the RSI to forecast trend reversals.
- On each chart of the trading pair, the RSI draws the trendline pair as: uptrendline and downtrendline (closest to the RSI)
- So when the statistics on "Bot" also shows the column of RSI trendlines up and the column of RSI trendlines down
- Column |════🡹\n\ʀꜱɪ| - is the above RSI trendline
- Column |ʀꜱɪ\n\════🡻| - is the below RSI trendline
- When RSI approaches any one of its trendlines and the ratio is 10%, then:
+ in column |✎\n\𝖙.𝖑𝖎𝖓𝖊| Red colored digits (downtrend)
+ in column |𝖙.𝖑𝖎𝖓𝖊\n\✐| blue colored digits (uptrend)
Is the value of the RSI trendline for traders to pay more attention to when it can be the entry and exit points according to the resistance and support nature of the RSI trendlines.
- When the RSI breaks the above trendline, it shows is "🡹", if it is the first candle, at the column |════🡹\n\ʀꜱɪ| it shows as "🡹1|1|1" the cell turns green , that's the RSI signal breaking the line. Its resistance to go up, wait for the candle to close, we can enter "Buy/Long" order.
- When the RSI line breaks below the trendline, it shows is "🡻", if it is the first candle, then at the column |ʀꜱɪ\n\════🡻| it displays as "🡻1|1|1" the cell turns red , that's the RSI signal breaking the line Support to continue down, wait for the candle to close, we can enter "Sell/Short" order
- The parameter when breaking shows 10|10|10, it means that the RSI has broken 10 candles (RSI candles), and the first 10 candles are colored green (bullish) red (bearish) then hidden. (can be changed in settings). In addition, when displaying the parameters of the cell as above, the column |✎\n\𝖙.𝖑𝖎𝖓𝖊| and |𝖙.𝖑𝖎𝖓𝖊\n\✐| will show the percentage from when the RSI break point to the current RSI (closed)
- Column |𝚍𝚒𝚟| is a divergence signal. When the price makes a new high, a new low, and the RSI signals a divergence, it will start to increase the base from the number 1. From here, the Trader will know which trading pair is starting to divergence RSI. Cell is Green bullish divergence, Cell is red bearish divergence
- Column|🆁🆂🅸| is the current RSI .{🟢} RSI above the cloud , {🔴} RSI below the cloud , {⚪️} RSI in the cloud(RSI clouds also indicate very well the support and resistance zone of RSI)
- There are 5 warning functions on this indicator
- The parameter {20:2} is the length of the RSI trendline and combines the same parameters with the "RSI - trendlines - div{vn}" indicator when analyzing
💥 Summary:
Trading methods with this indicator:
+ Trade when there is a divergence
+ Trade when the RSI approaches its trendline (it is the support and resistance line of the RSI)
+ Trade when the RSI breaks the trendline (definitively above or below)
+ Trade when there is a divergence then after a few candles, RSI breaks through its trendline, giving a golden signal.
1 . image
Later(sau đó)
2 . image
Later(sau đó)
Note: The indicator can create up to 40 trading pairs, so traders should choose a super nice signal to enter orders.
-----------------------------------------------------Vietnamese-------------------------------------------------------
👉Xin chào các nhà giao dịch VietNam.
xin giới thiệu Bot "RSI-Tất cả trong một " bao gồm các chức năng:
+ Tự động quét phân kì RSI
+ Tự động quét đường xu hướng RSI
+ Tạo cảnh báo khi có tín hiệu vàng(RSI tạo phân kì và sau đó phá vỡ đường xu hướng của nó báo hiệu đảo chiều xu hướng)
Diễn giải:
- Trong quá trình giao dịch khi dùng chỉ báo "RSI - trendlines - div " trong thư viện của tôi trên trang TW . Tôi có ý tưởng tạo chỉ báo Bot về " Tự động quét phân kì và đường xu hướng của RSI ". Vì đó là những điểm mạnh hàng đầu khi nhà giao dịch sử dụng chỉ báo RSI để dự báo đảo chiều xu hướng.
- Trên mỗi biểu đồ của cặp giao dịch, chỉ báo RSI vẽ cặp trendline là: trendline tăng và trendline giảm (gần với RSI nhất)
- Vì vậy khi thống kê trên " Bot " cũng hiển thị cột của RSI trendlines tăng và cột của RSI trendlines giảm
- Cột |════🡹\n\ʀꜱɪ| - là trendline RSI bên trên
- Cột |ʀꜱɪ\n\════🡻|- là trendline RSI bên dưới
- Khi RSI phá đường xu hướng bên trên thì nó hiển thị là "🡹", nếu là cây nến đầu tiên thì tại cột |════🡹\n\ʀꜱɪ| nó hiển thị là "🡹1|1|1" ô đổi màu xanh , đó là tín hiệu RSI phá vỡ đường kháng cự của nó để đi lên , chờ nến đóng cửa ta có thể vào lệnh "Buy/Long"
- Khi đường RSI phá đường xu hướng bên dưới thì nó hiển thị là "🡻", nếu là cây nến đầu tiên thì tại cột |ʀꜱɪ\n\════🡻| nó hiển thị là "🡻1|1|1" ô đổi màu đỏ , đó là tín hiệu RSI phá vỡ đường hỗ trợ để xuống tiếp , chờ nến đóng cửa ta có thể vào lệnh "Sell/Short "
-Khi RSI tiến gần đến 1 đường trendline bất kì của nó mà tỉ lệ còn 10% thì:
+ tại cột |✎\n\𝖙.𝖑𝖎𝖓𝖊| chữ số tô màu đỏ (trend giảm)
+ tại cột |𝖙.𝖑𝖎𝖓𝖊\n\✐| chữ số tô màu xanh (trend tăng)
Là giá trị của đường trendline RSI để trader chú ý hơn khi đó có thể là điểm vào lệnh và thoát lệnh theo tính chất kháng cự hỗ trợ của RSI trendlines.
-Thông số khi phá vỡ hiển thị 10|10|10 thì hiểu là RSI đã phá vỡ 10 nến(nến RSI), và 10 nến đầu tiên được tô màu xanh(tăng giá) màu đỏ (giảm giá) sau đó được ẩn(có thể thay đổi trong cài đặt). Ngoài ra khi hiện thông số của ô như trên thì cột |✎\n\𝖙.𝖑𝖎𝖓𝖊| và |𝖙.𝖑𝖎𝖓𝖊\n\✐| sẽ hiển thị được số phần trăm tính từ khi điểm RSI phá vỡ đến RSI hiện tại(đóng cửa)
Cột |𝚍𝚒𝚟| là tín hiệu phân kì . Khi giá tạo đỉnh mới, đáy mới mà RSI báo tín hiệu là phân kì thì nó sẽ bắt đầu cơ số đếm từ số 1 tăng dần lên.Từ đây Trader sẽ biết được cặp giao dịch nào đang bắt đầu phân kì RSI. Ô màu xanh là phân kì tăng, ô màu đỏ là phân kì giảm
- Cột| 🆁🆂🅸 | là RSI hiện tại .{🟢} RSI trên mây , {🔴} RSI dưới mây , {⚪️} RSI trong mây(Mây của RSI cũng cho biết rất tốt vùng hỗ trợ, kháng cự của RSI)
- Có 5 chức năng cảnh báo trên chỉ báo này
- Thông số {20:2} là độ dài đường trendline RSI và kết hợp cùng thông số với chỉ báo "RSI - trendlines - div{vn}" khi phân tích
💥 Tổng kết:
Các phương pháp giao dịch với chỉ báo này:
+ Giao dịch khi có phân kì.
+ Giao dịch khi RSI tiếp cận đến đường xu hướng của nó(nó là đường hỗ trợ, kháng cự của RSI).
+ Giao dịch khi RSI phá vỡ đường xu hướng(trên hoặc dưới cách dứt khoát).
+ Giao dịch khi có phân kì sau đó qua vài nến, RSI phá vỡ qua đường xu hướng của nó báo hiệu tín hiệu vàng.
Lưu ý : Chỉ báo tạo được tối đa 40 cặp giao dịch, nên AE trader Việt cứ chọn tín hiệu siêu đẹp để vào lệnh nhé.
Tìm kiếm tập lệnh với "ichimoku"

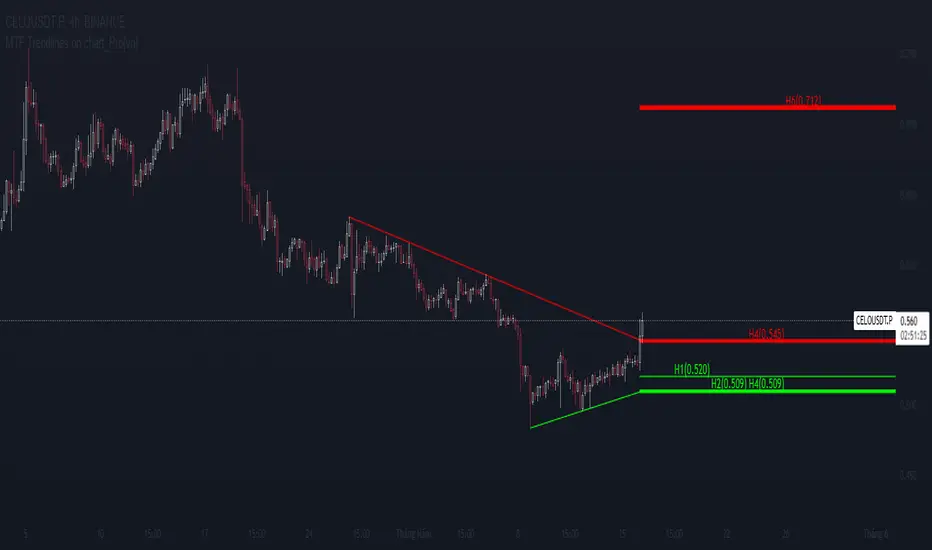
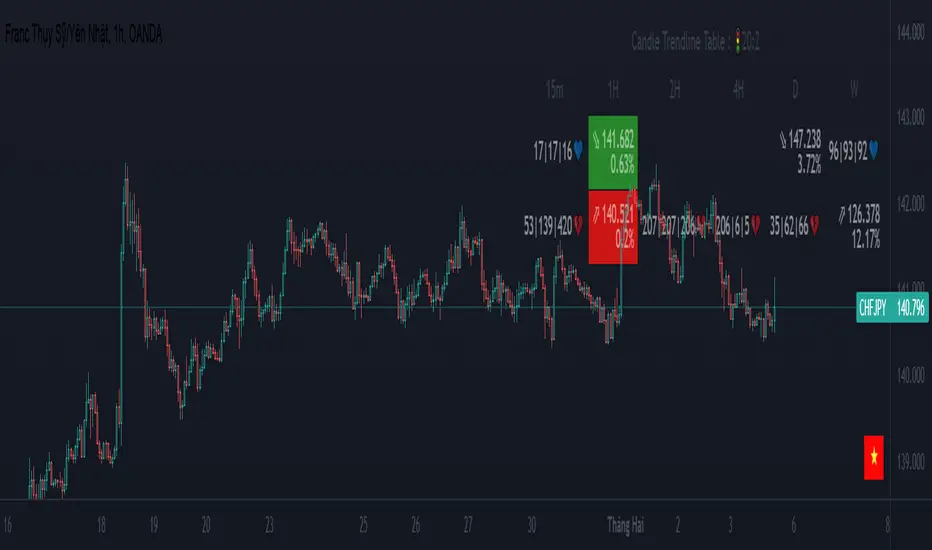
MTF Trendlines on chart_Pro[vn]Hello Traders .
👉This is an indicator of the trendlines in the analysis series with my trendlines.
- It statistics the upper and lower trend lines of the current Time Frame.
- Pine Script strategy draws pivot points and trendlines on the chart.
- This strategy allows the user to specify the interval to calculate the pivot points and the number of pivot points used to generate the trend lines.
- In the process of trading with the trendline, I see different timeframes showing each trendline differently, many times the trendline in the 15m frame has been broken but I don't know where the price is going, and it takes a lot of time to find support points, resistance to entry or take profit, So I came up with the idea of drawing different timeframes on the same chart in a specified timeframe, and I found it shortened the time to find support and resistance points in trading without having to switch back and forth between timeframes.
- For example, when the H1 trendline breaks downwards, we can determine a high probability that the price will be supported by the trendlines below it. for us to find entry points or exit orders effectively. Or when the price breaks the H1 trendline to go up, the chart shows us the trend lines above that broken H1 line so that we have a more effective entry or take profit point because it is a resistance zone....
- It can shows 7 pairs of trendlines during different times in the chart.
- each timeframe will display two trendlines, one up, and one down.When the price crosses a trendline, only one valid trendline is displayed, while the line crossed is not displayed.
- The upper trendline (down trend) is a red horizontal line, with the timeframe name and the value of its trendline, for example 4H(1.234) means timeframe = H4, the current value of the trendline is 1.234.
- The trendline below (up trend) is the blue horizontal line that also represents the same value as the line above.
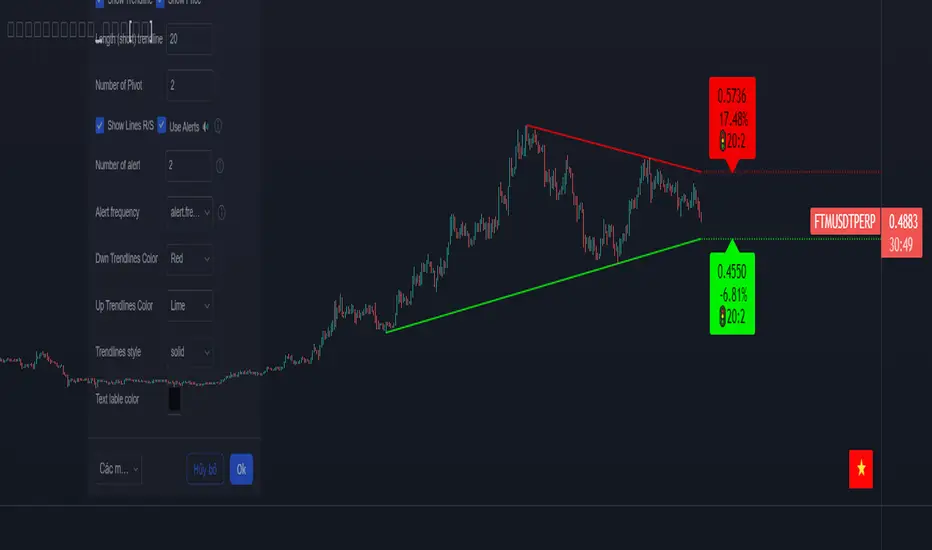
- In the Settings section, up to 6 different timeframes can be selected to display those trendlines on the chart.
- Small timeframes such as m1, m3, m5 or D1 I leave the default (cannot be changed) in the 'Length' setting = 50, timeframe is H6, H8, H12 'Length' = 30, the rest of the time can be changed, the default is 20 ...
- Some cases I have applied with this indicator to look for entry points and take profit ...
Xin chào Trader Việt nam.
- Đây là chỉ báo về các đường xu hướng trendline trong chuỗi phân tích với đường xu hướng của tôi. Chỉ báo này là muti trendlines trên biểu đồ , nó hiển thị được tối da 7 cặp đường xu hướng trong các thời gian khác nhau trên 1 biểu đồ.Dựa vào đó các trader có cái nhìn trực quan nhất không phải thay đổi qua lại các thời gian để tìm các đường trendlines, và có thể tìm được những cú hồi hoặc phá ngưỡng để vào lệnh hoặc chốt lời .
- Thực ra trong quá trình giao dịch với đường xu hướng, tôi thấy các khung thời gian khác nhau thì hiển thị mỗi đường xu hướng khác nhau, nhiều khi đường xu hướng trong khung 15m đã bị phá nhưng không biết giá đi đến đâu, và mất rất nhiều thời gian để tìm các điểm hỗ trợ, kháng cự để vào lệnh hoặc chốt lời, nên tôi nảy ra ý tưởng vẽ ra các khung thời gian khác nhau trên cùng 1 biểu đồ trong một khung thời gian được chỉ định, và tôi thấy rút ngắn được thời gian để tìm các điểm hõ trợ , kháng cự trong giao dịch mà không cần phải chuyển qua lại giữa các khung thời gian .
- Chẳng hạn ,khi đường xu hướng H1 bị phá vỡ xuống dưới thì ta có thể xác định được khả năng cao giá sẽ được hỗ trợ bởi những đường xu hướng bên dưới nó. để ta tìm điểm vào lệnh hoặc thoát lệnh cho hiệu quả.Hoặc khi giá phá vỡ đường xu hướng H1 để đi lên , thì trên biểu đồ đã hiện cho ta các đường trendline bên trên đường H1 bị phá vỡ đó để ta có điểm vào hoặc chốt lời hiệu quả hơn vì đó là vùng kháng cự....
- Đường xu hướng bên trên(down trend) là đường kẻ ngang màu đỏ ,có kèm tên timeframe và giá trị của đường xu hướng của nó,ví dụ 4H(1.234) nghĩa là timeframe=4H, giá trị hiện tại đường trendline là 1.234.
- Đường xu hướng bên dưới (up trend) là đường ngang màu xanh cũng thể hiện giá trị như đường bên trên.
- Các timeframe nhỏ như 1m, 3m, 5m hoặc 1D tôi để mặc định (không thay đổi được) trong setting mục 'Length' = 50, timeframe là 6H,8H,12H 'Length' = 30, các thời gian còn lại có thể thay đổi được ,mặc định là 20
- Để điều chỉnh có thể vào setting để thiết lập các thời gian theo nhu cầu.
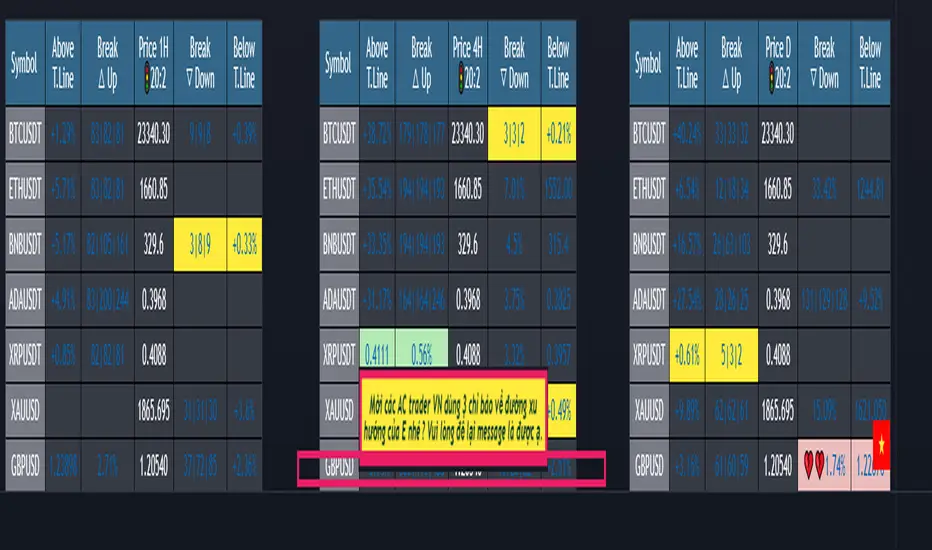
{20}Dashboard RSI-trendlines_Pro[vn]👉 Here is a script of 20 trading pairs scanner with RSI trendline.
-On each chart of the trading pair, there is only 1 trendline pair that comes closest to the RSI: 1 uptrendline and 1 downtrend line.
-So when the statistics on the table also show the column of the uptrend and the column of the downtrend
-When the RSI approaches any trendline and the ratio is 10%, the trendline will be colored blue (downtrend) and red (uptrend).
-Column ✎ T.line-trendline above (✐ T.line-trendline below) is the value of the current trendline compared to RSI
-Column \n\𝖗𝖊𝖘𝖎𝖘𝖙𝖆𝖓(𝖘𝖚𝖕𝖕𝖔𝖗𝖙\n\══════) when RSI breaks trendline will show 1|1|1 ( first candle) and percentage value when breaking through the point of the trendline. This is a good signal for us to consider trading with the RSI line
-The parameter when breaking shows 10|10|10, it means that the price has broken 10 candles (RSI candles), and the first 10 candles are colored yellow, then it will be
hidden. (can be changed in settings) put)
-Also, when displaying the parameters and yellow color of the box as above, the column next to it (above/below T.line) will show the percentage from when RSI broke that
point to the current price of the candle.
-The RSI column is the current of the candle and the 20:2 parameter is the RSI trendline length and to combine the same parameters with the "RSI - trendlines - div "
indicator.
-The time can be changed in the Resolution indicator setting to show multiple time arcs.
-The up arrow symbols represent the price breaking upwards, the down arrow showing the price breaking downwards
Thank you everyone for your interest and trust
-----------------------------------------------------------------------------
Vietnamese
👉 Đây là script về máy quét 20 cặp giao dịch với đường trendline của RSI .
-Trên mỗi biểu đồ của cặp giao dịch chỉ tồn tại duy nhất 1 cặp trendline đi sát nhất với RSI là: 1 trendline tăng và 1 trendline giảm
-Vì vậy khi thống kê trên bảng cũng hiển thị cột của trend tăng và cột của trend giảm
-Khi RSI tiến gần đến 1 đường trendline bất kì mà tỉ lệ còn 10% thì đường trendline đó tô màu xanh(trend giảm) ,màu đỏ(trend tăng)
-Cột ✎ T.line-đường trendline bên trên(✐ T.line-đường trendline bên dưới) là giá trị của đường trendline hiện tại so với RSI
-Cột ══════\n\𝖗𝖊𝖘𝖎𝖘𝖙𝖆𝖓(𝖘𝖚𝖕𝖕𝖔𝖗𝖙\n\══════) khi RSI phá vỡ trendline sẽ thể thiện 1|1|1 (tức là cây nến đầu tiên) và giá trị phần trăm khi phá qua điểm của trendline.Đây là tín hiệu tốt để ta xem xét giao dịch với đường RSI
-Thông số khi phá vỡ hiển thị 10|10|10 thì hiểu là giá đã phá vỡ 10 nến(nến RSI), và 10 nến đầu tiên được tô màu vàng ,sau đó sẽ bị ẩn.(có thể thay đổi trong cài đặt)
-Ngoài ra khi hiện thông số và màu vàng của ô như trên thì cột bên cạnh (above/below T.line) sẽ hiển thị được số phần trăm tính từ khi RSI phá vỡ điểm đó đến giá hiện tại của cây nến.
-Cột RSI là hiện tại của nến và thông số 20:2 là độ dài đường trendline RSI và để kết hợp cùng thông số với chỉ báo "RSI - trendlines - div "
-Có thể thay đổi thời gian trong cài đặt chỉ báo Resolution để hiển thị nhiều cung thời gian.
-Các biểu tượng mũi tên lên 🡹 thể hiện giá phá vỡ lên trên, mũi tên xuống 🡻 thể hiện giá đã phá vỡ xuống dưới
Cảm ơn mọi người đã quan tâm và tin dùng

RSI - trendlines - div[vn]This is an indicator for traders of trendline analysis with RSI (the formula for calculating RSI I don't mention here anymore because every trader knows it)
-
The Pine Script strategy plots pivot points and trendlines on the RSI chart.
This strategy allows the user to specify the interval for calculating the pivot points and the number of pivot points used to generate the RSI trendlines.
As all traders know, the RSI line closely follows the actual price line, it is an indicator of momentum, the RSI often tells us the direction of the price line in advance, it often precedes and goes along with the price.
RSI is one of the indicators that predicts price trends very well when it crosses its trendline (except in case of divergence).
On the chart of the RSI indicator, I only show 2 trendlines closest to the RSI (1 increase, 1 decrease) and the trend lines far away from me are hidden so that traders can focus on observing better.
When an uptrend line of RSI (or a decrease of RSI) is drawn according to the settings in the settings of the indicator, then that line is support and resistance so that we can proceed to make a BUY or SELL point according to the indicator. RSI support and resistance strategy
When the RSI line breaks above the definitive uptrend line or breaks below the trendline definitively, the price signals a reversal to the nearest trendline.
When the RSI breaks the downtrend line of the RSI (definitively), it signals that the price has a high probability of reversing or approaching the nearest resistance area or possibly reversing from bearish to bullish.
When the RSI breaks the uptrend line of the RSI (definitively), it signals that the price is likely to reverse or reach the nearest resistance area or it may reverse from bullish to bearish.
In addition, I have integrated the normal divergence function of RSI for traders to use in case of divergence - combined with trendline to identify trend reversal more clearly.
-------------------------------------------------------------------------------------------------------
Vietnamese
-Đây là chỉ báo dành cho các trader thuộc trường phái phân tích đường xu hướng với RSI(công thức tính RSI tôi không nhắc ở đây nữa vì mọi trader đều biết)
-Chiến lược Pine Script vẽ các điểm trục và đường xu hướng trên biểu đồ RSI.
-Chiến lược này cho phép người dùng chỉ định khoảng thời gian tính toán các điểm xoay và số điểm xoay được sử dụng để tạo các đường xu hướng của RSI.
-Như các Trader đều biết đường RSI bám sát thực tế với đường giá, nó là chỉ báo về động lượng ,RSI nhiều khi cho chúng ta "biết trước" được hướng đi của đường giá, nó thường đi trước và đi cùng với giá
-RSI là một trong những chỉ báo dự đoán xu hướng giá rất tốt khi cắt đường xu hướng của nó (chỉ trừ trường hợp phân kì)
-Trên biểu đồ của chỉ báo RSI tôi chỉ đưa ra 2 đường trendline gần với đường RSI nhất (1 tăng , 1 giảm)còn các đường xu hướng cách xa tôi đều để ẩn để các Trader tập chung quan sát tốt hơn
-Khi đường xu hướng tăng của RSI (hoặc giảm của RSI) được vẽ ra theo các thiết lập trong cài đặt của chỉ báo,thì đường đó là hỗ trợ,kháng cự để ta có thể tiến hành thực hiện điểm BUY hoặc SELL theo chiến lược hỗ trợ và kháng cự của RSI
-Khi đường RSI mà phá vỡ lên trên đường xu hướng tăng dứt khoát hoặc phá xuống dưới đường xu hướng cách dứt khoát thì giá báo hiệu sắp đảo chiều ngược với đường xu hướng gần nhất
-Khi RSI phá vỡ đường xu hướng giảm của RSI (cách dứt khoát) thì báo hiệu sắp tới giá có khả năng cao sẽ đảo chiều hay tiến tới vùng kháng cự gần nhất hay có thể đảo chiều từ giảm thành tăng
-Khi RSI phá vỡ đường xu hướng tăng của RSI (cách dứt khoát) thì báo hiệu sắp tới giá có khả năng cao sẽ đảo chiều hay tiến tới vùng kháng cự gần nhất hay có thể đảo chiều từ tăng thành giảm
-ngoài ra tôi có tích hợp thêm vào công cụ chức năng phân kì thường của RSI để trader dùng trong trường hợp phân kì - kết hợp với đường trendline để xác định xu hướng đảo chiều rõ ràng hơn

{20}Dashboard Trendlines & Wedge_Pro[vn]This is a script about 20 trading pairs with trendline.
-on each chart of a trading pair, there is only one trendline pair: 1 uptrendline and 1 downtrendline
-so when the statistics on the table also show the column of the uptrend and the column of the downtrend
-When the price approaches any trendline but the ratio is 1%, that trendline will be colored blue (downtrend), red (uptrend)
The column ✎ T.line-trendline above(✐ T.line-trendline below) is the value of the current trendline compared to the closing price of the candle
The ══════\n\𝖗𝖊𝖘𝖎𝖘𝖙𝖆𝖓(𝖘𝖚𝖕𝖕𝖔𝖗𝖙\n\══════) column when the price breaks will show ➊ (the is the first candle) and the percentage value when breaking through the point of the trendline.
Especially when a candle has closed above the trendline (assuming an uptrend), then from the 2nd tree to the current , it will count according to memory so that traders know when the price broke, and how many candles already.
The parameter when breaking is displayed < 10, it means that the price has broken through 10 candles, and the first 10 candles are colored yellow, then the color returns to normal.
In addition, when displaying 3 parameters as above, the next column (above/below T.line) will display the percentage from when the price breaks that point to the current price of the candle.
Wedge column is when the price is stuck between the upper and lower trendlines, if the sharp angle ratio is <=10%, the new column will show the value (and the text color is white) until it breaks to the bottom. 1 direction is left is hidden
Price column is the current price of the candle and the parameter 20:2 is the length of the trendline and to combine the same parameter with the indicator "Trendlines_pro "
You can change the time in Resolution indicator settings to show multiple time display the same cell as the price cell
The up arrow icons 🡹 represent the price broke upwards , the down arrows 🡻 represent the price broke below
------------------------------------------------------------------------------------------------------------------------------------------------------
Vietnamese
Đây là script về bảng thống kê 20 cặp giao dịch với đường trendline .
-trên mỗi biểu đồ của cặp giao dịch chỉ tồn tại duy nhất 1 cặp trendline là: 1trendline tăng và 1 trendline giảm
-vì vậy khi thống kê trên bảng cũng hiển thị cột của trend tăng và cột của trend giảm
-khi giá tiến gần đến 1 đường trendline bất kì mà tỉ lệ còn 1% thì đường trendline đó tô màu xanh(trend giảm) ,màu đỏ(trend tăng)
-cột ✎ T.line-đường trendline bên trên(✐ T.line-đường trendline bên dưới) là giá trị của đường trendline hiện tại so với giá đóng cửa của nến
-cột ══════\n\𝖗𝖊𝖘𝖎𝖘𝖙𝖆𝖓(𝖘𝖚𝖕𝖕𝖔𝖗𝖙\n\══════) khi giá phá vỡ sẽ thể thiện ➊(tức là cây nến đầu tiên) và giá trị phần trăm khi phá qua điểm của trendline.
-đặc biệt khi 1 cây nến đã đóng cửa trên đường trendline(giả sử trend tăng) thì từ cây thứ 2 đến hiện tại nó sẽ đếm theo bộ nhớ để các trader biết được giá đã phá khi nào,và qua bao nhiêu nến rồi.
-thông số khi phá vỡ hiển thị < 10 thì hiểu là giá đã phá vỡ qua 10 nến, và 10 nến đầu tiên được tô màu vàng ,sau đó màu trở lại trạng thái bình thường
-ngoài ra khi hiện thông số như trên thì cột bên cạnh (above/below T.line) sẽ hiển thị được số phần trăm tính từ khi giá phá vỡ điểm đó đến giá hiện tại của cây nến.
-cột Wedge(cái nêm) là khi giá đang bị kẹt giữa 2 đường trendline trên và dưới ,nếu tỷ lệ góc nhọn <=10% thì cột đó mới hiện giá trị (và màu chữ là trắng) cho đến khi phá vỡ về 1 hướng nào đó còn lại là bị ẩn
-cột giá là giá hiện tại của nến và thông số 20:2 là độ dài đường trendline và để kết hợp cùng thông số với chỉ báo "Trendlines_pro "
-các bạn có thể thay đổi thời gian trong cài đặt chỉ báo Resolution để hiển thị nhiều cung thời gian hiển thị cùng ô với ô giá
-các biểu tượng mũi tên lên 🡹 thể hiện giá phá vỡ lên trên ,mũi tên xuống 🡻 thể hiện giá đã phá vỡ xuống dưới
Cảm ơn mọi người đã quan tâm và tin dùng

𝕋𝕣𝕖𝕟𝕕𝕝𝕚𝕟𝕖𝕤[𝕧𝕟]-This is an indicator for trendline traders
-Pine Script strategy draws pivot points and trendlines on the chart.
-This strategy allows the user to specify the interval to calculate the pivot points and the number of pivot points used to generate the trend lines .
-when an up (or down) trendline is drawn according to the settings in the indicator's settings, that line is support and resistance so we can proceed to make BUY or SELL points according to the support strategy. and resistance
-when the price line breaks above or below the trendline, the price has reversed to the nearest trendline (like the examples in the pictures below.)
-The horizontal lines of the trend line , after being broken, it will form a support or resistance area , and it is likely that the price will retest that area to continue following the broken trend.
-----------------------------------------------------------------------------------
Vietnamese
-Đây là chỉ báo dành cho các trader thuộc trường phái phân tích đường xu hướng
-Chiến lược Pine Script vẽ các điểm trục và đường xu hướng trên biểu đồ.
-Chiến lược này cho phép người dùng chỉ định khoảng thời gian tính toán các điểm xoay và số điểm xoay được sử dụng để tạo các đường xu hướng .
-khi đường xu hướng tăng(hoặc giảm) được vẽ ra theo các thiết lập trong cài đặt của chỉ báo,thì đường đó là hỗ trợ,kháng cự để ta có thể tiến hành thực hiện điểm BUY hoặc SELL theo chiến lược hỗ trợ và kháng cự
-khi đường giá mà phá vỡ lên trên hoặc xuống dưới đường xu hướng thì giá đã đảo chiều ngược với đường xu hướng gần nhất (như các ví dụ trong các hình dưới đây.)
-Những đường nằm ngang của đường xu hướng sau khi bị phá vỡ nó sẽ hình thành cho ta là vùng hỗ trợ hoặc kháng cự mà rất có thể giá sẽ kiểm tra lại vùng đó để tiếp tục theo xu hướng bị phá vỡ.
here are some pictures when using this trendline indicator(dưới đây là một số hình ảnh khi dùng với chỉ báo trendline này)
---------------------------------------------------------------------------------------------------------------------------------------------------
*break above trendline to form an uptrend(phá vỡ đường trendline bên trên để hình thành xu hướng tăng giá)
*Break the below trendline to form a downtrend(phá vỡ đường trendline bên dưới để hình thành xu hướng giảm giá)
*Support and resistance areas are created by two rising and falling trendlines(Vùng hỗ trợ,kháng cự được tạo ra bởi 2 đường trendline tăng và giảm)
*price is stuck between 2 up and down trendlines (wedge pattern)
giá đang bị kẹt giữa 2 đường trendline tăng và giảm(mô hình cái nêm)
*Adjust the length ,short parameters of the trendline(điều chỉnh độ dài ,ngắn các thông số của đường xu hướng)
- for the "Full Trend Lines" script, please visit the following page🎯🎯🎯:

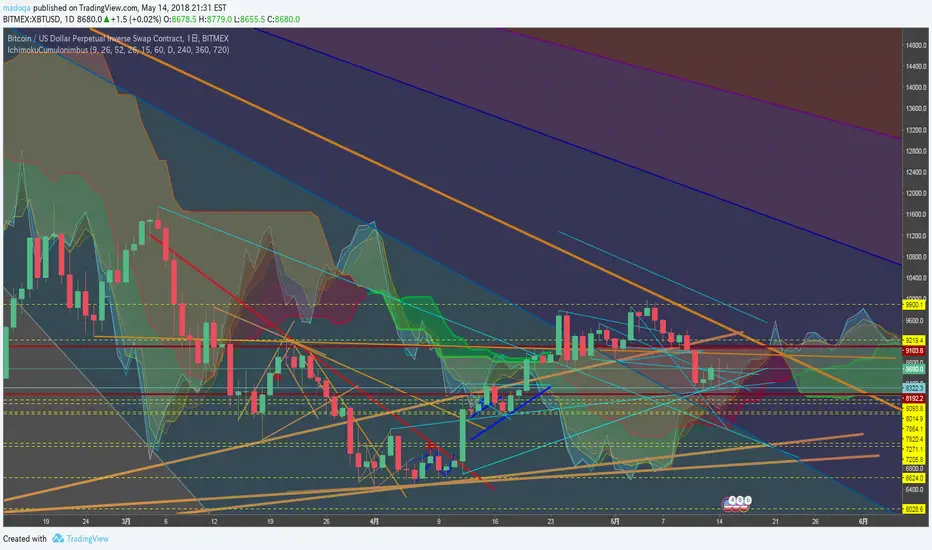
MTF Trendlines_Pro[vn]-This is an indicator for trendline traders
-it statistics the upper and lower trend lines of the Multi Time Frame.
-Pine Script strategy draws pivot points and trendlines on the chart.
-This strategy allows the user to specify the interval to calculate the pivot points and the number of pivot points used to generate the trend lines.
-I use the "Trendlines_Pro " indicator to interpret the indicator "MTF trendlines_Pro " indicator for everyone to understand
-time frames are selected in settings like 1m,3m,15m,1h,2h,4h,6h,12h,1D.1W.1Month..
-If the price is in a wedge pattern, it is represented by the upper and lower parameters, the upper parameter is the resistance point of the upper trendline,the lower parameter is the support point of the below trendline
-when the price distance is <=1% from the trendline, the upper or lower parameter is colored blue (above) or red (below).
-when only the parameter is accompanied by the ⇗ or ⇘. symbol, it tells us that the price has not broken the corresponding trend line
-when showing green heart and % break .indicates that the price has broken the downtrend line to become an uptrend.
On the contrary, the red heart % breaks, it signals us to break the uptrend line to become a downtrend
-when showing parameters 12(1)|18(2)|20(3) and green heart, then :(3) shows that the price has broken out before 20 candles, (2) shows that there are 18 candles to close above The breakout point, (1) represents the last 12 candles that closed above the breakout point and as if a nice uptrend has occurred because 98% of the candles have closed above the breakout point....the opposite of The red heart is the price that broke below the trendline below.
-"MTF trendlines_Pro "indicator is integrated for both the trendline of the price line and the RSI. You can change it in the settings as shown below.
----------------------------------------------------------------------------
vietnamese
-Đây là chỉ báo dành cho các trader thuộc trường phái phân tích đường xu hướng
-nó thống kê các đường xu hướng trên và dưới của Multi Time Frame.
-Chiến lược Pine Script vẽ các điểm trục và đường xu hướng trên biểu đồ.
-Chiến lược này cho phép người dùng chỉ định khoảng thời gian tính toán các điểm xoay và số điểm xoay được sử dụng để tạo các đường xu hướng .
-tôi có dùng chỉ báo trendline_pro dùng để diễn giải chỉ báo MTF trendlines_pro cho mọi người dễ hiểu
-các khung thời gian được lựa chọn trong cài đặt như 1m,3m,15m,1h,2h,4h,6h,12h,....
-Nếu giá đang trong mô hình cái nêm thì được thể hiện bằng tham số trên và tham số dưới, tham số trên là điểm kháng cự của đường xu hướng bên trên,tham số dưới là điểm hỗ trợ của đường xu hướng bên dưới
-khi giá cách đường xu hướng <=1% thì tham số trên hoặc dưới được tô màu xanh (trên) hoặc đỏ(dưới)
-khi chỉ có tham số kèm theo biểu tượng ⇗ or ⇘.thì cho ta biết là giá chưa phá vỡ được đường xu hướng tương ứng
-khi hiện trái tim xanh và % phá vỡ .báo hiệu cho ta biết giá đã phá vỡ đường xu hướng giảm trở thành xu hướng tăng.
ngược lại trái tim đỏ % phá vỡ thì báo hiệu cho ta phá vỡ đường xu hướng tăng trở thành xu hướng giảm
-khi hiện thông số 12(1)|18(2)|20(3) và trái tim xanh thì :(3) thể hiện giá đã phá vỡ trước đó 20 nến,(2) thể hiện có 18 cây nến đóng cửa trên điểm phá vỡ,(1) thể hiện có 12 nến gần nhất đóng cửa trên điểm phá vỡ và như vạy xu hướng tăng đẹp đã xảy ra vì chiếm đến 98% nến đã đóng cửa trên điểm phá vỡ....ngược lại với trái tim đỏ là giá đã đột phá xuống dưới đường xu hướng bên dưới
-chỉ báo MTF trendlines_pro được tích hợp chung cho cả trendline của đường giá và RSI .các bạn có thể thay đổi trong phần cài đặt như hình bên dưới.
Trendlines_Pro[vn]- This is an indicator for trendline traders
-Pine Script strategy draws pivot points and trendlines on the chart.
-This strategy allows the user to specify the interval to calculate the pivot points and the number of pivot points used to generate the trend lines.
-when an up (or down) trendline is drawn according to the settings in the indicator's settings, that line is support and resistance so we can proceed to make BUY or SELL points according to the support strategy. and resistance
-when the price line breaks above or below the trendline, the price has reversed to the nearest trendline (like the examples in the pictures below.)
-The horizontal lines of the trend line, after being broken, it will form a support or resistance area, and it is likely that the price will retest that area to continue following the broken trend.
Vietnamese
-Đây là chỉ báo dành cho các trader thuộc trường phái phân tích đường xu hướng
-Chiến lược Pine Script vẽ các điểm trục và đường xu hướng trên biểu đồ.
-Chiến lược này cho phép người dùng chỉ định khoảng thời gian tính toán các điểm xoay và số điểm xoay được sử dụng để tạo các đường xu hướng .
-khi đường xu hướng tăng(hoặc giảm) được vẽ ra theo các thiết lập trong cài đặt của chỉ báo,thì đường đó là hỗ trợ,kháng cự để ta có thể tiến hành thực hiện điểm BUY hoặc SELL theo chiến lược hỗ trợ và kháng cự
-khi đường giá mà phá vỡ lên trên hoặc xuống dưới đường xu hướng thì giá đã đảo chiều ngược với đường xu hướng gần nhất (như các ví dụ trong các hình dưới đây.)
-Những đường nằm ngang của đường xu hướng sau khi bị phá vỡ nó sẽ hình thành cho ta là vùng hỗ trợ hoặc kháng cự mà rất có thể giá sẽ kiểm tra lại vùng đó để tiếp tục theo xu hướng bị phá vỡ.
(1-20)Dashboard trendlines PriceThis is a script about 20 trading pairs with trendline.
-on each chart of a trading pair, there is only one trendline pair: 1 uptrendline and 1 downtrendline
-so when the statistics on the table also show the column of the uptrend and the column of the downtrend
-When the price approaches any trendline but the ratio is 1%, that trendline will be colored blue (downtrend), red (uptrend)
-the column above T.line(below T.line) is the value of the current trendline compared to the closing price of the candle
-The Break up (Break down) column when the price breaks will show the green heart (break up), the red heart break (break down) and the percentage value when breaking through the point of the trendline.
-price column is the current price of the candle
-especially when a candle has closed above the trendline (assuming an uptrend), then from the 2nd tree to the current , it will count according to memory so that traders know when the price broke, and how many candles already.
-The breakdown parameter is displayed (for example, 3|8|10), which means that the price has broken through 10 candles, of which 8 trees are closing above the breakout point, and the last 3 are closing above. break point
-In addition, when displaying 3 parameters as above, the next column (above/below T.line) will display the percentage from when the price breaks that point to the current price of the candle.
-you can change the time in Resolution indicator settings to show multiple time arcs
Thank you everyone for your interest and trust
- 5 pairs are free for traders :https://vn.tradingview.com/script/KGSjrLC3/
---------------------------------------------------------------------------------
Vietnamese
Đây là script về bảng thống kê 20 cặp giao dịch với đường trendline .
-trên mỗi biểu đồ của cặp giao dịch chỉ tồn tại duy nhất 1 cặp trendline là: 1trendline tăng và 1 trendline giảm
-vì vậy khi thống kê trên bảng cũng hiển thị cột của trend tăng và cột của trend giảm
-khi giá tiến gần đến 1 đường trendline bất kì mà tỉ lệ còn 1% thì đường trendline đó tô màu xanh(trend giảm) ,màu đỏ(trend tăng)
-cột above T.line(below T.line) là giá trị của đường trendline hiện tại so với giá đóng cửa của nến
-cột Break up(Break down) khi giá phá vỡ sẽ thể thiện trái tim xanh(phá vỡ lên),trái tim đỏ vỡ(phá vỡ xuống) và giá trị phần trăm khi phá qua điểm của trendline.
-cột giá là giá hiện tại của nến
-đặc biệt khi 1 cây nến đã đóng cửa trên đường trendline(giả sử trend tăng) thì từ cây thứ 2 đến hiện tại nó sẽ đếm theo bộ nhớ để các trader biết được giá đã phá khi nào,và qua bao nhiêu nến rồi.
-thông số khi phá vỡ hiển thị (ví dụ là 3|8|10) thì hiểu là giá đã phá vỡ qua 10 nến, trong đó có 8 cây đóng cửa trên điểm phá vỡ,và 3 cây gần nhất đang đóng cửa trên điểm phá vỡ
-ngoài ra khi hiện 3 thông số như trên thì cột bên cạnh (above/below T.line) sẽ hiển thị được số phần trăm tính từ khi giá phá vỡ điểm đó đến giá hiện tại của cây nến.
-các bạn có thể thay đổi thời gian trong cài đặt chỉ báo Resolution để hiển thị nhiều cung thời gian
Cảm ơn mọi người đã quan tâm và tin dùng


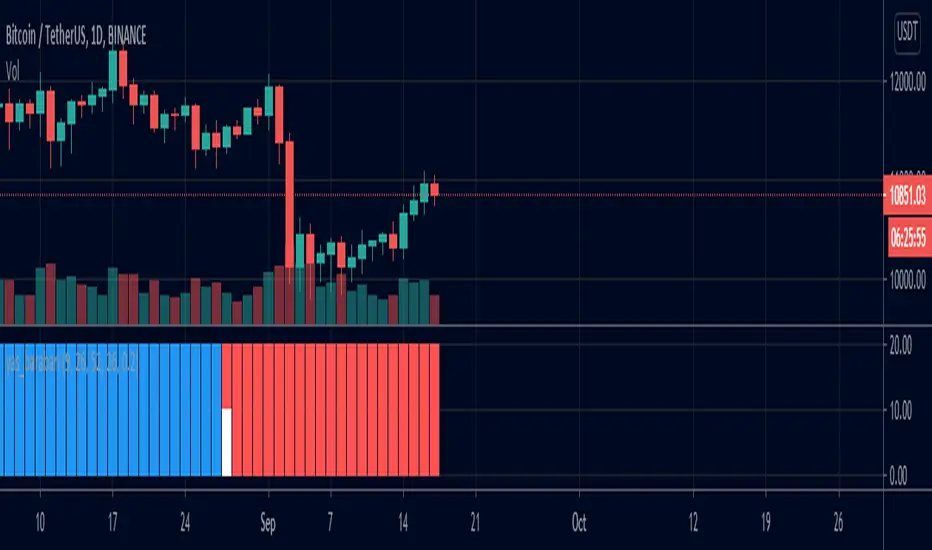
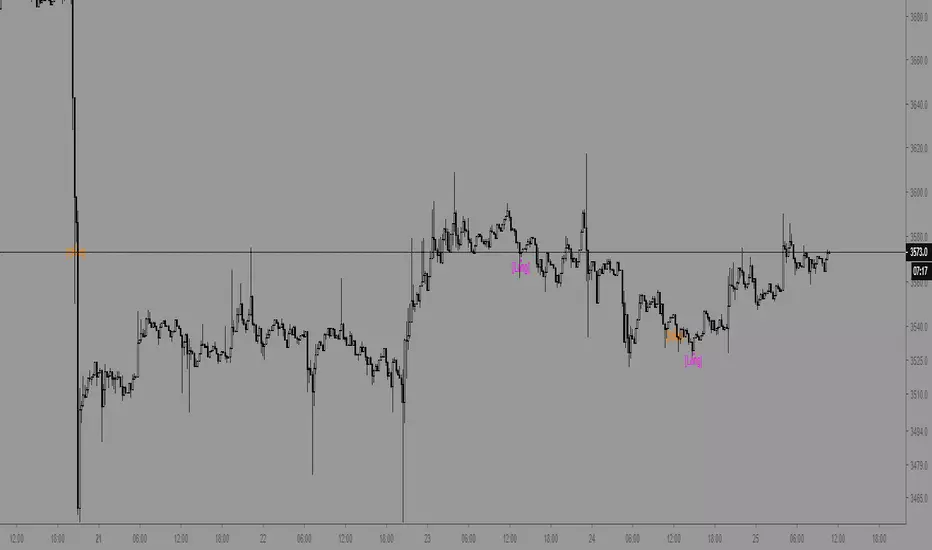
yas_barabariby this indicator u can find where the tenken-sen and kijen-sen is equal
yellow bar means the t/k is equal
red bar means tenken is under kijen-sen
blue bar means kijen is below tenken-sen
white bar on top means t+17 equal kijen-sen
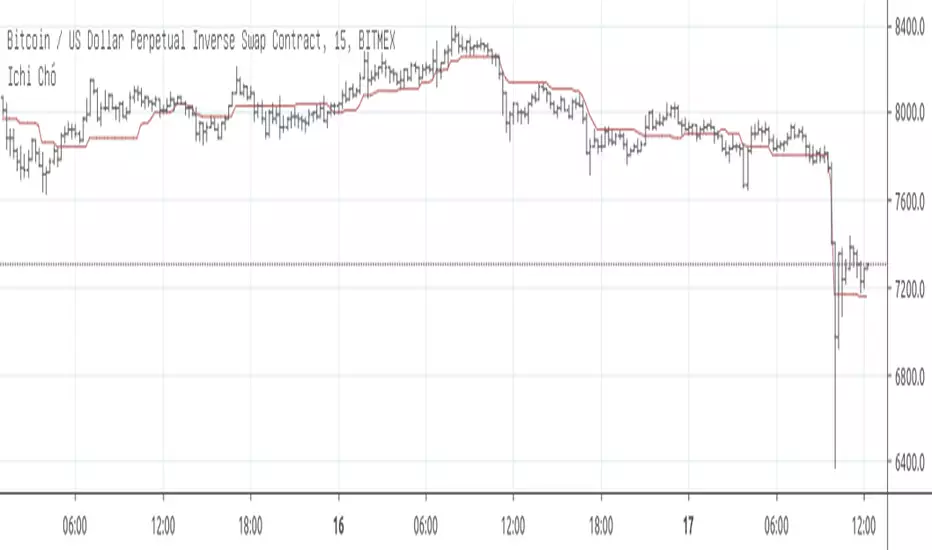
Ichi Chó IGIchi theo phương pháp của Chó bên nhóm IG.
Cho phép thiết lập 2 khung thời gian và chiều dài của Kijun tương ứng. Các khung giờ khác sử dụng Kijun mặc định.
Có thể sử dụng làm đường cơ bản để margin trên bitmex. Margin thì đừng quên stoploss nhé.
Tiếp nhận nhận góp ý của các bạn để update phương pháp.
Cảm ơn Chó đã chia sẻ.
Allie_Ichimoku Cloud-V1Inspired by CM_enhanced_ichimoku_cloud v5.
Adds weak/strong TK-cross detection which is indicated in the background and/or arrows.


kijunBase_Long_And_ShortBITMEX:XBTUSD
15 minutes
We recommend that you look at it with other indicator...
Tenkan Kijun Cross Alert Modified to alert on EqualsI wanted it to alert on equals not only on crossover


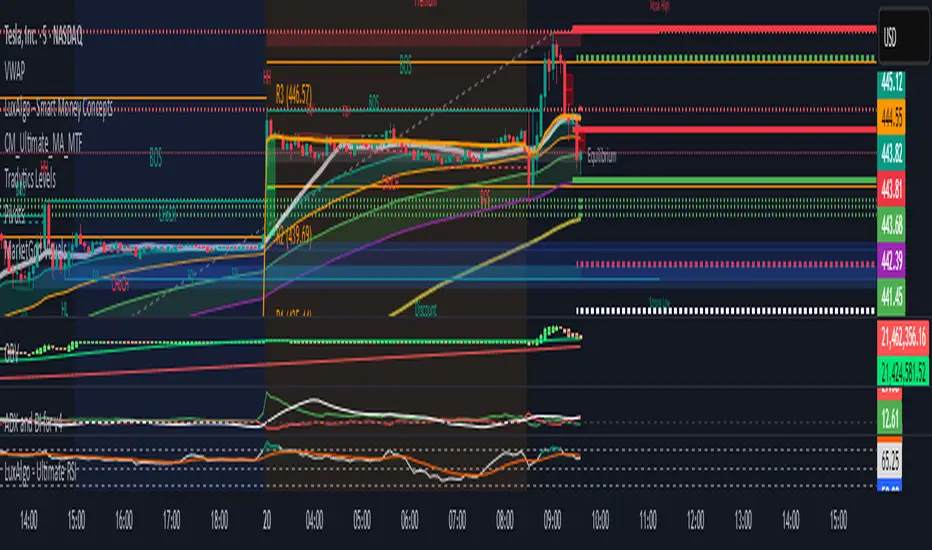
Tradytics Levels with EMA CloudThis indicator has tradytics price chart levels where you can put in the input code seen below.
The code has positive gamma (green lines), negative gamma (Red lines) and white dotted line are the darkpool levels.
This is Amazon's 5 minute from Sep30th to October 20th Gammas and weekly Darkpool levels. Just copy and paste code below in the input code and the chart would show the levels.
212.8*1*neutral 220.07*1*neutral 216.038*1*neutral 215.57*1*neutral 219.988*1*neutral 217.401*1*neutral 217.351*1*neutral 212.815*1*neutral 212.75*1*neutral 212.4*1*neutral 215*0*negative 222.5*0*positive 217.5*0*positive 220*0*positive
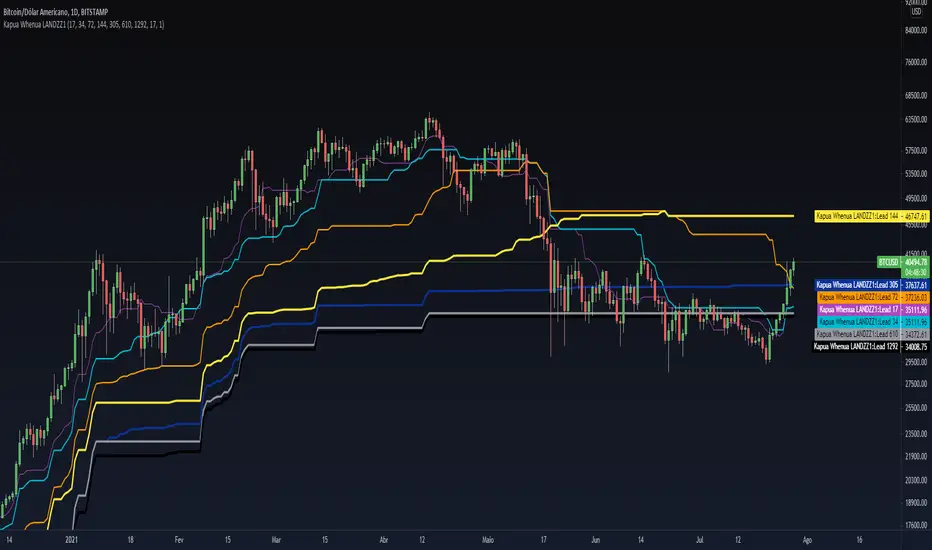
Kapua Whenua LANDZZ1Kapua Whenua means Earth's Clouds in Maori language, this indicator was created to show impulses and trends of the asset's price movement both up and down.
The Indicator was made based on key numbers of the golden ratio:
Conversion Line: Kw 17 (Purple Color)
Kw 34 - Short Period Fractal (Light Blue Color)
Kw 72 - Short/Medium Period Fractal (Orange)
Kw 144 - Medium Period Fractal (Yellow Color)
Kw 305 - Medium/Long Period Fractal (Dark Blue Color)
Kw 610 - Long Period Fractal (Grey)
Kw 1292 - Long Period Fractal+ (Black Color)
The baseline or also called the conversion line is identified by the Color Purple of value 17.
How to read the indicator:
Every time the conversion line (Purple Color 17 periods) crosses a Kw value (Kapua Whenua) it will always look for the next KW line above or below the value as support or resistance.
For example:
If we are in a bull market, and the price crosses below the KW17 conversion line it will go towards KW 34 as support, if the price breaks KW 34 it will go towards the next line below KW 34 as support.
Every time the conversion line or the price crosses a higher value of Kapua Whenua (KW) this trend will be stronger, it means, if the conversion line (KW 17) crosses above KW 305 it will indicate more strength than if it had crossed above the KW 72 or 144 for example. So to get better results trading with the trend, always observe if the conversion line and the price are below or above some Medium/Long Period KW.
Note also that, in an uptrend, it could be that all KW are below each other. In a downtrend, it could be that all KW are on top of each other. This indicates that the farther the price is from the fractals the stronger the trend is, also, when there is a narrowing of the fractals means that the price will start to go sideways. If the price is between 2 or more Fractals, it will indicate consolidation.
A really good trend is considered when the price or the Short/Medium Period Fractals are all above or below at KW 610, which is a long period fractal, meaning a strong uptrend or downtrend.
A larger KW can be at the same point as a smaller KW, however, the stronger color will be shown above the weaker one.
***Larger chart timeframes are better to see longer KW fractals that are above or below the price, if your chart timeframe doesn't show a bigger support or resistance fractal, change the chart time to another longer period**
Tip - Get used to looking at line colors as your indicators, just like moving averages. You can also take or place any fractal at any time in the configuration menu.