IFVG [#]ICT Concepts by shulktrades
Beginner Concept
IFVG — Inverse Fair Value Gap
Description:
The IFVG indicator identifies and displays Inverse Fair Value Gaps (IFVGs) — price imbalances that have been traded through and closed, representing a complete rebalancing of a prior Fair Value Gap (FVG).
It is designed for traders studying ICT-based market structure and algorithmic delivery concepts, offering a consistent, precise way to visualize these “flipped” gaps directly on their charts.
This indicator does not generate trading signals, alerts, or entries. It serves as a visual confluence and analytical tool, helping traders recognize when a fair value gap has been invalidated and transformed into an IFVG.
How It Works (Conceptually)
Gap Detection
The script tracks consecutive candle structures to identify FVGs — three-candle formations where a price void exists between the first and third candles.
Inverse Confirmation
When price fully closes through a detected FVG (meaning both gap boundaries have been traded and settled), the imbalance is flagged as neutralized, and the script converts it into an Inverse Fair Value Gap (IFVG).
Box Drawing Logic
Each IFVG is displayed as a visual box drawn from the displacement range of the candle that confirmed the closure.
Boxes extend either to the current bar or a user-defined candle limit, providing flexibility for how long historical IFVGs remain visible.
This ensures chart clarity while maintaining accurate visual context of algorithmic rebalancing.
Unique Implementation Features
The IFVG indicator differs from typical open-source FVG tools through its structural logic and visualization method:
Higher-Timeframe Candle Tracking
It can reference higher-timeframe (HTF) candle data to display IFVGs originating from larger structures (for example, showing H1 or H4 inverse gaps on a lower timeframe).
This alignment with HTF context gives traders a broader view of algorithmic delivery behavior.
Specific Timeframe Tracking (Future Integration)
The underlying framework supports selectable timeframe inputs for future updates, allowing users to define which candle data to track for IFVG formation — ensuring full adaptability across multiple timeframe models.
Dynamic End Conditions
Unlike static or persistent zone indicators, each IFVG box can end at the current time or after a custom candle limit.
This avoids overcrowding the chart while maintaining accurate historical context.
Accurate Visual Rendering
The drawing logic ensures that every IFVG box is aligned precisely to candle bodies and wicks, scaling correctly across all chart resolutions.
This eliminates overlap, offset, or visual drift common in generic FVG/IFVG implementations.
How to Use It
Apply the indicator to visualize confirmed Inverse Fair Value Gaps on your chart.
Use the highlighted zones as contextual confluence, not entry triggers.
Adjust settings for box duration and visibility according to your preferred analysis depth.
Integrate with other ICT-based concepts such as liquidity sweeps, order blocks, and displacement analysis for deeper structural insight.
Originality and Purpose
The IFVG indicator is original in its:
Strict focus on confirmed, traded-through FVGs only.
Use of HTF candle tracking for broader algorithmic context.
Dynamic end-of-zone control, determined by user preference or real-time progression.
Accurate visual construction of zones directly tied to candle confirmation logic.
These design choices make it distinct from generic FVG/IFVG indicators and justify its closed-source status, as its logic, rendering precision, and adaptive framework go beyond simple stylistic replication of public scripts.
Important Notes
For educational and analytical use only.
Does not issue alerts, entries, or trade recommendations.
Best suited for traders familiar with ICT delivery and structure concepts.
Always apply personal risk management and confirm bias independently.
Tìm kiếm tập lệnh với "imbalance"

Bitcoin CME gaps multi-timeframe auto finder1. Overview
The Bitcoin CME Gap Multi-Timeframe Detector automatically identifies price gaps in the Bitcoin CME (Chicago Mercantile Exchange) futures market and visually displays them on the TradingView chart.
Because the CME futures market closes for about an hour after each weekday session and remains closed over the weekend, price gaps frequently appear when trading resumes on Monday.
This indicator analyzes gaps across six major timeframes, from 5-minute to 1-day charts, allowing traders to easily identify structural imbalances and potential support/resistance zones.
It is the most accurate and feature-rich CME gaps indicator available on TradingView.
2. Key Features
■ Multi-Timeframe Gap Detection
Analyzes 5m, 15m, 30m, 1h, 4h, and 1D charts simultaneously.
This enables traders to observe both short-term volatility and mid-to-long-term structure, providing a multi-dimensional view of market dynamics.
■ Gap Direction Classification
Up Gap: When the next candle’s open is higher than the previous candle’s high (default color: green tone)
Down Gap: When the next candle’s open is lower than the previous candle’s low (default color: red tone)
Gaps are color-coded to intuitively visualize potential support and resistance zones.
■ Highlight Function
Gaps exceeding a user-defined threshold (%) are highlighted (default color: yellow).
This helps quickly identify zones with abnormal volatility or sharp price dislocations.
■ Labels and Box Extension
Each gap displays a percentage label indicating its relative size and significance.
Gap zones are extended to the right as boxes, allowing traders to visually track when and how the gap gets filled over time.
■ Alert System
When a gap forms on the selected timeframe (or across all timeframes), a TradingView alert is triggered.
This enables real-time response to significant gap events.
3. Trading Strategies
■ Gap Fill Behavior
CME gaps statistically tend to get filled over time.
Gap boxes help distinguish between filled and unfilled gaps at a glance.
Up Gap: Price tends to decline to fill the previous high–next open zone.
Down Gap: Price often rises later to fill the previous low–next open zone.
■ Support & Resistance Levels
Gap zones frequently act as strong support or resistance.
When price retests a gap area, observing the reaction of buyers and sellers can provide valuable trading insights.
Overlapping gap boxes across multiple timeframes indicate high-confidence support/resistance zones.
■ Market Sentiment & Volatility Analysis
Large gaps usually result from shifts in market sentiment or major news events.
This indicator allows traders to detect volatility spikes early and prepare for potential trend reversals.
■ Combination with Other Technical Tools
While fully functional on its own, this indicator works even better when combined with tools like moving averages (MA), RSI, MACD, or Fibonacci retracements.
For example, if the bottom of a gap coincides with the 0.618 Fibonacci level, it may signal a strong rebound zone.
4. Settings Options
Minimum Gap % | Sets the minimum percentage movement required to detect a gap (lower values show smaller gaps)
Display Timeframes | Choose which timeframes to display (5m, 15m, 30m, 1h, 4h, 1D)
Box Colors | Assign colors for up and down gaps
Box Extension (Bars) | Number of bars to extend gap boxes to the right
Show Labels | Toggle display of gap percentage labels
Label Position / Size | Adjust label position and size
Highlight Gap ≥ % | Highlight gaps exceeding a specified percentage
Highlight Colors | Set highlight color for labels and boxes
Enable Alerts | Enable or disable alerts
Alert Timeframe | Select timeframe(s) for alerts (“All” = all timeframes)
5. Summary
This indicator is a professional trading tool that provides quantitative and visual analysis of price gaps in the Bitcoin CME futures market.
By combining multi-timeframe detection, highlighting, and alert systems, it helps traders clearly identify zones of market imbalance and potential reversal areas.

Buyside & Sellside Liquidity The Buyside & Sellside Liquidity Indicator is an advanced Smart Money Concepts (SMC) tool that automatically detects and visualizes liquidity zones and liquidity voids (imbalances) directly on the chart.
🟢 Function and meaning:
1. Buyside Liquidity (green):
Highlights price zones above current price where short traders’ stop-loss orders are likely resting.
When price sweeps these areas, it often indicates a liquidity grab or stop hunt.
👉 These zones are labeled with 💵💰 emojis for a clear visual cue where smart money collects liquidity.
2. Sellside Liquidity (red):
Highlights zones below the current price where long traders’ stop-losses are likely placed.
Once breached, these often signal a potential reversal upward.
👉 The 💵💰🪙 emojis make these liquidity targets visually intuitive on the chart.
3. Liquidity Voids (bright areas):
Indicate inefficient price areas, where the market moved too quickly without filling orders.
These zones are often revisited later as the market seeks balance (fair value).
👉 Shown as light shaded boxes with 💰 emojis to emphasize imbalance regions.
💡 Usage:
• Helps spot smart money manipulation and stop hunts.
• Marks potential reversal or breakout zones.
• Great for traders applying SMC, ICT, or Fair Value Gap strategies.
✨ Highlight:
Dollar and money bag emojis (💵💰🪙💸) are integrated directly into chart labels to create a clear and visually engaging representation of liquidity areas.

Ultimate SMC Dashboard — Pro v2.1 (ICT/SMC)
🔍 1. General Objective of the Script
This script is a complete visual and algorithmic SMC (Smart Money Concepts) analysis system that:
* Automatically identifies market structures (BOS / CHoCH / Liquidity Grab).
* Detects and dynamically maintains Fair Value Gaps (FVG) according to ICT methodology .
* Draws and tracks the evolution of Order Blocks (OB) and Breaker Blocks (BRK) .
* Calculates MACD / Volume divergences .
* Analyzes trend, volume, and buyer/seller dominance .
* Displays a clear and dynamic dashboard directly on the chart.
* Builds the foundation for reversal / continuation probability models .
---
⚙️ 2. Input Parameters
The script is highly configurable. Inputs are organized by sections:
Structure (ICT)
* Pivot left/right (swing length) → determines the swing size for HH/LL detection.
* OB lookback → number of candles to look back for an Order Block after a BOS.
* Show BOS / CHoCH / Liquidity Grab → enables or disables structural elements.
Imbalances (FVG)
* Enables the display of Fair Value Gaps .
* Manages minimum size, transparency, and **dynamic reduction** when partially filled.
* Limits the maximum number of FVGs displayed simultaneously.
Order Blocks / Breakers
* Enables Order Blocks and Breaker Blocks .
* Defines their colors, opacity , and dynamic behavior .
* Automatically removes outdated OBs exceeding the maximum limit.
Signal & Probabilities
* Sets the lookback period for structure calculation.
* Calculates average volume (MA) to detect dominance and momentum.
* Defines the probability threshold for signals (not yet visible in this snippet).
RSI / EMA / Divergences / Sentiment
* Prepares additional indicator modules, such as:
* MACD divergence detection
* RSI / EMA visualization
* Market sentiment and funding metrics
---
🧠 3. Market Structure Logic (ICT Core)
a. Pivot Detection
Uses ta.pivothigh and ta.pivotlow to detect Higher Highs (HH) and Lower Lows (LL) .
b. Break of Structure (BOS)
A BOS occurs when price breaks a validated swing high or low:
* bullBOS → bullish break.
* bearBOS → bearish break.
c. Change of Character (CHoCH)
A CHoCH is detected when BOS direction changes (e.g., a bullish BOS followed by a bearish BOS).
d. Liquidity Grab
Detection of liquidity sweeps :
* grabUp : wick above the last high, closing below.
* grabDown : wick below the last low, closing above.
All these signals feed into the main trend bias (Bull / Bear / Flat).
---
🧱 4. Fair Value Gaps (FVG)
The FVG logic strictly follows ICT principles :
* Bullish FVG: if `low > high `
* Bearish FVG: if `high < low `
Each FVG becomes a dynamic box :
* Shrinks in real time as price partially fills it.
* Automatically deletes itself once fully closed.
* Color and opacity depend on direction (green = bullish, red = bearish).
This is one of the most complex parts of the code, managing:
* Arrays of box objects (`array`)
* Real-time updates for every candle
* Automatic cleanup to prevent chart overload
---
🧱 5. Order Blocks (OB) and Breaker Blocks
An Order Block is generated:
* After a BOS,
* By identifying the last candle opposite to the trend before the break.
Examples:
* Bullish BOS → Bullish OB = last red candle before the breakout.
* Bearish BOS → Bearish OB = last green candle before the breakdown.
Each OB:
* Is visualized as a colored rectangle (cyan or orange).
* Becomes inactive once mitigated (touched).
* Is removed and converted into a Breaker Block if invalidated (opposite side broken).
The system uses arrays similar to FVGs to maintain visual cleanliness and chart efficiency .
---
📊 6. Volume and Dominance
The script computes:
* A moving average (SMA) of volume.
* Whether the current volume is abnormally high or low .
* Whether candles are buyer- or seller-dominant .
Simplified display:
* 🔥 High Volume
* 📉 Low Volume
* 🟩 Buyers Dominant
* 🟥 Sellers Dominant
* ⚪️ Neutral
---
🧩 7. Textual Dashboard
Text variables such as:
* `struct_txt` → displays BOS, CHoCH, Grab info
* `fvg_txt` → “🟢 Open” or “🔴 Close”
* `ob_txt` → “🟩 Open” or “🟥 Close”
These feed a visual dashboard (not yet displayed in this excerpt), summarizing the entire market state in real time.
---
💡 8. Summary
The script:
* Observes market structure (ICT) .
* Automatically draws institutional imbalance and interest zones (OB, FVG).
* Dynamically manages their evolution.
* Provides visual structural, volume, and sentiment signals .
* Builds a complete foundation for a professional ICT/SMC dashboard .

Cumulative Hybrid Delta# 📊 CUMULATIVE HYBRID DELTA
## The Most Advanced Volume Delta Indicator for Crypto & Forex Traders
---
## WHAT IS IT?
**Cumulative Hybrid Delta** reveals **who is in control of the market** — buyers or sellers — in real-time. By analyzing volume imbalances and their accumulation over time, this indicator detects market pressure before price moves, giving you the edge you need.
**Stop guessing the market's direction. Start seeing it.**
---
## WHAT IT SHOWS
### 🟢 Buying Pressure
Green signals indicate accumulated buyer dominance. Watch for rising green accumulation in downtrends for reversal opportunities.
### 🔴 Selling Pressure
Red signals show accumulated seller control. Perfect for catching trend exhaustion and potential corrections.
### 💛 Cumulative Delta Line (Yellow)
The heart of the indicator. This line accumulates all delta pressure over your selected period. Rising = bullish momentum building. Falling = bearish pressure intensifying.
### 📊 Delta Bars
Individual bar pressure shown as histogram. Each bar tells you the exact buy/sell imbalance for that candle. Track momentum strength in real-time.
### 🕯️ Wick Analysis
Upper wicks show rejected resistance (seller pressure). Lower wicks reveal bounces from support (buyer pressure). Critical for spotting reversals before they happen.
### ⚡ Extreme Zones (Red & Green Lines)
Auto-calculated overbought and oversold levels. When delta enters these zones, market reversal becomes highly probable. Perfect for taking profits or entering counter-trades.
---
## WHY TRADERS LOVE IT
✅ **5 Hybrid Algorithms** - Switch between different delta calculation methods (Price Position, Wick-Corrected, Close-Open Ratio, Classic, or Full Hybrid)
✅ **Adaptive Technology** - Works perfectly on ANY timeframe and market condition (calm days, volatile days, crypto rallies, forex ranges)
✅ **Spot & Futures Ready** - Whether you trade Bitcoin spot on Binance or micro contracts, this indicator adapts seamlessly
✅ **Real-Time Alerts** - 5 automated alerts catch key turning points so you never miss a setup
✅ **Professional Dashboard** - Live metrics table shows bar delta, cumulative delta, wicks, zone status, and trend at a glance
✅ **Bilingual** - English and Russian interface. Switch languages in settings instantly
✅ **No Repainting** - Calculated from pure OHLCV data. Reliable backtesting. No fake signals
---
## KEY SETTINGS EXPLAINED
### 🧠 DELTA ALGORITHM (Core Feature)
- **Hybrid** (Recommended) - Combines price position (70%) + wick analysis (30%) for maximum accuracy
- **Price Position** - Pure price location in the range (simple & effective)
- **Wick Corrected** - Focuses on rejected pressure (great for reversals)
- **Close-Open** - Traditional bar momentum
- **Classic** - Standard fixed ratio method
### 📊 AGGREGATION TYPE
- **Sum** (Default) - Total delta over period (best for signals)
- **SMA** - Smoothed average (cleaner chart)
- **EMA** - Exponential weighted (faster response)
- **Cumulative** - Pure running total (academic analysis)
### 🤖 ADAPTIVE MODES
- **ATR-Based** (Recommended) - Adjusts to volatility using Average True Range
- **Volatility-Based** - Uses standard deviation for adaptation
- **Range-Based** - Adjusts to candle size
**Why adaptive?** Because a signal on a calm day is different from a signal on an explosive rally. The indicator learns your market and adapts automatically.
### ⚡ CUSTOMIZATION
- Change all colors to match your chart theme
- Adjust zone sensitivity (manual or auto)
- Choose number format (K, M, B notation or full numbers)
- Display in USD or volume units
- Pick table position (9 locations available)
- Set font size (tiny to huge)
---
## WHAT YOU GET AT A GLANCE
**The Live Metrics Table Shows:**
- Current bar delta (buy vs sell pressure RIGHT NOW)
- Cumulative delta (accumulated pressure over time)
- Delta % (strength of pressure as a percentage)
- Upper wick (rejected resistance)
- Lower wick (bounces from support)
- Adaptive coefficient (volatility multiplier)
- Zone status (OVERBOUGHT / NORMAL / OVERSOLD)
- Trend direction (RISING / FALLING / FLAT)
**All updated in real-time. All on one clean dashboard.**
---
## THE 5 TRADING SIGNALS
1. **Zero Cross Alert** - Cumulative delta crosses zero = momentum shift detected
2. **Overbought Alert** - Enters red zone = buyers exhausted, sell signal
3. **Oversold Alert** - Enters green zone = sellers exhausted, buy signal
4. **Bullish Delta** - Bar delta turns positive = buying starts
5. **Bearish Delta** - Bar delta turns negative = selling starts
**Each alert can trigger notifications on your phone. Never miss a setup again.**
---
## WHO SHOULD USE THIS?
✅ **Crypto Traders** - Bitcoin, Ethereum, Altcoins (spot and futures)
✅ **Forex Traders** - EUR/USD, GBP/USD, and all pairs
✅ **Scalpers** - 1m-5m timeframes with instant alerts
✅ **Day Traders** - 15m-1h for quick reversals and continuations
✅ **Swing Traders** - 4h-1d for major trend changes
✅ **Position Traders** - Weekly/monthly for macro reversals
**Works on all timeframes. All markets. All strategies.**
---
## WHAT MAKES IT DIFFERENT?
While 99% of volume indicators just show raw volume, **Cumulative Hybrid Delta** does something revolutionary:
- It separates BUYING volume from SELLING volume with precision
- It accumulates this pressure to show market intention
- It adapts to your specific market and timeframe
- It alerts you to extremes before they reverse
- It works on crypto, forex, stocks, futures — everything
**This is what institutional traders pay thousands for. Now it's free.**
---
## QUICK START
1. Add to chart (search "Cumulative Hybrid Delta" on TradingView)
2. Open settings
3. Choose your algorithm (recommend starting with "Hybrid")
4. Set your timeframe
5. Watch the magic happen
**First signal comes within minutes. First reversal catch comes today.**
---
## PROVEN ON
✅ Bitcoin (1m, 5m, 15m, 1h, 4h, 1d)
✅ Altcoins (Ethereum, Solana, XRP, and 100+ pairs)
✅ Forex (EURUSD, GBPUSD, GOLD, CRYPTO pairs)
✅ All exchanges (Binance, OKX, Bybit, Coinbase, Kraken)
✅ All market conditions (bullish, bearish, ranging, volatile)
---
## START TRADING SMARTER TODAY
Stop trading blind. Stop guessing market direction.
**Cumulative Hybrid Delta** shows you exactly where the power is. Whether buyers or sellers are winning. When reversals are coming. When to enter. When to take profit.
**Download now. Change your trading forever.**
---
## FEATURES SNAPSHOT
| Feature | Details |
|---------|---------|
| **Algorithms** | 5 professional delta calculation methods |
| **Timeframes** | 1m to 1M (all supported) |
| **Markets** | Crypto, Forex, Stocks, Futures, Commodities |
| **Alerts** | 5 automated trading signals |
| **Adaptation** | 3 automatic market-condition adjustments |
| **Languages** | English & Russian |
| **Customization** | 50+ adjustable settings |
| **Dashboard** | 9-metric live table with zone status |
| **Colors** | Fully customizable to match any chart |
| **Performance** | Zero repainting, pure OHLCV calculation |
---
---
## READY TO DOMINATE?
**Your edge is waiting.**
This indicator gives professional-grade volume analysis at zero cost. Institutional traders charge thousands for this insight. You get it free.
**Download Cumulative Hybrid Delta now and see what professional traders see.**
---
*Cumulative Hybrid Delta - Where Smart Money Meets Retail Traders*
**Available exclusively on TradingView. Free. Forever. No subscription. No hidden costs.**

Khosro XAUUSD Strategy [TradingFinder] Trading Room Hunter Setup🔵 Introduction
The Trading Room Hunter (TRH) strategy is an analytical model based on the Smart Money Concept, developed by Khosro, an Iranian international trader based in Dubai. This approach is built upon a deep understanding of liquidity engineering, market structure shifts, and institutional order flow. Its core objective is to identify the so-called TRH Zone, the area where market liquidity gets trapped and institutional investors begin accumulating positions. Unlike traditional indicator-based methods, the TRH Zone focuses purely on price behavior and supply & demand dynamics to pinpoint the most precise reversal zones in the market.
Within Smart Money logic, every impulsive move in price results from the displacement or absorption of liquidity in a specific range. In the TRH model, the last pivot preceding the impulsive move (Origin Pivot) is defined as the Distal Line, and the Break Candle, which disrupts the market structure, forms the Proximal Line. The area between these two points defines the Trading Room Hunter Zone, a reaction zone where price, after creating a displacement or Break of Structure (BoS), often returns to fill an imbalance and provide a precision entry opportunity.
In essence, the TRH Zone is the region where smart money seeks re-entry after a liquidity sweep and a confirmed CHoCH or BoS. It frequently lies between supply/demand boundaries and fair value gaps (FVGs), forming one of the strongest decision-making frameworks within modern price-action theory. Due to its structural accuracy, the TRH setup can also function as a Set & Forget Setup, where the trader defines the zone, places a limit order, and lets the market naturally react, eliminating emotional decision-making and allowing for automated execution aligned with institutional logic.
🔵 How to Use
In the TRH strategy, entries are taken based on price returning to the area between the last impulsive pivot and the break candle. This range (the TRH Zone) represents the region where liquidity from the previous move remains concentrated. Before continuing its main direction, price often revisits this zone to fill imbalances or mitigate unfilled orders. The logic is simple: every explosive move originates from a point where large orders were executed, and TRH precisely highlights that institutional footprint.
🟣 Bullish Setup
When the market breaks a structural high after a strong bearish leg, liquidity shifts from sellers to buyers. The last bearish candle before the breakout marks the origin of the bullish move, and the zone between that candle and the break candle becomes the smart-money entry area. As price revisits this zone and signs of exhaustion in selling pressure appear, that’s the optimal point for a long position. Stop-loss is placed slightly below the origin pivot, and targets are set at the next supply zone or upper liquidity pool.
🟣 Bearish Setup
Conversely, when the market breaks a structural low after a sharp bullish leg, liquidity transitions from buyers to sellers. The last bullish candle before the drop is identified as the origin pivot, while the bearish break candle defines the lower boundary of the zone. The range between these two points forms the TRH Supply Zone, where late buyers are trapped and fresh institutional selling begins. As price retraces into this zone, short entries can be placed near the upper boundary, with stops above the pivot and targets toward the next liquidity pool below.
Because of its structural precision and clearly defined reaction behavior, TRH is one of the most effective Set & Forget setups in Smart Money trading. Simply mark the zone, place your order, and let the market do the rest.
🔵Setting
🟣 Spike Filter | Movement
Minimum Spike Bars : Defines the minimum number of consecutive candles required for a valid spike.
Movement Power : Enables or disables the momentum-based spike filter.
Movement Power Level : Sets the strength threshold; higher values filter out weaker moves and only detect strong spikes.
Pivot Period : Defines the lookback range used to detect swing highs and swing lows in market structure. A higher value smooths out smaller fluctuations and focuses on major pivots, while a lower value increases sensitivity and identifies minor turning points more frequently.
🟣 Position Management
Stop-Loss Threshold : Enables or disables the stop-loss threshold feature.
Stop-Loss Threshold Value : Defines the value of the stop-loss threshold for risk management.
Risk-Reward Ratio : Sets the desired risk-to-reward ratio (e.g., 1:1 or 1:2).
Wide Zone Filter : Filters out zones that exceed a defined width threshold, preventing detection of overly broad TRH areas.
🟣 Display Settings
Display Mode : Chooses between Setup (showing setups) or Signal (showing trade signals).
Show Entry Levels : Displays entry levels on the chart (buy/sell zones) when enabled
Only Display the Last Position : Displays only the most recent position on the chart when enabled.
Setup Width Drawing : Adjusts the visual width of the setup drawings on the chart for better visibility.
🔵 Conclusion
The TRH strategy is a precise structural model of liquidity flow that identifies zones where smart money is most likely to enter and where price is most likely to react. By combining the Origin Pivot and Break Candle, TRH isolates the key areas that drive institutional order flow. Without relying on indicators, it focuses purely on price structure, making it highly effective for both reactive entries and Set & Forget setups.
Ultimately, TRH creates a balance between market structure and liquidity flow, enabling traders to identify institutional decision zones on the chart with minimal risk and maximum clarity

Fair Value Gaps by DGTFair Value Gaps
A refined, multi-timeframe Fair Value Gap (FVG) detection tool that brings institutional imbalance zones to life directly on your chart.
Designed for precision, it visualizes how price delivers into inefficiencies across chart, higher, and lower (intrabar) timeframes — offering a fluid, structural view of liquidity displacement and market flow.
The script continuously tracks unfilled, partially repaired, and fully resolved imbalances, revealing where liquidity inefficiencies concentrate and where price may seek rebalancing.
Overlapping zones naturally expose institutional footprints, potential liquidity targets, and key re-pricing regions within the broader market structure.
KEY FEATURES
⯌ Multi-Timeframe Detection
Detect and display FVGs from the current chart, higher timeframes (HTF), or lower timeframes (LTF)
⯌ Smart Fill Tracking
Automatic real-time monitoring of each FVG’s fill progress with live percentage updates
⯌ Custom Fill Logic
Choose your preferred definition of when a gap is considered filled: Any Touch
Midpoint Reached
Wick Sweep
Body Beyond
⯌ Dynamic Labels & Tooltips
Labels can be toggled on/off. Even when hidden, detailed tooltips remain available by hovering over the FVG midpoint.
⯌ Adaptive Lower-Timeframe Mode
When set to “Auto,” the script intelligently selects the optimal lower timeframe based on the chart resolution.
DISCLAIMER
This script is intended for informational and educational purposes only. It does not constitute financial, investment, or trading advice. All trading decisions made based on its output are solely the responsibility of the user.

Adaptive Volume Delta Map---
📊 Adaptive Volume Delta Map (AVDM)
What is Adaptive Volume Delta Map (AVDM)?
The Adaptive Volume Delta Map (AVDM) is a smart, multi-timeframe indicator that visualizes buy and sell volume imbalances directly on the chart.
It adapts automatically to the best available data resolution (tick, second, minute, or daily), allowing traders to analyze market activity with micro-level precision .
In addition to calculating volume delta (the difference between buying and selling pressure), AVDM can display a Volume Distribution Map — a per-price-level visualization showing how volume is split between buyers and sellers.
Key Features
✅ Adaptive Resolution Selection — Automatically chooses the highest possible data granularity — from tick to daily timeframe.
✅ Volume Delta Visualization — Displays delta candles reflecting the dominance of buyers (green), sellers (red), and delta (orange).
✅ Per-Level Volume Map (optional) — Shows detailed buy/sell volume distribution per price level, grouped by `Ticks Per Row`.
✅ Bid/Ask Classification — When enabled, AVDM uses bid/ask logic to classify trade direction with greater accuracy.
✅ Smart Auto-Disable Protection — Automatically disables volume map if too many price levels (>50) are detected — preventing performance degradation.
Inputs Overview
Use Seconds Resolution — Enables use of second-level data (if your TradingView subscription allows it).
Use Tick Resolution — Enables tick-based analysis for the most detailed view. If available, enable both tick and seconds resolution.
Use Bid/Ask Calculated — Uses bid/ask midpoint logic to classify trades.
Show Volume Distribution — Toggles per-price-level buy/sell volume visualization.
Ticks Per Row — Controls how many ticks are grouped per volume level. Reduce this value for finer detail, or increase it to reduce visual load.
Calculated Bars — Sets how many historical bars the indicator should process. Higher value increases accuracy but may impact performance.
How to Use
1. Add the indicator to your chart.
2. Ensure that your symbol provides volume data (and preferably tick or second-level data).
3. The indicator will automatically select the optimal timeframe for detailed calculation.
4. If your TradingView subscription allows second-level data , enable “Use Seconds Resolution.”
5. If your subscription allows tick-level data , enable both “Use Tick Resolution” and “Use Seconds Resolution.”
6. Adjust the “Calculated Bars” input to set how many historical bars the indicator should process.
7. Observe the Volume Delta Candles :
* Green = Buy pressure dominates
* Red = Sell pressure dominates
8. To see buy/sell clustering by price, enable “Show Volume Distribution.”
9. If the indicator disables the map and shows:
" Volume Distribution disabled: Too many price levels detected (>50). Try decreasing 'Ticks Per Row' or using a lower chart resolution. If you don’t care about the map, just turn off 'Show Volume Distribution'. "
— follow the instructions to reduce chart load.
Notes
* Automatically adapts to your chart’s resolution and data availability.
* If your symbol doesn’t provide volume data, a runtime warning will appear.
* Works best on futures , FX , and crypto instruments with high-frequency volume streams.
Why Traders Love It
AVDM combines adaptive resolution , volume delta analysis , and visual distribution mapping into one clean, efficient tool.
Perfect for traders studying:
* Market microstructure
* Aggressive vs. passive participation
* Volume absorption
* Order flow imbalance zones
* Delta-based divergence signals
Technical Highlights
* Built with Pine Script v6
* Adaptive resolution logic (`security_lower_tf`)
* Smart memory-safe map rendering
* Dynamic bid/ask classification
* Automatic overload protection
---

Indre likviditetDescription:
The Indre Likviditet (Inner Liquidity) indicator automatically detects and visualizes liquidity gaps / imbalance zones (often referred to as Fair Value Gaps) on any timeframe. It highlights price inefficiencies where the market moved too quickly in one direction, leaving untested areas of liquidity.
Key Features:
• Gap detection: Identifies bullish and bearish liquidity gaps based on three-candle logic.
• Multi-timeframe (MTF) mode: Option to detect gaps on the current timeframe, higher timeframe, or both simultaneously.
• Custom visuals: Bullish and bearish gaps are displayed as colored boxes, with optional midpoint lines. Colors for HTF vs current TF can be customized separately.
• Dynamic updates: Gaps shrink automatically as price partially retraces into them, and can be fully deleted when filled.
• Flexible fill logic: Choose whether gaps are considered “filled” once the midpoint is touched, or only on a complete fill.
• Labeling: Optional labels show which timeframe the gap belongs to.
• Auto-clean: Option to delete old gaps once filled, or keep them as historical references.
Use Case:
This tool helps traders quickly spot where imbalances exist in the market and track when they are filled. Liquidity gaps often act as magnets for price, making them useful areas for targeting entries, exits, or managing risk.

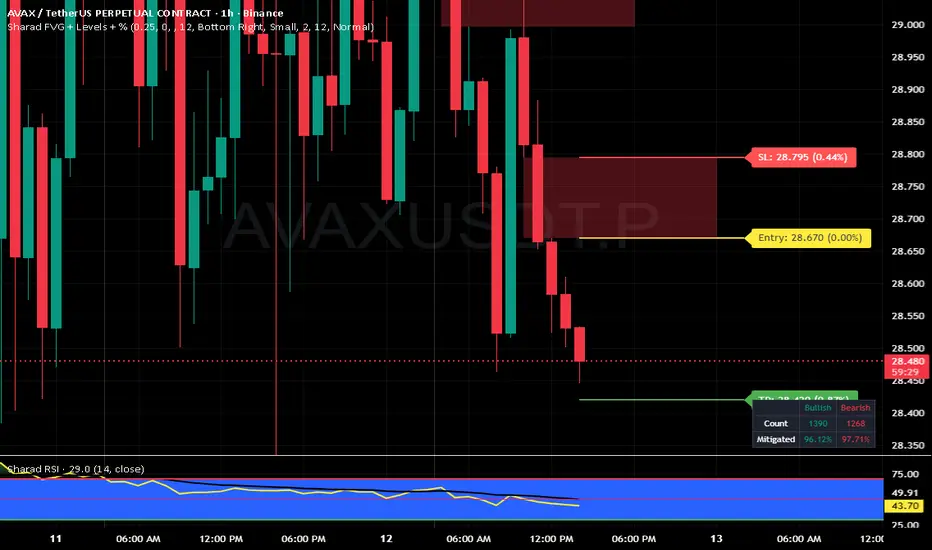
Sharad FVG (Last FVG SL/TP + Entry + % + Label Size)Sharad Fair Value Gap — Last FVG Entry, SL & TP (with % Labels)
What it is
A streamlined Fair Value Gap (FVG) tool that plots exact trading levels for the latest unmitigated FVG only:
Entry (yellow)
Stop-Loss (red)
Target (green) computed from a configurable Risk:Reward
Price and percentage distance printed on the right of each line
Optional dashboard and optional visualization of recent unmitigated/mitigated FVGs
The goal is simple: find the newest valid imbalance and give you just three actionable levels—no clutter.
How it detects FVGs
The script uses the standard 3-candle FVG logic (inspired by LuxAlgo’s implementation):
Bullish FVG forms when:
low > high and close > high and the gap size exceeds the Threshold filter.
The bullish gap is between high (lower bound) and low (upper bound).
Bearish FVG forms when:
high < low and close < low and the gap size exceeds the Threshold filter.
The bearish gap is between low (lower bound) and high (upper bound).
Threshold % filters small/weak gaps. You can also enable Auto, which estimates a dynamic threshold from recent candle ranges, so tiny imbalances don’t spam your chart in low-volatility regimes.
You may set Timeframe to detect FVGs on the chart timeframe or any higher/lower TF via request.security.
“Latest FVG only” levels (the core feature)
From the most recent unmitigated FVG (bullish or bearish), the script draws:
Entry
Bullish FVG → Entry = higher side of the gap (the gap max)
Bearish FVG → Entry = lower side of the gap (the gap min)
Stop-Loss (SL) = the opposite side of that same gap
Target (TP) = Entry + (Risk × R:R) for bulls, Entry − (Risk × R:R) for bears
where Risk = |Entry − SL| and R:R is your input (default 1:2)
Each line shows the price and its absolute % distance from Entry in parentheses—like TradingView’s long/short tool.
Alerts included
These are carried over from the base logic so you can build workflows:
Bullish FVG – when a new bullish gap is detected
Bearish FVG – when a new bearish gap is detected
Bullish FVG Mitigation – when a bullish gap is filled
Bearish FVG Mitigation – when a bearish gap is filled
Credits & License
Inspiration & base logic: LuxAlgo’s “Fair Value Gap ”.
This script: modified and extended by Sharad (Entry/SL/TP for latest FVG, price/% labels, label sizing, decluttered drawing).
License: This derivative keeps the original CC BY-NC-SA 4.0 license.
Attribution: Credit LuxAlgo for the original FVG approach and detection logic.
Non-Commercial: You may not use this for commercial purposes.
Share-Alike: If you remix/redistribute, you must use the same license and provide attribution.
Disclaimer:
Educational use only. Nothing in this script or its description is financial advice or a recommendation to buy/sell any asset. Markets involve substantial risk. Past performance and historical fill rates do not guarantee future results. You are solely responsible for your trading decisions and risk management. Data feeds, broker routing, spreads, slippage, and TradingView’s real-time behavior (especially with MTF) can affect outcomes. Test thoroughly on a demo account and consider multiple forms of confirmation before risking capital.
Spot Overlapping FVG - [FNDSFT]🧠 Overview
This script plots Higher Timeframe Fair Value Gaps (FVGs) with full visibility and precise placement on lower timeframe charts. Each timeframe (1D–12M) has its own independent toggle, custom label, and box styling, allowing traders to analyze broader market structures across swing and long-term horizons.
🎯 Features
✅ Identifies Fair Value Gaps using a 3-candle logic (candle 1 high vs candle 3 low, and vice versa).
✅ Plots HTF FVG boxes aligned to lower timeframes for comprehensive multi-timeframe analysis.
✅ Supports custom timeframes: 1D to 12M, with individual toggles.
✅ Full visual customization: border color, bullish/bearish box opacity, label font size and color.
✅ Modular inputs to enable or disable specific timeframes for performance.
✅ Uses barstate.isconfirmed logic for stable, non-repainting plots.
⚙️ How It Works
The script requests higher timeframe data via request.security. For each confirmed bar, it checks for FVGs based on:
Bullish FVG: low >= high
Bearish FVG: low >= high
If a gap is detected, a box is plotted between candle 1 and candle 3 using box.new().
Timeframe toggles ensure calculations remain within the limit of 40 request.security calls.
📈 Use Cases
Swing traders analyzing daily to monthly imbalances for medium-term strategies.
Position traders seeking to identify long-term imbalance zones for entries or exits.
ICT methodology practitioners visualizing higher timeframe displacement and inefficiencies.
Traders layering multiple HTF FVGs to build confluence-based trading decisions.
Smart Money Index Intraday (by CapitalCore)This indicator identifies imbalance zones (Fair Value Gaps) — key levels where price demonstrates significant gaps between supply and demand. It is designed for intraday trading and helps determine precise entry levels, as well as stop-loss and take-profit levels.
Key Features:
Automatic identification of bullish and bearish imbalances based on gap analysis in candle extremes
Volume-based signal filtering for improved accuracy (with customizable on/off parameters)
Display of specific entry levels (long entry / short entry) with price
Calculation and visualization of stop-loss and take-profit levels with customizable stop size
Integration with TradingView alert system for timely trading signal notifications
Compact indicator display directly on the chart without overlapping candles — histogram below the chart
Target Audience: The indicator is suitable for traders working on intraday timeframes (1m, 5m, 15m) who want to improve entry precision using Smart Money zones and volume filters.

FVG Candle TYHE42This indicator highlights potential Fair Value Gaps (FVGs) directly on the relevant candle by changing its body color.
The logic is simple yet effective:
A bullish FVG is detected when the current low is above the high from two candles back.
A bearish FVG is detected when the current high is below the low from two candles back.
When such a gap is detected, the previous candle is colored (default: yellow) to provide a clean, unobtrusive visual cue. This helps traders quickly identify price imbalances without cluttering the chart with shapes or labels.
Users can customize the highlight color from the settings to better suit their chart theme or personal preference.
This indicator is especially useful for traders using Smart Money Concepts (SMC), ICT, or other price imbalance-based strategies.

MA Thrust Processor | QuantEdgeB⚡MA Thrust Processor | QuantEdgeB
🔭 What is the MA Thrust Processor?
The MA Thrust Processor (MTP) is a dynamic and modular market momentum engine that specializes in thrust-based signal analysis derived from smoothed moving averages. It’s engineered to model directional commitment, detect signal imbalances, and visualize structural momentum in a range of market conditions.
🧬 Think of MTP as a precision-engineered motion sensor — decoding strength, follow-through, and structural imbalance in real time — it detects force, direction, velocity, and alignment, adapting based on your preferred calculation model (Wave, Thrust, Z-Score, or Normalized) and signal mode (Impulse, Trend, or HA Candles).
_______________________
1. 🔧 System Core: Customizability and Processing Engine
📊 Moving Average Types
MA Thrust Processor supports a rich menu of 13+ moving average styles:
• Standard: SMA, EMA, WMA
• Advanced: HMA, LSMA, ALMA, JMA, TEMA, DEMA, SMMA
• Volume-Based: VWMA
• Adaptive Models: VIDYA (3 modes), FRAMA
💡 Each MA type acts as the backbone for signal smoothing and thrust deviation modeling, giving the user tight control over behavior and lag tradeoffs.
⚙️ Calculation Methods (MA Derivatives)
You choose how the core value is calculated:
1️⃣ 𝓦𝓪𝓿𝓮
• Sine-wave modeled oscillator
• Combines MA distance with standard deviation normalization
• Ideal for detecting divergences and cyclical structure
• Output includes center, smoothed line , and histogram.
2️⃣ 𝓣𝓱𝓻𝓾𝓼𝓽
• Calculates MA deviation vs. price and midpoint
• Captures aggressive directional pushes relative to range center
• Excellent for breakout/trend force analysis
3️⃣ 𝓩-𝓢𝓬𝓸𝓻𝓮
• Mean-reverting z-score over MA
• Expresses statistical distance from norm
• Used in reversion or probabilistic strategies
4️⃣ 𝓝𝓸𝓻𝓶𝓪𝓵𝓲𝔃𝓮𝓭
• Scales MA output to 0–1 (centered at 0.5)
• Tracks where the signal lies in its own relative range
• Great for flat vs. trending recognition
_______________________
2. 🧨 SIGNAL MODES – The Behavioral Core
The system supports 3 powerful signal modes that define how the thrust logic is interpreted and visualized.
1️⃣ 𝓘𝓶𝓹𝓾𝓵𝓼𝓮 Mode
🔥 Use Case: Breakouts, aggressive reversals, divergences
🔍 Logic:
• In Wave mode: compares Wave O (oscillator) and S (smoothed)
• In Thrust/Z-Score/Normalized: applies thresholds (static, SD, or percentile)
• Detects sharp departures or rejections from bounds
🎯 Ideal for:
• Scalp or event trades
• High-velocity moves
• Leading edge of trend or compression breaks
2️⃣ 𝓣𝓻𝓮𝓷𝓭 Mode
🧭 Use Case: Stable continuation and trend following
🔍 Logic:
• Signal triggers when value crosses a calculated midline or long-term average
• Thresholds: midline or 365-SMA of smoothed value
• Acts as a stable “bias direction” for trades
🎯 Ideal for:
• Swing trading
• Portfolio allocations
• Holding directional exposure longer
3️⃣ 𝓗𝓐 𝓒𝓪𝓷𝓭𝓵𝓮𝓼 Mode
🎨 Use Case: Visual clarity + phase detection
🔍 Logic:
• Converts signal to Heikin-Ashi candles
• Adds logic for momentum, reversal, continuation, or chop
• Highly discretionary and pattern-oriented
🎯 Ideal for:
• Visual traders
• Phase-based strategies
• Avoiding false positives in chop
_______________________
3. 📊 System Sensor Table (Strength Meter)
MA Thrust Processor includes a sophisticated sensor display with multi-layered insights.
🔁 Signal State
• Long ⟹ bullish conviction or thrust
• Short ⟹ bearish dominance or rejection
• Cash ⟹ neutrality or low conviction
Dynamically generated by logic mode and indicator thresholds.
📊 Strength Bars: Conviction + Potential
Strength output is never binary — instead, it’s expressed via:
1️⃣ Conviction Strength (when signal is active):
• Score from 0% to 100%
• Based on:
o Momentum velocity (Rate of Change)
o Distance from key thresholds
o Divergence signal (Wave mode)
o Flat signal detection (for Normalized)
2️⃣ Potential Strength (when signal = neutral):
• Displays both Bullish and Bearish readiness
• Interprets which side is loading pressure
• Helps traders spot “who has the edge” before breakout
👀 In Wave Mode, potential is calculated from oscillator vs. smoothed
👀 In Impulse/Trend, it blends distance + RoC + signal stability
🔸 HA Candle Phase (HA Mode Only)
When HA mode is active, strength bars are replaced with a live phase classifier:
• Momentum Up/Down: price above/below threshold + same color trend
• Reversal Up/Down: price above/below bounds, opposite signal color
• Continuation Up/Down: following a breakout/confirmation
• Chop: indecision zone
• Neutral: no clear trend
This turns HA mode into a narrative engine, expressing what’s happening, why, and what might come next.
_______________________
4. 🧠 Smart Auto-Configuration
Enabling Use Recommended Settings triggers optimized configurations:
• Pre-set thresholds (static, percentile, SD)
• Ideal lengths for each logic type
• Proper bounds scaling
• MA selections that match the logic
For example:
• Impulse + Thrust ⇒ shorter length + SD
• Trend + Z-Score ⇒ long mean-based
• Wave ⇒ balanced smoothing + SD blend
_______________________
5. 🧪 Summary of Use Cases
Each mode and calculation method within the MA Thrust Processor is tailored for specific trading styles and market conditions. Here’s how to think about their best applications:
🔹 Signal Modes
Impulse Mode is designed for speed and responsiveness. It excels in fast markets where breakouts or sharp reversals happen quickly. Ideal for scalpers, intraday traders, or anyone looking to catch momentum just as it ignites. It’s particularly effective around high-impact events like economic reports or news catalysts, as it picks up directional shifts rapidly.
Trend Mode focuses on longer-term, stable price action. It identifies directional bias using midline or average-based thresholds, making it best for swing traders and trend followers. Because of its stability, it filters out minor fluctuations and helps you stay in trades longer when the directional move is sustained.
HA Candles Mode is for traders who prefer a visual, phase-based approach. It smooths data using Heikin-Ashi logic and adds interpretive layers like "Momentum," "Reversal," or "Chop" to describe what’s happening structurally. This is excellent for discretionary traders, those who use price rhythm or structure, and those seeking cleaner entry points in noisy environments.
🔹 Calculation Methods
Wave is an oscillator-based model. It detects momentum swings and divergence between price and the smoothed oscillator. Great for spotting early reversals, pullback continuations, or cyclical rhythm patterns. In Impulse mode, it shows histogram shifts that reflect internal thrust dynamics.
Thrust quantifies directional pressure by comparing the signal’s distance from both the midpoint of price range and an SMA. This method is powerful when you want to assess how much true force is behind a move — especially useful during breakout scenarios or strong directional pushes.
Z-Score mode normalizes the signal to its statistical distance from the mean. This makes it ideal for mean reversion strategies or situations where price has deviated too far from historical behavior. Traders can look for exhaustion zones or pullback opportunities with greater confidence.
Normalized rescales the signal within a 0–1 range (centered at 0.5), helping traders understand where the price sits within its own context — whether it’s relatively extended or compressed. It’s great for range traders, flat market identification, or mapping gradual bias accumulation.
_______________________
Each mode and method has been thoughtfully designed to align with different strategy frameworks — and switching between them completely reconfigures the way the system operates, giving traders unmatched flexibility across timeframes and asset classes
_______________________
🧭 Conclusion
MA Thrust Processor isn’t just a tool - it’s a precision-calibrated thrust engine that gives market context form. It lets you define your logic, style, and MA behavior while delivering rich visual output and conviction-based strength insight.
Whether you're reading momentum waves, modeling thrust deviation, or interpreting candle structure, MTP adapts to your strategy.
🚀 From short-term scalps to long-term rotations, MTP delivers signal clarity with the quantitative conviction needed in modern markets.
📌 Trade with Statistical Precision | Powered by QuantEdgeB
🔹 Disclaimer: Past performance is not indicative of future results.
🔹 Strategic Advice: Always backtest, optimize, and align parameters with your trading objectives and risk tolerance before live trading.

SMT Divergence ICT 02 [TradingFinder] Smart Money Technique SMC🔵 Introduction
SMT Divergence (Smart Money Technique Divergence) is a price action-based trading concept that detects discrepancies in market behavior between two assets that are generally expected to move in the same direction. Rooted in ICT (Inner Circle Trader) methodology, this approach helps traders recognize subtle signs of market manipulation or imbalance, often ahead of traditional indicators.
The core idea behind SMT divergence is simple: when two correlated instruments—such as currency pairs, indices, or assets from the same sector—start forming different swing points (highs or lows), this can reveal a lack of confirmation in the trend. Such divergence is often a precursor to a price reversal or pause in momentum.
This technique works effectively across various markets including Forex, stocks, and cryptocurrencies. It’s particularly valuable when used alongside concepts like liquidity sweeps, market structure breaks (MSBs), or order block identification.
In advanced use cases, Sequential SMT helps uncover patterns of alternating divergences across sessions, often signaling engineered liquidity traps before price reacts.
When combined with the Quarterly Theory—which segments market behavior into Accumulation, Manipulation, Distribution, and Continuation/Reversal phases—traders gain insight not only into where divergence happens, but when it's most likely to be significant within the market cycle.
Bullish SMT :
Bullish SMT Divergence occurs when one asset prints a higher low while the correlated asset forms a lower low. This asymmetry often suggests that the downside move is losing strength, hinting at a potential bullish shift.
Bearish SMT :
Bearish SMT Divergence is formed when one asset creates a higher high, while the second asset fails to confirm by printing a lower high. This typically signals weakening bullish pressure and the possibility of a reversal to the downside.
🔵 How to Use
The SMT Divergence indicator is designed to detect imbalances between two positively correlated assets—such as major currency pairs, indices, or commodities. These divergences often indicate early signs of market inefficiency or smart money manipulation and can help traders anticipate trend shifts with higher precision.
Unlike traditional divergence indicators or earlier versions of this script, this upgraded version does not rely solely on consecutive pivot comparisons. Instead, it dynamically scans all available pivots within the chart to identify divergences at any structural level—major or minor—across the price action. This broader detection method increases the reliability and frequency of meaningful SMT signals.
Moreover, when integrated with Sequential SMT logic, the indicator is capable of identifying multiple divergence sequences across sessions. These sequences often signal engineered liquidity traps and can be mapped within the Quarterly Theory framework, allowing traders to pinpoint not just the presence of divergence but also the phase of the market cycle it appears in (Accumulation, Manipulation, Distribution, or Continuation).
🟣 Bullish SMT Divergence
This signal occurs when the primary asset forms a higher low, while the correlated asset forms a lower low. This pattern implies weakening bearish momentum and a potential shift to the upside.
If the correlated asset breaks its previous low but the primary asset does not, this divergence suggests absorption of selling pressure and possible accumulation by smart money—making it a strong bullish signal, especially when aligned with a favorable market phase (e.g., the end of a manipulation phase in Q2).
🟣 Bearish SMT Divergence
This signal occurs when the primary asset creates a higher high, while the correlated asset forms a lower high. This mismatch indicates fading bullish momentum and a potential reversal to the downside.
If the correlated asset fails to confirm a breakout made by the main asset, the divergence may point to distribution or exhaustion. When seen within Q3 or Q4 phases of the Quarterly Theory, this pattern often precedes sharp declines or fake-outs engineered by smart money
🔵 Settings
⚙️ Logical Settings
Symbol : Choose the secondary asset to compare with the main chart asset (e.g., XAUUSD, US100, GBPUSD).
Pivot Period : Sets the sensitivity of the pivot detection algorithm. A smaller value increases responsiveness to price swings.
Activate Max Pivot Back : When enabled, limits the maximum number of past pivots to be considered for divergence detection.
Max Pivot Back Length : Defines how many past pivots can be used (if the above toggle is active).
Pivot Sync Threshold : The maximum allowed difference (in bars) between pivots of the two assets for them to be compared.
Validity Pivot Length : Defines the time window (in bars) during which a divergence remains valid before it's considered outdated.
🎨 Display Settings
Show Bullish SMT Line : Draws a line connecting the bullish divergence points.
Show Bullish SMT Label : Displays a label on the chart when a bullish divergence is detected.
Bullish Color : Sets the color for bullish SMT markers (label, shape, and line).
Show Bearish SMT Line : Draws a line for bearish divergence.
Show Bearish SMT Label : Displays a label when a bearish SMT divergence is found.
Bearish Color : Sets the color for bearish SMT visual elements.
🔔 Alert Settings
Alert Name : Custom name for the alert messages (used in TradingView’s alert system).
Message Frequency :
All : Every signal triggers an alert.
Once Per Bar : Alerts once per bar regardless of how many signals occur.
Per Bar Close : Only triggers when the bar closes and the signal still exists.
Time Zone Display : Choose the time zone in which alert timestamps are displayed (e.g., UTC).
Bullish SMT Divergence Alert : Enable/disable alerts specifically for bullish signals.
Bearish SMT Divergence Alert : Enable/disable alerts specifically for bearish signals
🔵Conclusion
The SMT Plus indicator offers a refined and powerful approach to detecting smart money behavior through divergence analysis between correlated assets. By removing the limitations of consecutive pivot comparisons and allowing for broader structural detection, it captures more accurate and timely signals that often precede major market moves.
When paired with frameworks like Sequential SMT and the Quarterly Theory, the indicator not only highlights where divergence occurs, but also when in the market cycle it's most likely to matter. Its flexible settings, customizable visuals, and integrated alert system make it suitable for intraday scalpers, swing traders, and even long-term macro analysts.
Whether you're using it as a standalone decision-making tool or combining it with other ICT concepts, SMT Plus gives you an edge in recognizing manipulation, timing reversals, and staying in sync with the real market narrative—not just the chart.

Gap Fill DetectorThe Gap Fill Detector is a visual tool designed to highlight potential price imbalances caused by sudden, sharp movements following periods of low volatility or indecision. These events can often result in "gaps" or "voids" in price action that may later attract a return move — commonly referred to as a gap fill.
This indicator helps traders visually identify these unique conditions and monitor whether price revisits the origin of the move. It does so by marking the location of the price gap and providing a clean, color-coded interface to track price interaction with that level over time.
🔧 Key Features
🔸 Highlight Zones
When the script detects a potential gap-forming move, the background of the triggering candle is highlighted. These areas represent potential moments of price imbalance or sudden breakout behavior.
🔸 Gap Fill Line
A horizontal line is drawn from the close of the candle before the spike (representing the likely gap origin). This line acts as a reference for tracking whether price returns to "fill" the gap. The line is persistent but will automatically hide once price intersects it, or if another gap signal occurs.
🔸 Intelligent Auto-Hide Logic
Once the gap line has been touched by price or interrupted by a new spike event, it is removed from view. This keeps the chart clean and avoids clutter from outdated signals.
🔸 Dynamic Fill Shading
The area between the current price and the gap line is filled with a color-coded visual cue:
🟩 Green Fill: When price is above the gap line — a possible bullish continuation.
🟪 Purple Fill: When price is below the gap line — a potential retracement or bearish correction. Fill transparency is customizable to blend with your chart style.
🔸 Stability Zones (Optional)
Users can optionally enable shaded background zones to mark extended periods of price stagnation. These zones may help identify moments where the market is "winding up" before releasing energy in the form of a fast move.
⚙️ Customization Options
Base highlight color & transparency
Enable/disable stability zone highlighting
Adjustable gap fill area transparency
✅ Use Cases
This tool is ideal for:
Intraday traders seeking gap fills or mean reversion setups
Swing traders identifying sudden breakouts for future re-entry
Visual traders who want a clean, automated way to spot and manage price dislocations

CLS Patterns + Price Action Levels📌 Key Features:
✅ CLS Candle Patterns Detection:
CLS Type 1 (Sweeps & Closes Opposite) – Confirms liquidity sweeps with opposite direction close.
CLS Type 2 (Sweeps but No Opposite Close) – Identifies liquidity traps without full reversal.
CLS Type 3 (Engulfing Candles) – Strong momentum shifts with engulfing price action.
CLS Type 4 (Order Block Reversals) – Institutional order flow recognition.
✅ Institutional & Price Action Levels:
250 Pip Institutional Levels – Major S&R zones for Forex & Indices.
Minor Quarter Points (25 Pips) – Intraday precision for refined entries.
✅ Liquidity Imbalance & Order Flow Gaps:
Detects early impulse moves & liquidity voids
Highlights areas of market inefficiency & potential reversals
✅ Higher Timeframe EMA for Trend Confirmation:
Customizable Weekly 3 EMA Overlay
Dynamic color change based on price action
✅ Built-in Alerts for CLS Patterns:
Real-time alerts for CLS buy/sell signals
Configurable notifications for trade execution
🎯 How to Use:
1️⃣ Enable CLS Pattern Signals to spot liquidity sweep candles with directional confirmation.
2️⃣ Use Institutional & QP Levels to identify key areas where price is likely to react.
3️⃣ Monitor Liquidity Imbalances to detect inefficient price moves that may fill.
4️⃣ Confirm Trend with HTF EMA to trade with momentum.
5️⃣ Set Alerts for CLS patterns and key price levels to stay ahead of the market.
This indicator is ideal for Forex, Indices, and Crypto traders looking to refine their entries with precise price action confirmations.

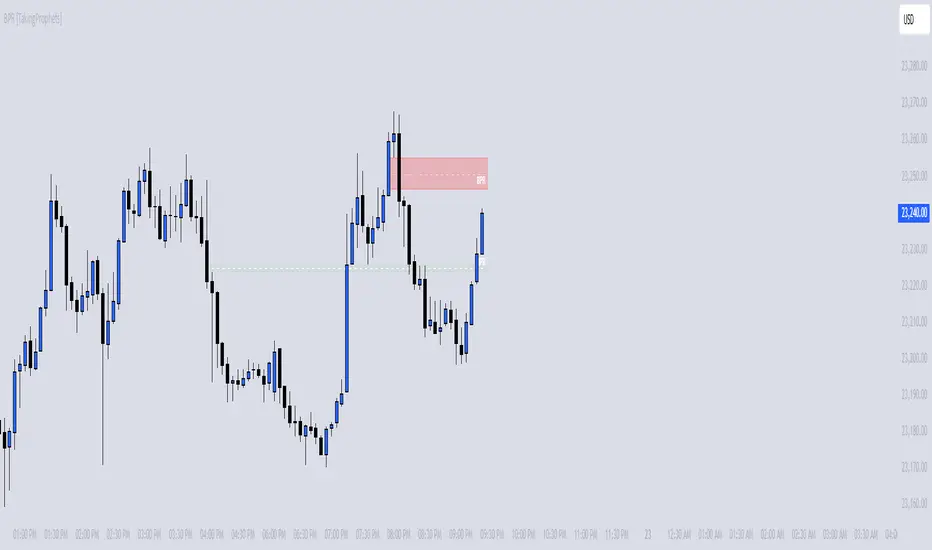
BPR [TakingProphets]The BPR (Balanced Price Range) Indicator by Taking Prophets is built for traders who follow ICT (Inner Circle Trader) concepts and smart money strategies. In ICT methodology, a Balanced Price Range (BPR) occurs when price rapidly moves in one direction, creating an imbalance that often gets revisited before price continues its trend. These areas represent inefficiencies in the market where liquidity was not properly distributed, making them key zones for potential retracements and trade setups.
How the Indicator Works:
🔹 Automatically Detects BPRs – No need to manually mark imbalances; the indicator highlights them for you.
🔹 Helps Identify Smart Money Footprints – Spot areas where price is likely to retrace and rebalance liquidity.
🔹 Customizable Sensitivity – Adjust detection parameters based on your preferred trading style.
🔹 Works Across All Markets – Apply it to Forex, Futures, Crypto, and Stocks on TradingView.
🔹 Clean and Intuitive Interface – Designed to be simple yet powerful for both new and experienced traders.
Crodl Market StructureCrodl Market Structure | FVG | MFI | EMA
The Crodl Market Structure indicator is a powerful trading tool designed to help traders identify key price movements, trend direction, and potential liquidity zones. It combines Fair Value Gaps (FVGs), Money Flow Index (MFI) Trend Filters, and Exponential Moving Averages (EMAs) to provide a structured market view.
Features:
Exponential Moving Averages (EMAs) – Trend Confirmation
Tracks EMA 20, EMA 50, and EMA 200 to identify trend direction.
EMAs change color dynamically based on price action.
Helps traders determine uptrends, downtrends, and potential reversals.
Money Flow Index (MFI) – Trend Strength & Exhaustion
Uses MFI to detect overbought (80) and oversold (20) levels.
Confirms trend exhaustion and highlights potential reversals.
Works with EMAs to generate high-confidence entry signals.
Fair Value Gap (FVG) – Liquidity & Price Imbalance
Identifies Fair Value Gaps (price imbalances) based on 3 consecutive bullish or bearish candles.
Marks liquidity zones where price may return for mitigation.
Toggle ON/OFF to show/hide Fair Value Gaps on the chart.
Smart Buy & Sell Signals
🔺 Bullish Entry Signal: Price crosses above EMA 20 after oversold MFI & downtrend.
🔻 Bearish Entry Signal: Price crosses below EMA 20 after overbought MFI & uptrend.
Helps confirm trend continuation or reversal opportunities.
🔹 How to Use:
1️⃣ Trend Analysis – Check EMAs alignment to identify the overall trend.
2️⃣ Momentum Confirmation – Use MFI to spot trend exhaustion before price reverses.
3️⃣ Liquidity Gaps – Watch for Fair Value Gaps (FVGs) to anticipate price retracements.
🔹 Settings:
EMA Settings: Enable/Disable EMAs, adjust lengths (20, 50, 200).
MFI Trend Filter: Enable/Disable trend signals, customize MFI levels.
Fair Value Gaps: Show/Hide FVGs, adjust extension & colors.

Liquidity Trap Detector (LTD)The Liquidity Trap Detector is an advanced trading tool designed to identify liquidity zones and potential traps set by institutional players. It provides traders with a comprehensive framework to align with smart money movements, helping them avoid common retail pitfalls such as bull and bear traps.
The indicator focuses on detecting liquidity sweeps, breaker blocks, and areas of institutional accumulation/distribution. It integrates multiple technical analysis methods to offer high-probability signals and insights into how liquidity dynamics unfold in the market.
Note : This indicator is not designed for beginners; it is intended for traders who already have a solid understanding of trading fundamentals. It is tailored for individuals who are familiar with concepts like liquidity, order blocks, and traps. Traders with at least 6 months to 1 year of trading experience will fully appreciate the power and potential of this indicator, as they will have the necessary knowledge to leverage its features effectively. Beginners may find it challenging to grasp the advanced concepts embedded in this tool.
Why Combine These Elements?
The components of the Liquidity Trap Detector are carefully chosen to address the core challenges of identifying institutional activity and liquidity traps. Here’s why each element is included and how they work together:
1. Order Blocks:
• Purpose: Identify zones where large institutional players accumulate or distribute positions.
• Role in the Indicator: These zones act as primary liquidity areas, where price is likely to reverse or consolidate due to significant order flow.
2. Breaker Blocks:
• Purpose: Highlight areas where liquidity has been swept, leading to potential price reversals or continuations.
• Role in the Indicator: Confirms whether a liquidity trap has occurred and provides actionable levels for entry or exit.
3. ATR-Based Volatility Zones:
• Purpose: Filter signals based on market volatility to ensure trades align with statistically significant price movements.
• Role in the Indicator: Defines dynamic support and resistance zones, improving the accuracy of signal generation.
4. Volume Delta:
• Purpose: Measure the imbalance between aggressive buyers and sellers, often indicating institutional activity.
• Role in the Indicator: Validates whether a liquidity trap is backed by smart money absorption or retail-driven momentum.
5. Trend Confirmation (EMA):
• Purpose: Align liquidity trap signals with the broader market trend, reducing false positives.
• Role in the Indicator: Ensures trades are executed in the direction of the prevailing trend.
What Makes It Unique?
1. Gen 1 Liquidity Zones and Traps:
• The indicator identifies Gen 1 Liquidity Zones, which represent the first areas where liquidity is accumulated or swept. While these zones often lead to reversals, they can sometimes fail, resulting in continuation moves. The indicator highlights these scenarios, helping traders adapt.
• For example, a bull trap identified in a Gen 1 Zone may see price move higher after an initial red candle, completing a secondary liquidity sweep before reversing.
2. Multi-Layer Signal Validation:
• Signals are only generated when liquidity, volume, trend, and volatility align. This ensures high-probability setups and reduces noise in choppy markets.
3. Dynamic Adaptability:
• ATR-based zones and volume delta filtering allow the indicator to adapt to different market conditions, from trending to range-bound environments.
4. Institutional Insights:
• By focusing on liquidity sweeps, order blocks, and volume imbalances, the indicator helps traders align with institutional strategies rather than retail behavior.
How It Works
The Liquidity Trap Detector uses a step-by-step process to identify and validate liquidity traps:
1. Identifying Liquidity Zones:
• Order Blocks: Mark key zones of institutional activity where price is likely to reverse.
• Breaker Blocks: Highlight areas where liquidity sweeps have occurred, signaling potential traps.
2. Filtering with Volatility (ATR):
• ATR defines dynamic support and resistance zones, ensuring signals are only generated near significant price levels.
3. Validating Traps with Volume Delta:
• Volume delta shows whether liquidity sweeps are backed by aggressive buying/selling from institutions, confirming the trap’s validity.
4. Aligning with Market Trends:
• EMA ensures signals align with the broader trend to reduce false positives.
5. Monitoring Gen 1 Liquidity Zones:
• The indicator highlights Gen 1 Liquidity Zones where price may initially reverse or sweep further before a true reversal. Traders are alerted to potential continuation scenarios if volume or momentum suggests unmet liquidity above/below the zone.
How to Use It
Buy Signal:
• Triggered when:
• Price sweeps below an order block and forms a breaker block, indicating a liquidity trap.
• Volume delta confirms aggressive selling absorption.
• ATR volatility zone supports the reversal.
• EMA confirms a bullish trend.
• Action: Enter a Buy trade and set:
• Stop Loss (SL): Below the order block.
• Take Profit (TP): Near the next resistance or liquidity zone.
Sell Signal:
• Triggered when:
• Price sweeps above an order block and forms a breaker block, indicating a liquidity trap.
• Volume delta confirms aggressive buying absorption.
• ATR volatility zone supports the reversal.
• EMA confirms a bearish trend.
• Action: Enter a Sell trade and set:
• SL: Above the order block.
• TP: Near the next support or liquidity zone.
Timeframes:
• Best suited for scalping and intraday trading on lower timeframes (5m, 15m, 1H).
• Can also be applied to swing trading on higher timeframes.
Example Scenarios:
1. Bull Trap in a Gen 1 Zone:
• Price sweeps above a resistance order block, forms a breaker block, and reverses sharply. However, if momentum persists, price may continue higher after a minor pullback. The indicator helps traders anticipate this by monitoring volume and trend shifts.
2. Bear Trap with Secondary Sweep:
• Price sweeps below a support order block but fails to reverse immediately, instead forming a secondary liquidity sweep before turning bullish. The indicator highlights both scenarios, allowing for flexible trade management.
Why Use It?
The Liquidity Trap Detector offers:
1. Precision: Combines multiple filters to identify institutional liquidity traps with high accuracy.
2. Adaptability: Works across trending and range-bound markets.
3. Smart Money Alignment: Helps traders avoid retail traps by focusing on liquidity sweeps and institutional behavior.
Venta's DikFat Spread Visualizer & Dynamic Options Chain
**Venta's DikFat Spread Visualizer and Options Chain Strike Scanner** is a powerful trading tool designed to give users an immediate view of the nearest options strikes relative to the current price of the underlying asset. This script dynamically displays a selected number of call and put options strikes from the **options chain**, visualizing them directly on the chart for better decision-making.
By default, the script shows options strikes for the current chart’s price, but users have the flexibility to extend the view to include strikes on the opposite side of the market. The available options allow you to show either 3, 6, or 9 strikes on either side of the current price level.
This tool is essential for options traders who want to track strike prices in relation to the underlying asset's price movements. It provides key visual clues such as strike price distributions, volatility, and potential areas of market basing—all in a customizable and user-friendly interface.
---
█ CONCEPTS
This script pulls real-time **options strikes** directly from the **options chain**, providing traders with the ability to see call and put strikes as dynamic price markers on their chart. The concept revolves around understanding the proximity and distribution of strikes based on the current price and market conditions.
Key Features
**Dynamic Options Strike Display**: The script automatically identifies and displays the options strikes closest to the current market price of the underlying asset.
**Customizable Strike Range**: Choose between 3, 6, or 9 strikes on either side of the current price, giving flexibility in visualizing different strike ranges.
**Current Chart Focused by Default**: When added to the chart, the script focuses on the strikes closest to the current price. However, users can opt to include strikes on the opposite side of the market for a broader view.
**Instant Market Context**: The displayed
strikes offer a snapshot of the options market and how the current price relates to potential option expiration levels, helping traders understand key zones.
**Visual Clues on Spreads & Volatility**: This script not only displays the strikes but also provides instant visual clues that reflect the volatility and spread of the options market.
---
█ HOW IT WORKS
The script operates by accessing the **options chain** for the underlying asset, identifying the nearest call and put strikes, and plotting them as visual markers on the chart. This real-time strike data is dynamic, adjusting automatically as the market price moves.
Strike Calculation
The script uses the current price of the underlying asset as a base point and calculates the nearby **options strikes** from the **options chain**.
Depending on the user's settings, the script will plot up to 9 strikes on either side of the price level.
This calculation is performed using live market data, making sure the plotted strikes always reflect the most current market conditions.
Visual Clues
**Spreads**: The space between the plotted call and put options strikes provides immediate insights into the current bid/ask spreads. If the spread between strike prices is wide, it suggests increased volatility or a higher level of uncertainty in the market. Conversely, narrow spreads often indicate market stability or a lack of price movement.
**Market Basing**: When options strikes form a concentrated group near a certain price level, it can indicate that the market is building up or basing at a key level. This might signal the potential for a breakout or a reversal.
**Volatility Insights**: Wider gaps between strikes, particularly on the call side versus the put side (or vice versa), can indicate an imbalance in options trading activity, often a reflection of higher volatility expectations. This visual clue can help traders assess when the market is pricing in significant movements.
Customization and User Settings
**Number of Strikes**: The number of options strikes shown is fully customizable, allowing users to display 3, 6, or 9 strikes on either side.
**Show Opposite Strikes**: By default, the script shows strikes on the current side of the market, but users can enable the option to show strikes on the opposite side to gain a more complete view of the market's options landscape.
**Strike Colors & Width**: Customize the visual appearance of the plotted strikes by adjusting the color and line width for better clarity and chart aesthetics.
---
█ POTENTIAL USE CASES
This indicator is especially valuable for **options traders**, **market analysts**, and anyone interested in gaining insights into the underlying options market. Here are some of the key use cases:
**Options Traders**: Quickly identify the nearest strike prices and understand the risk/reward potential for options positions. The ability to customize the number of strikes shown allows traders to focus on the most relevant price levels.
**Volatility Monitoring**: Use the visual clues from the spread between strike prices to assess the level of volatility in the options market. A wider spread suggests that options traders are expecting more significant price moves, while a narrow spread indicates less expected movement.
**Support and Resistance Identification**: The clustering of strike prices on one side of the market can indicate a potential support or resistance level. By monitoring these levels, traders can get a sense of where the market may reverse or consolidate.
**Market Sentiment Analysis**: A large concentration of call strikes above the current price level, or put strikes below, can be an indication of market sentiment, such as whether traders are generally bullish or bearish.
**Risk Management**: By tracking nearby options strikes, traders can adjust their strategies to minimize risk, especially when market price levels approach significant strike points.
---
█ FEATURES
**Real-Time Data**: The script pulls data from the **options chain**, ensuring that the plotted strikes are always up-to-date with the current market price.
**User-Friendly Interface**: Clear and customizable inputs allow users to easily adjust the number of strikes displayed and control visual settings such as colors and line widths.
**Visual Strike Indicators**: Instantly spot volatility, market basing, and spread imbalances through visual clues from the plotted strikes, enhancing your market analysis.
---
█ LIMITATIONS
**Accuracy Depends on Market Data**: This indicator relies on the available **options chain** data. While the data is updated in real-time, its accuracy may depend on the liquidity and availability of options contracts in the market.
**Not Suitable for Non-Options Traders**: If you don’t trade options, the relevance of this indicator may be limited as it is designed specifically to provide insight into the options market.
**Data Delays**: In fast-moving markets, there may be a slight delay in the updating of strike prices, depending on the data feed.
---
█ HOW TO USE
**Load the Script**: Add the **Venta's DikFat Spread Visualizer and Options Chain Strike Scanner** script to your TradingView chart.
**Adjust Settings**: Use the input options to select the number of strikes you want to display (3, 6, or 9). You can also choose whether to display only the current chart’s strikes or include strikes from the opposite side.
**Interpret the Strikes**: Look at the plotted strikes to gain insights into where the market is currently pricing options and where major strike prices are located. Pay attention to the spreads, concentrations, and volatility signals.
**Monitor the Market**: As the market moves, watch how the strikes shift and cluster, providing you with real-time information about market sentiment and potential volatility.
---
█ THANKS
We would like to extend our gratitude to the PineCoders community for their ongoing support and contributions to the TradingView Pine Script ecosystem. Special thanks to The Options Team.
CandelaCharts - Fair Value Gap (FVG) 📝 Overview
A Fair Value Gap is a three-candle pattern where an unfilled area exists between the high of the first candle and the low of the third candle. This Fair Value Gap represents a price imbalance and often serves as a level of support or resistance on the price chart.
A Bullish FVG occurs when the high of the first candle is below the low of the third candle, creating a gap in price between them.
A Bearish FVG happens when the low of the first candle is above the high of the third candle, also resulting in a price gap.
The indicator is designed to allow traders to precisely and accurately identify Fair Value Gaps (FVGs) across any chosen time frame. Automatically detecting these price imbalances, highlights potential areas where prices may retrace, providing valuable insights into market support and resistance levels. This capability enables traders to make informed decisions based on the presence of FVGs, enhancing their strategies for entry and exit points across different market conditions and time frames.
📦 Features
MTF
Mitigation
Consequent Encroachment
Threshold
Hide Overlap
Advanced Styling
⚙️ Settings
Show: Controls whether FVGs are displayed on the chart.
Show Last: Sets the number of FVGs you want to display.
Length: Determines the length of each FVG.
Mitigation: Highlights when an FVG has been touched, using a different color without marking it as invalid.
Timeframe: Specifies the timeframe used to detect FVGs.
Threshold: Sets the minimum gap size required for FVG detection on the chart.
Show Mid-Line: Configures the midpoint line's width and style within the FVG. (Consequent Encroachment - CE)
Show Border: Defines the border width and line style of the FVG.
Hide Overlap: Removes overlapping FVGs from view.
Extend: Extends the FVG length to the current candle.
Elongate: Fully extends the FVG length to the right side of the chart.
⚡️ Showcase
Simple
Mitigated
Bordered
Consequent Encroachment
Extended
🚨 Alerts
This script provides alert options for all signals.
Bearish Signal
A bearish signal is triggered when the price moves back into a bearish inversion zone and then reverses downward.
Bullish Signal
A bullish signal is triggered when the price returns to a bullish inversion zone and then breaks upward out of the top.
⚠️ Disclaimer
Trading involves significant risk, and many participants may incur losses. The content on this site is not intended as financial advice and should not be interpreted as such. Decisions to buy, sell, hold, or trade securities, commodities, or other financial instruments carry inherent risks and are best made with guidance from qualified financial professionals. Past performance is not indicative of future results.

Silver Bullet ICT Strategy [TradingFinder] 10-11 AM NY Time +FVG🔵 Introduction
The ICT Silver Bullet trading strategy is a precise, time-based algorithmic approach that relies on Fair Value Gaps and Liquidity to identify high-probability trade setups. The strategy primarily focuses on the New York AM Session from 10:00 AM to 11:00 AM, leveraging heightened market activity within this critical window to capture short-term trading opportunities.
As an intraday strategy, it is most effective on lower timeframes, with ICT recommending a 15-minute chart or lower. While experienced traders often utilize 1-minute to 5-minute charts, beginners may find the 1-minute timeframe more manageable for applying this strategy.
This approach specifically targets quick trades, designed to take advantage of market movements within tight one-hour windows. By narrowing its focus, the Silver Bullet offers a streamlined and efficient method for traders to capitalize on liquidity shifts and price imbalances with precision.
In the fast-paced world of forex trading, the ability to identify market manipulation and false price movements is crucial for traders aiming to stay ahead of the curve. The Silver Bullet Indicator simplifies this process by integrating ICT principles such as liquidity traps, Order Blocks, and Fair Value Gaps (FVG).
These concepts form the foundation of a tool designed to mimic the strategies of institutional players, empowering traders to align their trades with the "smart money." By transforming complex market dynamics into actionable insights, the Silver Bullet Indicator provides a powerful framework for short-term trading success
Silver Bullet Bullish Setup :
Silver Bullet Bearish Setup :
🔵 How to Use
The Silver Bullet Indicator is a specialized tool that operates within the critical time windows of 9:00-10:00 and 10:00-11:00 in the forex market. Its design incorporates key principles from ICT (Inner Circle Trader) methodology, focusing on concepts such as liquidity traps, CISD Levels, Order Blocks, and Fair Value Gaps (FVG) to provide precise and actionable trade setups.
🟣 Bullish Setup
In a bullish setup, the indicator starts by marking the high and low of the session, serving as critical reference points for liquidity. A typical sequence involves a liquidity grab below the low, where the price manipulates retail traders into selling positions by breaching a key support level.
This movement is often orchestrated by smart money to accumulate buy orders. Following this liquidity grab, a market structure shift (MSS) occurs, signaled by the price breaking the CISD Level—a confirmation of bullish intent. The indicator then highlights an Order Block near the CISD Level, representing the zone where institutional buying is concentrated.
Additionally, it identifies a Fair Value Gap, which acts as a high-probability area for price retracement and trade entry. Traders can confidently take long positions when the price revisits these zones, targeting the next significant liquidity pool or resistance level.
Bullish Setup in CAPITALCOM:US100 :
🟣 Bearish Setup
Conversely, in a bearish setup, the price manipulates liquidity by creating a false breakout above the high of the session. This move entices retail traders into long positions, allowing institutional players to enter sell orders.
Once the price reverses direction and breaches the CISD Level to the downside, a change of character (CHOCH) becomes evident, confirming a bearish market structure. The indicator highlights an Order Block near this level, indicating the origin of the institutional sell orders, along with an associated FVG, which represents an imbalance zone likely to be revisited before the price continues downward.
By entering short positions when the price retraces to these levels, traders align their strategies with the anticipated continuation of bearish momentum, targeting nearby liquidity voids or support zones.
Bearish Setup in OANDA:XAUUSD :
🔵 Settings
Refine Order Block : Enables finer adjustments to Order Block levels for more accurate price responses.
Mitigation Level OB : Allows users to set specific reaction points within an Order Block, including: Proximal: Closest level to the current price. 50% OB: Midpoint of the Order Block. Distal: Farthest level from the current price.
FVG Filter : The Judas Swing indicator includes a filter for Fair Value Gap (FVG), allowing different filtering based on FVG width: FVG Filter Type: Can be set to "Very Aggressive," "Aggressive," "Defensive," or "Very Defensive." Higher defensiveness narrows the FVG width, focusing on narrower gaps.
Mitigation Level FVG : Like the Order Block, you can set price reaction levels for FVG with options such as Proximal, 50% OB, and Distal.
CISD : The Bar Back Check option enables traders to specify the number of past candles checked for identifying the CISD Level, enhancing CISD Level accuracy on the chart.
🔵 Conclusion
The Silver Bullet Indicator is a cutting-edge tool designed specifically for forex traders who aim to leverage market dynamics during critical liquidity windows. By focusing on the highly active 9:00-10:00 and 10:00-11:00 timeframes, the indicator simplifies complex market concepts such as liquidity traps, Order Blocks, Fair Value Gaps (FVG), and CISD Levels, transforming them into actionable insights.
What sets the Silver Bullet Indicator apart is its precision in detecting false breakouts and market structure shifts (MSS), enabling traders to align their strategies with institutional activity. The visual clarity of its signals, including color-coded zones and directional arrows, ensures that both novice and experienced traders can easily interpret and apply its findings in real-time.
By integrating ICT principles, the indicator empowers traders to identify high-probability entry and exit points, minimize risk, and optimize trade execution. Whether you are capturing short-term price movements or navigating complex market conditions, the Silver Bullet Indicator offers a robust framework to enhance your trading performance.
Ultimately, this tool is more than just an indicator; it is a strategic ally for traders who seek to decode the movements of smart money and capitalize on institutional strategies. With the Silver Bullet Indicator, traders can approach the market with greater confidence, precision, and profitability.
