M2 Global Liquidity Index - 10 Week Lead
M2 Global Liquidity Index - Forward Projection (10 Weeks)
This indicator provides a 10-week forward projection of the M2 Global Liquidity Index, offering traders insight into potential future market conditions based on global money supply trends.
What This Indicator Shows
The M2 Global Liquidity Index aggregates M2 money stock data from five major economies:
- China (CNY)
- United States (USD)
- European Union (EUR)
- Japan (JPY)
- Great Britain (GBP)
All values are converted to USD and presented as a unified global liquidity metric, providing a comprehensive view of worldwide monetary conditions.
Forward Projection Feature
This adaptation displays the indicator 10 weeks ahead of the current price, allowing you to visualize potential future liquidity conditions that might influence market behavior. The projection maintains data integrity while providing an advanced view of the liquidity landscape.
Trading Applications
- Anticipate potential market reactions to changing global liquidity conditions
- Identify divergences between projected liquidity and current price action
- Develop longer-term strategic positions based on forward liquidity projections
- Enhance your macro-economic analysis toolkit
Credit
This indicator is an adaptation of the original "M2 Global Liquidity Index" created by Mik3Christ3ns3n. Full credit for the original concept and implementation goes to the original author. This version simply adds a 10-week forward projection to the existing calculations.
Disclaimer
This indicator is for informational purposes only and should be used as one of many tools in your analysis. Past performance and projections are not guarantees of future results.
Tìm kiếm tập lệnh với "index"

Market Participation Index [PhenLabs]📊 Market Participation Index
Version: PineScript™ v6
📌 Description
Market Participation Index is a well-evolved statistical oscillator that constantly learns to develop by adapting to changing market behavior through the intricate mathematical modeling process. MPI combines different statistical approaches and Bayes’ probability theory of analysis to provide extensive insight into market participation and building momentum. MPI combines diverse statistical thinking principles of physics and information and marries them for subtle changes to occur in markets, levels to become influential as important price targets, and pattern divergences to unveil before it is visible by analytical methods in an old-fashioned methodology.
🚀 Points of Innovation:
Automatic market condition detection system with intelligent preset selection
Multi-statistical approach combining classical and advanced metrics
Fractal-based divergence system with quality scoring
Adaptive threshold calculation using statistical properties of current market
🚨 Important🚨
The ‘Auto’ mode intelligently selects the optimal preset based on real-time market conditions, if the visualization does not appear to the best of your liking then select the option in parenthesis next to the auto mode on the label in the oscillator in the settings panel.
🔧 Core Components
Statistical Foundation: Multiple statistical measures combined with weighted approach
Market Condition Analysis: Real-time detection of market states (trending, ranging, volatile)
Change Point Detection: Bayesian analysis for finding significant market structure shifts
Divergence System: Fractal-based pattern detection with quality assessment
Adaptive Visualization: Dynamic color schemes with context-appropriate settings
🔥 Key Features
The indicator provides comprehensive market analysis through:
Multi-statistical Oscillator: Combines Z-score, MAD, and fractal dimensions
Advanced Statistical Components: Includes skewness, kurtosis, and entropy analysis
Auto-preset System: Automatically selects optimal settings for current conditions
Fractal Divergence Analysis: Detects and grades quality of divergence patterns
Adaptive Thresholds: Dynamically adjusts overbought/oversold levels
🎨 Visualization
Color-coded Oscillator: Gradient-filled oscillator line showing intensity
Divergence Markings: Clear visualization of bullish and bearish divergences
Threshold Lines: Dynamic or fixed overbought/oversold levels
Preset Information: On-chart display of current market conditions
Multiple Color Schemes: Modern, Classic, Monochrome, and Neon themes
Classic
Modern
Monochrome
Neon
📖 Usage Guidelines
The indicator offers several customization options:
Market Condition Settings:
Preset Mode: Choose between Auto-detection or specific market condition presets
Color Theme: Select visual theme matching your chart style
Divergence Labels: Choose whether or not you’d like to see the divergence
✅ Best Use Cases:
Identify potential market reversals through statistical divergences
Detect changes in market structure before price confirmation
Filter trades based on current market condition (trending vs. ranging)
Find optimal entry and exit points using adaptive thresholds
Monitor shifts in market participation and momentum
⚠️ Limitations
Requires sufficient historical data for accurate statistical analysis
Auto-detection may lag during rapid market condition changes
Advanced statistical calculations have higher computational requirements
Manual preset selection may be required in certain transitional markets
💡 What Makes This Unique
Statistical Depth: Goes beyond traditional indicators with advanced statistical measures
Adaptive Intelligence: Automatically adjusts to current market conditions
Bayesian Analysis: Identifies statistically significant change points in market structure
Multi-factor Approach: Combines multiple statistical dimensions for confirmation
Fractal Divergence System: More robust than traditional divergence detection methods
🔬 How It Works
The indicator processes market data through four main components:
Market Condition Analysis:
Evaluates trend strength, volatility, and price patterns
Automatically selects optimal preset parameters
Adapts sensitivity based on current conditions
Statistical Oscillator:
Combines multiple statistical measures with weights
Normalizes values to consistent scale
Applies adaptive smoothing
Advanced Statistical Analysis:
Calculates higher-order statistical moments
Applies information-theoretic measures
Detects distribution anomalies
Divergence Detection:
Uses fractal theory to identify pivot points
Detects and scores divergence quality
Filters signals based on current market phase
💡 Note:
The Market Participation Index performs optimally when used across multiple timeframes for confirmation. Its statistical foundation makes it particularly valuable during market transitions and periods of changing volatility, where traditional indicators often fail to provide clear signals.

Weighted Relative Strength Index [SeerQuant]Weighted Relative Strength Index (WRSI)
The Weighted Relative Strength Index (WRSI) is an advanced momentum oscillator that enhances the traditional RSI by incorporating customizable weighting methods and moving average smoothing. With dynamic threshold logic, color-coded visuals, and optional candle coloring, the WRSI provides traders with a versatile tool for identifying trends, overbought/oversold conditions, and momentum shifts.
⚙️ How It Works
1. Weighted Momentum Calculation
The indicator calculates price changes (delta) and applies a user-defined weighting method (e.g., Volume, Momentum, Volatility, or Reversion Factor) to emphasize specific market dynamics.
2. Custom Moving Average Integration
Weighted upward and downward price movements are smoothed using a selectable moving average type (e.g., SMA, EMA, TEMA, etc.), producing a weighted RSI that blends momentum and trend data.
3. Smoothed RSI Output
An additional moving average is applied to the weighted RSI for a smoothed version, offering a clearer view of momentum trends.
4. Threshold Logic
Bullish (Uptrend): WRSI exceeds the upper neutral zone boundary (50 + Neutral Zone).
Bearish (Downtrend): WRSI falls below the lower neutral zone boundary (50 - Neutral Zone).
Neutral: WRSI remains within the neutral zone.
Extreme overbought (90+) and oversold (20-) levels are marked with X’s for quick identification.
5. Dynamic Visual Representation
A color-coded line reflects the WRSI, adjusting hues based on trend direction.
Gradient fills highlight overbought/oversold zones and neutral areas.
Optional candle coloring ties price action to WRSI or smoothed RSI values.
A histogram-style fill between the WRSI and midline enhances trend strength visibility.
✨ Customizable Settings
Calculation Settings:
Calculation Source: Select the price source (default: close).
Calculation Length: Set the lookback period for RSI calculation (default: 14).
Moving Average Type: Choose from SMA, EMA, RMA, WMA, VWMA, LSMA, HMA, ALMA, DEMA, or TEMA (default: RMA).
Moving Average Length: Adjust the smoothing period for the weighted RSI (default: 8).
Neutral Zone Range: Define the width of the neutral zone around the midline (default: 5).
RSI Weighting Method:
Volume: Weights by trading volume.
Momentum: Weights by absolute price momentum.
Volatility: Weights by standard deviation.
Reversion Factor: Weights inversely to variance for mean-reversion emphasis (default: Momentum).
Style Settings:
Colour Choice: Pick from predefined schemes: Default, Modern, Cool, or Monochrome (default: Default).
Use Custom Colors?: Toggle to use custom bull, bear, and neutral colors (default: false).
Bull/Bear/Neutral Colors: Set custom colors when enabled (default: green/red/gray).
Candle Color Mode: Color candles based on WRSI or smoothed RSI (default: RSI).
Color Candles?: Enable/disable candle coloring (default: false).
🚀 Features and Benefits
Weighted Momentum Analysis: Enhances RSI with dynamic weighting for deeper market insights.
Flexible Smoothing: Multiple MA types and adjustable lengths adapt to various trading styles.
Visual Intuition: Color-coded outputs, gradient fills, and optional candle coloring simplify trend analysis.
Customizable Thresholds: Neutral zone and extreme levels cater to individual strategies.
Overbought/Oversold Signals: Clear markers for extreme conditions improve decision-making.
📜 Disclaimer
This indicator is for educational purposes only and does not constitute financial advice. Past performance does not guarantee future results. Always consult a licensed financial advisor before making trading decisions. Use at your own risk.

Volume Delta Imbalance Index [PhenLabs]📊 Volume Delta Imbalance Index (VDII)
Version: PineScript™ v6
Description
The Volume Delta Imbalance Index is an advanced technical analysis tool that combines volume profile analysis with price movement dynamics to identify significant market imbalances. It features a sophisticated analysis system that weighs recent versus historical volume delta imbalance patterns, providing traders with insights into potential market reversals and trend continuation scenarios.
Points of Innovation:
Custom volume delta calculation incorporating price and volume relationships
Adaptive smoothing system based on market volatility
Multi-component analysis combining flow, acceleration, and strength metrics
Real-time volume profile integration with historical context
🔧 Core Components
Volume Profile Analysis: Dynamic volume delta imbalance distribution assessment
Flow Imbalance Detection: Buy/sell pressure evaluation
Strength Analysis: Composite market strength measurement
Acceleration Framework: Volume movement dynamics
Statistical Bands: Adaptive threshold system
🚨 Key Features 🚨
The indicator provides comprehensive analysis through:
Volume Delta: Up to date volume imbalance measurement
Market Structure: Support/resistance level identification
Flow Analysis: Buy/sell pressure visualization
Acceleration Signals: Movement momentum detection
Adaptive Bands: Dynamic overbought/oversold levels
📈 Visualization
Color-coded Columns: Shows direction and strength of imbalance
Signal Lines: Strong buy/sell level indicators
Statistical Bands: Shows normal trading ranges
Gradient Fills: Indicates extreme market conditions
Dynamic Opacity: Reflects trend strength
📌 Usage Guidelines
The indicator offers several customization options:
Basic Settings:
Lookback Period: Analysis timeframe adjustment
Sensitivity Level: Signal response calibration
History Depth: Historical context range
Memory Setting: Recent vs. historical data weight
Visual Settings:
Color Scheme: Bullish/bearish signal colors
Signal Levels: Strong buy/sell thresholds
Band Display: Statistical range visualization
✅ Best Use Cases / Things To Look For:
Wait for establishment in the initial trend when the VDII comes back towards zero and the color of the volume becomes more faint
Once this is established and the VDII pushes through to the other side look for small retracements above the zero line on the VDII leading you to believe it is a likely area for price to retrace and continue in its prior direction
Make sure you see the volume bars become more faint in color to give yo further confluence price will continue in its priorly established direction
⚠️ Limitations
Requires sufficient volume data
Most effective in liquid markets
Historical depth affects calculation speed
Possible lag in highly volatile conditions
What Makes This Unique
Composite Volume Analysis: Combines multiple volume metrics
Adaptive Calculation: Adjusts to market volatility
Profile Integration: Incorporates volume profile analysis
Multi-component Scoring: Weighted analysis system
Memory-efficient Design: Optimized for real-time analysis
🔧 How It Works
The indicator processes market data through four main components:
1. Volume Profile Analysis:
Creates dynamic volume delta distribution profiles
Weights recent versus historical data
Identifies significant price levels
2. Flow Imbalance Detection:
Analyzes buying versus selling pressure
Calculates normalized flow ratios
Determines market bias
3. Strength Analysis:
Measures composite market strength
Incorporates volume-weighted movements
Provides trend strength indication
4. Final Score Calculation:
Combines all components with weighted importance
Applies volatility-based smoothing
Generates final signal output
5. VDII Potential Reversal Confluences
Bars between signal confluence is default set to 10 but you can change it to whatever you’d prefer
Signals are a compiled look at the indicator as a whole determining where it think reversals or retracements are likely
💡 Note:
The indicator performs best in markets with consistent volume and clear trending or ranging conditions. Its sophisticated volume analysis provides valuable insights into market dynamics beyond traditional price-based indicators.

Volatility-Volume Index (VVI)Volatility-Volume Index (VVI) – Indicator Description
The Volatility-Volume Index (VVI) is a custom trading indicator designed to identify market consolidation and anticipate breakouts by combining volatility (ATR) and trading volume into a single metric.
How It Works
Measures Volatility : Uses a 14-period Average True Range (ATR) to gauge price movement intensity.
Tracks Volume : Monitors trading activity to identify accumulation or distribution phases.
Normalization : ATR and volume are normalized using their respective 20-period Simple Moving Averages (SMA) for a balanced comparison.
Interpretation
VVI < 1: Low volatility and volume → Consolidation phase (range-bound market).
VVI > 1: Increased volatility and/or volume → Potential breakout or trend continuation.
How to Use VVI
Detect Consolidation:
Look for extended periods where VVI remains below 1.
Confirm with sideways price movement in a narrow range.
Anticipate Breakouts:
A spike above 1 signals a possible trend shift or breakout.
Why Use VVI?
Unlike traditional volatility indicators (ATR, Bollinger Bands) or volume-based tools (VWAP), VVI combines both elements to provide a clearer picture of consolidation zones and breakout potential.

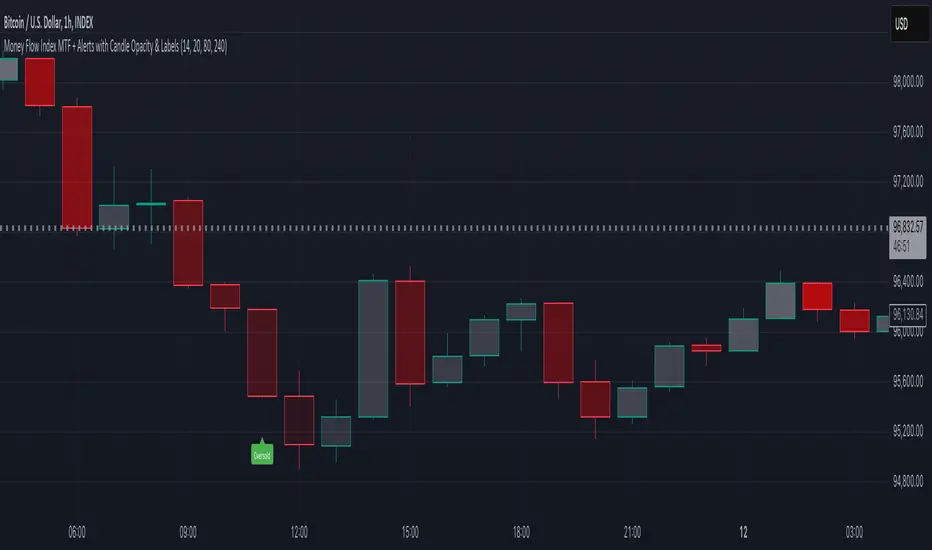
Money Flow Index MTF + Alerts with Candle Opacity & LabelsHow to Use the Money Flow Index MTF + Alerts with Candle Opacity & Labels Indicator
Overview:
This indicator is designed to help you gauge the buying and selling pressure in a market by using the Money Flow Index (MFI). Unlike many momentum oscillators, the MFI incorporates both price and volume, providing a unique perspective on market activity. It is particularly useful when you want to visually assess potential overbought or oversold conditions.
Indicator Components:
Money Flow Index (MFI) Calculation:
The indicator computes the MFI using a user-defined look-back period (default is 14 bars). The MFI is scaled between 0 and 100, where values above 80 typically indicate overbought conditions and values below 20 suggest oversold conditions.
Multi-Timeframe (MTF) Capability:
You can choose to calculate the MFI using either the current chart’s timeframe or a custom timeframe (for example, a 4-hour chart). This flexibility allows you to compare longer-term money flow trends against your primary trading timeframe.
Candle Opacity Based on MFI:
The opacity of the candles on your chart is dynamically adjusted based on the current MFI reading. When the MFI is high (near 100), candles become more opaque; when the MFI is low (near 0), candles appear more transparent. This visual cue can help you quickly spot changes in market momentum.
Visual Labels for Overbought/Oversold Conditions:
When the MFI crosses into the overbought territory, a red label reading “Overbought” is displayed above the high of the bar. Similarly, when it crosses into the oversold territory, a green label reading “Oversold” is placed below the low of the bar. These labels provide an immediate visual alert to potential reversal points or areas of caution.
Alert Conditions:
The script also includes alert conditions for both overbought and oversold signals. You can set up TradingView alerts so that you are notified in real time when the indicator detects these conditions.
Theory Behind the Money Flow Index (MFI):
The Money Flow Index is a momentum oscillator that uses both price and volume to signal the strength behind price moves.
Overbought Conditions: When the MFI is above 80, it suggests that buying pressure is very strong and the asset might be due for a pullback or consolidation.
Oversold Conditions: Conversely, when the MFI falls below 20, selling pressure is high and the asset might be oversold, potentially priming it for a bounce.
Keep in mind that in strong trending markets, overbought or oversold readings can persist for extended periods, so the MFI should be used in conjunction with other technical analysis tools.
Position Management Guidance:
While the indicator is useful for spotting potential overbought and oversold conditions, it is not designed to serve as an automatic signal to completely close a position. Instead, you might consider using it as a guide for pyramiding—gradually adding to your position over several days rather than exiting all at once. This approach allows you to better manage risk by:
Scaling In or Out Gradually: Instead of making one large position change, you can add or reduce your position in increments as market conditions evolve.
Diversifying Risk: Pyramiding helps you avoid the pitfalls of trying to time the market perfectly on a single trade exit or entry.
How to Get Started:
Apply the Indicator:
Add the indicator to your TradingView chart. Adjust the input settings (length, oversold/overbought levels, and resolution) as needed for your trading style and the market you’re analyzing.
Watch the Candles:
Observe the dynamic opacity of your candles. A sudden change in opacity can be a sign that the underlying money flow is shifting.
Monitor the Labels:
Pay attention to the “Overbought” or “Oversold” labels that appear. Use these cues in combination with your broader analysis to decide if it might be a good time to add to or gradually exit your position.
Set Up Alerts:
Configure TradingView alerts based on the indicator’s alert conditions so that you are notified when the MFI reaches extreme levels.
Use as Part of a Broader Strategy:
Remember, no single indicator should dictate your entire trading decision. Combine MFI signals with other technical analysis, risk management rules, and market insights to guide your trades.
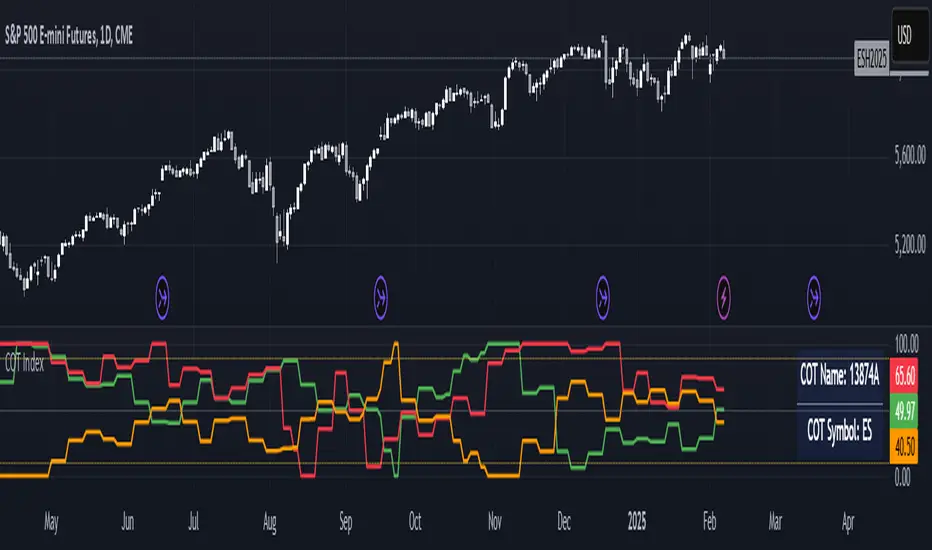
The Commitment of Traders (COT) IndexThe COT Index indicator is used to measure the positioning of different market participants (Large Traders, Small Traders, and Commercial Hedgers) relative to their historical positioning over a specified lookback period. It helps traders identify extreme positioning, which can signal potential reversals or trend continuations.
Key Features of the Indicator:
COT Data Retrieval
The script pulls COT report data from the TradingView COT Library TradingView/LibraryCOT/3).
It retrieves long and short positions for three key groups:
Large Traders (Non-commercial positions) – Speculators such as hedge funds.
Small Traders (Non-reportable positions) – Small retail traders.
Commercial Hedgers (Commercial positions) – Institutions that hedge real-world positions.
Threshold Zones for Extreme Positioning:
Upper Zone Threshold (Default: 90%)
Signals potential overbought conditions (excessive buying).
Lower Zone Threshold (Default: 10%)
Signals potential oversold conditions (excessive selling).
The indicator plots these zones using horizontal lines.
The COT Index should be used in conjunction with technical analysis (support/resistance, trends, etc.). A high COT Index does not mean the market will reverse immediately—it’s an indication of extreme sentiment.
Note:
If the script does not recognize or can't find the ticker currently viewed in the COT report, the COT indicator will default to U.S. Dollar.
Waldo Cloud Bollinger Bands
Waldo Cloud Bollinger Bands Indicator Description for TradingView
Title: Waldo Cloud Bollinger Bands
Short Title: Waldo Cloud BB
Overview:
The Waldo Cloud Bollinger Bands indicator is a sophisticated tool designed for traders looking to combine the volatility analysis of Bollinger Bands with the momentum insights of the Relative Strength Index (RSI) and moving average crossovers. This indicator overlays on your chart, providing a visual representation that helps in identifying potential trading opportunities based on price action, momentum, and trend direction.
Concept:
This indicator merges three key technical analysis concepts:
Bollinger Bands: These are used to measure market volatility. The bands consist of a central moving average (basis) with an upper and lower band that are standard deviations away from this average. In this indicator, you can customize the type of moving average used for the basis (SMA, EMA, SMMA, WMA, VWMA), the length of the period, the source price, and the standard deviation multiplier, offering flexibility to adapt to different market conditions.
Relative Strength Index (RSI): The RSI is incorporated to provide insight into the momentum of price movements. Users can adjust the RSI length and overbought/oversold levels and even choose the price source for RSI calculation, allowing for tailored momentum analysis. The RSI values influence the cloud color between the Bollinger Bands, signaling market conditions.
Moving Average Crossovers: Two moving averages with customizable lengths and types are used to identify trend direction through crossovers. A fast MA (default 20 periods) and a slow MA (default 50 periods) are plotted when enabled, helping to signal potential bullish or bearish market conditions when they cross over each other.
Functionality:
Bollinger Bands Calculation: The basis of the Bollinger Bands is calculated using a user-defined moving average type, with a customizable length, source, and standard deviation multiplier. The upper and lower bands are then plotted around this basis.
RSI Calculation: The RSI is computed using a user-specified source, length, and overbought/oversold levels. This RSI value is used to determine the color of the cloud between the Bollinger Bands, which visually represents market sentiment:
Purple when RSI is overbought.
Blue when RSI is oversold.
Green for bullish conditions (when the fast MA crosses above the slow MA, RSI is bullish, and the price is above the slow MA).
Red for bearish conditions (when the fast MA crosses below the slow MA, RSI is bearish, and the price is below the slow MA).
Gray for neutral conditions.
Trend Analysis: The indicator uses two moving averages to help determine the trend direction.
When the fast MA crosses over the slow MA, it suggests a potential change in trend direction, which, combined with RSI conditions, provides a more comprehensive trading signal.
Customization:
Users can select the type of moving average for all calculations through the "Global MA Type" setting, ensuring consistency in how trends and volatility are interpreted.
The Bollinger Bands settings allow for adjustments in length, source, standard deviation, and offset, giving traders control over how volatility is measured.
RSI settings include the ability to change the RSI source, length, and overbought/oversold thresholds, which can be fine-tuned to match trading strategies.
The option to show or hide moving averages provides clarity on the chart, focusing on either the Bollinger Bands or including the MA crossovers for trend analysis.
Usage:
This indicator is ideal for traders who incorporate both volatility and momentum in their trading decisions.
By observing the color changes in the cloud, along with the position of the price relative to the moving averages, traders can gauge potential entry and exit points.
For instance, a green cloud with a price above the slow MA might suggest a strong buying opportunity, while a red cloud with a price below might indicate selling pressure.
Conclusion:
The Waldo Cloud Bollinger Bands indicator offers a unique blend of volatility, momentum, and trend analysis, providing traders with a multi-faceted view of market conditions. Its customization options make it adaptable to various trading styles and market environments, making it a valuable addition to any trader's toolkit on Trading View.

Relative Strength Index With Range ZoneRSI (Relative Strength Index) with 45-55 Range Zone
1. Introduction and Historical Background
The Relative Strength Index (RSI) is a momentum indicator developed in 1978 by J. Welles Wilder Jr. It measures the speed and magnitude of price changes to assess overbought and oversold conditions of an asset. This widely used oscillator ranges between 0 and 100.
Historically, the RSI was mainly used to detect trend reversals by identifying extreme levels: above 70 (overbought) and below 30 (oversold). However, its application has evolved, and new approaches refine its interpretation, such as adding a 45-55 neutral zone to identify consolidation (range) periods.
2. RSI Calculation
The RSI is calculated using the following formula:
RSI=100−(1001+RS)RSI=100−(1+RS100)
Where:
RS=Average gain over N periodsAverage loss over N periodsRS=Average loss over N periodsAverage gain over N periods
• RS (Relative Strength) is the ratio between the average gains and the average losses over N periods (typically 14 periods).
• Gains and losses are calculated based on daily price variations.
Example calculation with a 14-day period:
1. Compute daily gains and losses.
2. Take an exponential or simple moving average of these values over 14 days.
3. Apply the formula to get the RSI value.
3. Classic RSI Usage
The RSI is typically interpreted as follows:
• RSI > 70: Overbought → Possible correction or bearish reversal.
• RSI < 30: Oversold → Possible rebound or bullish reversal.
• RSI between 50 and 70: Bullish momentum.
• RSI between 30 and 50: Bearish momentum.
4. Adding the 45-55 Zone to Identify Range Phases
Adding a neutral zone between 45 and 55 helps identify consolidation periods, when price moves sideways without a strong trend.
• RSI between 45 and 55: The market is in a range, meaning neither buyers nor sellers dominate.
• RSI breaking out of this zone:
o Above 55: Indicates the start of a bullish trend.
o Below 45: Indicates the start of a bearish trend.
This zone is particularly useful for:
• Avoiding false signals by waiting for trend confirmation.
• Identifying ranging markets, favoring range trading strategies (buying at support, selling at resistance).
• Filtering trend-based entries, waiting for the RSI to exit the 45-55 zone.
5. Trading Strategies Using RSI with the 45-55 Range Zone
1. Range Trading:
• When the RSI oscillates between 45 and 55, it signals a lack of strong trend.
• Strategy:
o Identify a support and resistance level.
o Buy near support when the RSI touches 45.
o Sell near resistance when the RSI touches 55.
2. Breakout Trading:
• If the RSI exits the 45-55 zone:
o Above 55 → Buy (start of a bullish trend).
o Below 45 → Sell (start of a bearish trend).
• This breakout can be used as a confirmed entry signal.
3. Confirmation with Divergences:
• A bullish divergence (price making lower lows while RSI makes higher lows) is more relevant if the RSI moves above 55.
• A bearish divergence (price making higher highs while RSI makes lower highs) is stronger if the RSI drops below 45.
6. Conclusion
The RSI is a powerful tool for analyzing price momentum. Adding a 45-55 zone enhances its usage by clearly distinguishing:
• Consolidation phases (range markets).
• Trend beginnings when RSI breaks out of this range.
This approach improves RSI reliability by filtering out false signals and allowing traders to adapt their strategy based on market conditions.

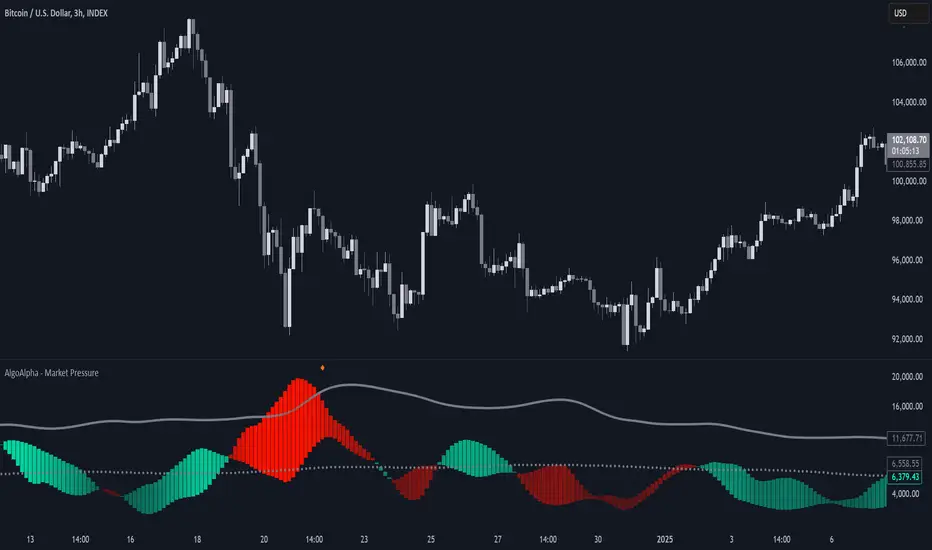
Market Pressure Index [AlgoAlpha]The Market Pressure Index is a cutting-edge trading tool designed to measure and visualize bullish and bearish momentum through a unique blend of volatility analysis and dynamic smoothing techniques. This indicator provides traders with an intuitive understanding of market pressure, making it easier to identify trend shifts, breakout opportunities, and key moments to take profit. Perfect for scalpers and swing traders looking for a strategic edge in volatile markets.
Key Features:
🔎 Bullish and Bearish Volatility Separation : Dynamically calculates and displays bullish and bearish momentum separately, helping traders assess market direction with precision.
🎨 Customizable Appearance: Set your preferred colors for bullish and bearish signals to match your chart's theme.
📊 Deviation-Based Upper Band : Tracks extreme volatility levels using a configurable deviation multiplier, highlighting potential breakout points.
📈 Real-Time Signal Alerts : Provides alerts for bullish and bearish crossovers, as well as take-profit signals, ensuring you never miss key market movements.
⚡ Gradient-Based Visualization : Uses color gradients to depict the intensity of market pressure, making it easy to spot changes in momentum at a glance.
How to Use:
Add the Indicator : Add the Market Pressure Index to your TradingView chart by clicking the star icon. Customize inputs like the pressure lookback period, deviation settings, and colors to fit your trading style.
Interpret the Signals : Monitor the bullish and bearish momentum columns to gauge market direction. Look for crossovers to signal potential trend changes.
Take Action : Use alerts for breakouts above the upper band or for take-profit levels to enhance your trade execution.
How It Works:
The Market Pressure Index separates bullish and bearish momentum by analyzing price movement (close vs. open) and volatility. These values are smoothed using Hull Moving Averages (HMA) to highlight trends while minimizing noise. A deviation-based upper band dynamically tracks market extremes, signaling breakout zones. Color gradients depict the intensity of momentum, offering a clear, visually intuitive representation of market pressure. Alerts are triggered when significant crossovers or take-profit conditions occur, giving traders actionable insights without constant chart monitoring.
Candle Emotion Index (CEI) StrategyThe Candle Emotion Index (CEI) Strategy is an innovative sentiment-based trading approach designed to help traders identify and capitalize on market psychology. By analyzing candlestick patterns and combining them into a unified metric, the CEI Strategy provides clear entry and exit signals while dynamically managing risk. This strategy is ideal for traders looking to leverage market sentiment to identify high-probability trading opportunities.
How It Works
The CEI Strategy is built around three core oscillators that reflect key emotional states in the market:
Indecision Oscillator . Measures market uncertainty using patterns like Doji and Spinning Tops. High values indicate hesitation, signaling potential turning points.
Fear Oscillator . Tracks bearish sentiment through patterns like Shooting Star, Hanging Man, and Bearish Engulfing. Helps identify moments of intense selling pressure.
Greed Oscillator . Detects bullish sentiment using patterns like Marubozu, Hammer, Bullish Engulfing, and Three White Soldiers. Highlights periods of strong buying interest.
These oscillators are averaged into the Candle Emotion Index (CEI):
CEI = (Indecision + Fear + Greed) / 3
This single value quantifies overall market sentiment and drives the strategy’s trading decisions.
Key Features
Sentiment-Based Trading Signals . Long Entry: Triggered when the CEI crosses above a lower threshold (e.g., 0.1), indicating increasing bullish sentiment. Short Entry: Triggered when the CEI crosses above a higher threshold (e.g., 0.2), signaling rising bearish sentiment.
Volume Confirmation . Trades are validated only if volume exceeds a user-defined multiplier of the average volume over the lookback period. This ensures entries are backed by significant market activity.
Break-Even Recovery Mechanism . If a trade moves into a loss, the strategy attempts to recover to break-even instead of immediately exiting at a loss. This feature provides flexibility, allowing the market to recover while maintaining disciplined risk management.
Dynamic Risk Management . Maximum Holding Period: Trades are closed after a user-defined number of candles to avoid overexposure to prolonged uncertainty. Profit-Taking Conditions: Positions are exited when favorable price moves are confirmed by increased volume, locking in gains. Loss Threshold: Trades are exited early if the price moves unfavorably beyond a set percentage of the entry price, limiting potential losses.
Cooldown Period . After a trade is closed, a cooldown period prevents immediate re-entry, reducing overtrading and improving signal quality.
Why Use This Strategy?
The CEI Strategy combines advanced sentiment analysis with robust trade management, making it a powerful tool for traders seeking to understand market psychology and identify high-probability setups. Its unique features, such as the break-even recovery mechanism and volume confirmation, add an extra layer of discipline and reliability to trading decisions.
Best Practices
Combine with Other Indicators . Use trend-following tools (e.g., moving averages, ADX) and momentum oscillators (e.g., RSI, MACD) to confirm signals.
Align with Key Levels . Incorporate support and resistance levels for refined entries and exits.
Multi-Market Compatibility . Apply this strategy to forex, crypto, stocks, or any asset class with strong volume and price action.

Candle Emotion Index (CEI)The Candle Emotion Index (CEI) is a comprehensive sentiment analysis indicator that combines three sub-oscillators—Indecision Oscillator, Fear Oscillator, and Greed Oscillator—to provide a single, unified measure of market sentiment. By analyzing bullish, bearish, and indecisive candlestick patterns, the CEI delivers a holistic view of market emotions and helps traders identify key turning points.
How It Works
Indecision Oscillator: Measures market uncertainty using Doji and Spinning Top candlestick patterns. Scores their presence and normalizes the results over a user-defined lookback period.
Fear Oscillator: Measures bearish sentiment using Shooting Star, Hanging Man, and Bearish Engulfing candlestick patterns. Scores their presence and normalizes the results over a user-defined lookback period.
Greed Oscillator: Measures bullish sentiment using Marubozu, Bullish Engulfing, Hammer, and Three White Soldiers candlestick patterns. Scores their presence and normalizes the results over a user-defined lookback period.
Candle Emotion Index Calculation: The CEI is calculated as the average of the Indecision, Fear, and Greed Oscillators: CEI = (Indecision Oscillator + Fear Oscillator + Greed Oscillator) / 3
Plotting: The CEI is plotted as a single line on the chart, representing overall market sentiment.
Reference lines are added to indicate Low Emotion, Neutral, and High Emotion levels.
The Candle Emotion Index provides a unified perspective on market sentiment by blending indecision, fear, and greed into one easy-to-interpret metric. It serves as a powerful tool for traders seeking to gauge market psychology and identify high-probability trading opportunities. For best results, use the CEI in conjunction with other technical indicators to confirm signals.

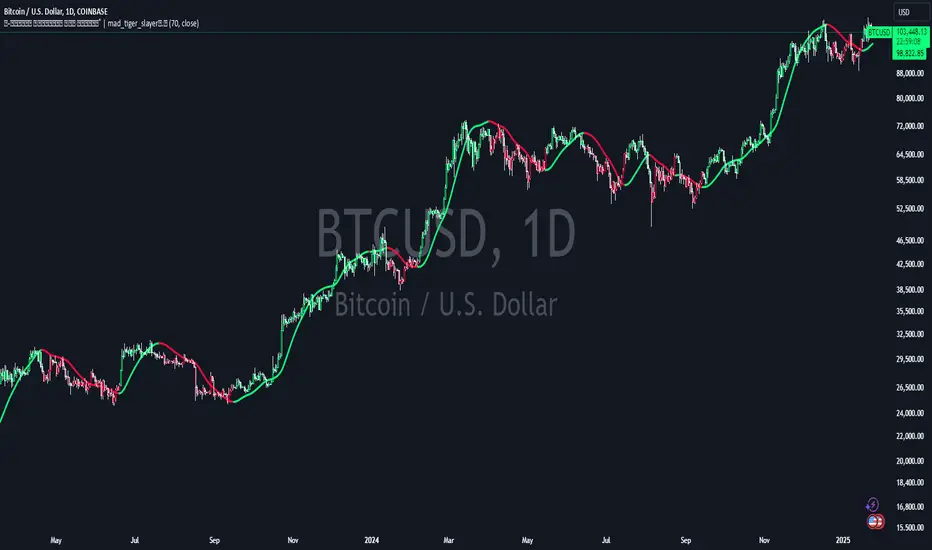
Volume Weighted HMA Index | mad_tiger_slayerTitle: 🍉 Volume Weighted HMA Index | mad_tiger_slayer 🐯
Description:
The Volume Weighted HMA Index is a cutting-edge indicator designed to enhance the accuracy and responsiveness of trading signals by combining the power of volume with the Hull Moving Average (HMA). This indicator adjusts the HMA based on volume-weighted price changes, providing faster and more reliable entry and exit signals while reducing the likelihood of false signals.
Intended and Best Uses:
Used for Strategy Creation:
Extremely Quick Entries and Exits
Intended for Higher timeframe however can be used for scalping paired with additional scripts.
Can be paired to create profitable strategies
TREND FOLLOWING NOT MEAN REVERTING!!!!
[Key Features:
Volume Integration: Dynamically adjusts the HMA using volume data to prioritize higher-volume bars, ensuring that market activity plays a crucial role in signal generation.
Enhanced Signal Clarity: The indicator calculates precise long and short signals by detecting volume-weighted HMA crossovers.
Bar Coloring: Visually differentiate bullish and bearish conditions with customizable bar colors, making trends easier to identify.
Custom Signal Plotting: Optional long and short signal markers for a clear visual representation of potential trade opportunities.
Highly Configurable: Adjust parameters such as volume length and calculation source to tailor the indicator to your trading preferences and strategy.
How It Works:
Volume Weighting: The indicator calculates the HMA using a volume-weighted price change, amplifying the influence of high-volume periods on the moving average.
Trend Identification: Crossovers of the volume-weighted HMA with zero determine trend direction, where:
A bullish crossover signals a long condition.
A bearish crossunder signals a short condition.
Visual Feedback: Bar colors and optional signal markers provide real-time insights into trend direction and trading signals.
Use Cases:
Trend Following: Quickly identify emerging trends with volume-accelerated HMA calculations.
Trade Confirmation: Use the indicator to confirm the strength and validity of your trade setups.
Custom Signal Integration: Combine this indicator with your existing strategies to refine entries and exits.
Notes:
Ensure that your trading instrument provides volume data for accurate calculations. If no volume is available, the script will notify you.
This script works best when combined with other indicators or trading frameworks for a comprehensive market view.
Inspired by the community and designed for traders looking to stay ahead of the curve, the Volume Weighted HMA Index is a versatile tool for traders of all levels.
Relative Volume Index [PhenLabs]Relative Volume Index (RVI)
Version: PineScript™ v6
Description
The Relative Volume Index (RVI) is a sophisticated volume analysis indicator that compares real-time trading volume against historical averages for specific time periods. By analyzing volume patterns and statistical deviations, it helps traders identify unusual market activity and potential trading opportunities. The indicator uses dynamic color visualization and statistical overlays to provide clear, actionable volume analysis.
Components
• Volume Comparison: Real-time volume relative to historical averages
• Statistical Bands: Upper and lower deviation bands showing volume volatility
• Moving Average Line: Smoothed trend of relative volume
• Color Gradient Display: Visual representation of volume strength
• Statistics Dashboard: Real-time metrics and calculations
Usage Guidelines
Volume Strength Analysis:
• Values > 1.0 indicate above-average volume
• Values < 1.0 indicate below-average volume
• Watch for readings above the threshold (default 6.5x) for exceptional volume
Trading Signals:
• Strong volume confirms price moves
• Divergences between price and volume suggest potential reversals
• Use extreme readings as potential reversal signals
Optimal Settings:
• Start with default 15-bar lookback for general analysis
• Adjust threshold (6.5x) based on market volatility
• Use with multiple timeframes for confirmation
Best Practices:
• Combine with price action and other indicators
• Monitor deviation bands for volatility expansion
• Use the statistics panel for precise readings
• Pay attention to color gradients for quick assessment
Limitations
• Requires quality volume data for accurate calculations
• May produce false signals during pre/post market hours
• Historical comparisons may be skewed during unusual market conditions
• Best suited for liquid markets with consistent volume patterns
Note: For optimal results, use in conjunction with price action analysis and other technical indicators. The indicator performs best during regular market hours on liquid instruments.

[LeonidasCrypto]Volume Force IndexVolume Force Index (VFI)
Overview
The Volume Force Index (VFI) is a technical indicator that measures the balance between buying and selling pressure in the market by analyzing volume patterns. It helps traders identify potential trend reversals and confirm trend strength.
What It Measures
Buying vs. selling volume pressure
Market momentum
Potential overbought/oversold conditions
Volume trend strength
How to Read the Indicator
Main Components:
Main Line (Green/Red)
Green: Buying pressure is dominant
Red: Selling pressure is dominant
The steeper the slope, the stronger the pressure
Signal Line (Yellow)
Fast EMA that helps identify trend changes
Acts as an early warning system for potential reversals
Dynamic Bands (Red/Green lines)
Adapt to market volatility
Help identify extreme conditions
Based on actual market volatility rather than fixed levels
Signals to Watch
Trend Direction:
Rising oscillator = Increasing buying pressure
Falling oscillator = Increasing selling pressure
Signal Line Crossovers:
Main line crosses above signal line = Potential bullish signal
Main line crosses below signal line = Potential bearish signal
Band Touches:
Touching upper band = Possible buying exhaustion
Touching lower band = Possible selling exhaustion
Color Changes:
Green to Red = Shift to selling pressure
Red to Green = Shift to buying pressure
Best Practices
When to Use:
Trend confirmation
Identifying potential reversals
Volume analysis
Market strength assessment
Tips:
Use in conjunction with price action
Look for divergences with price
More reliable on higher timeframes
Consider market context
Default Settings:
MA Period: 14 (volume calculation)
Smooth Length: 3 (noise reduction)
EMA Period: 4 (signal line)
Volatility Period: 20 (band calculation)
Volatility Multiplier: 1.5 (band width)
Best Markets to Apply
Any market with reliable volume data
Summary
The VFI is a powerful tool that combines volume analysis with trend identification. Its adaptive nature makes it suitable for various market conditions, but it should be used as part of a complete trading strategy, not in isolation.

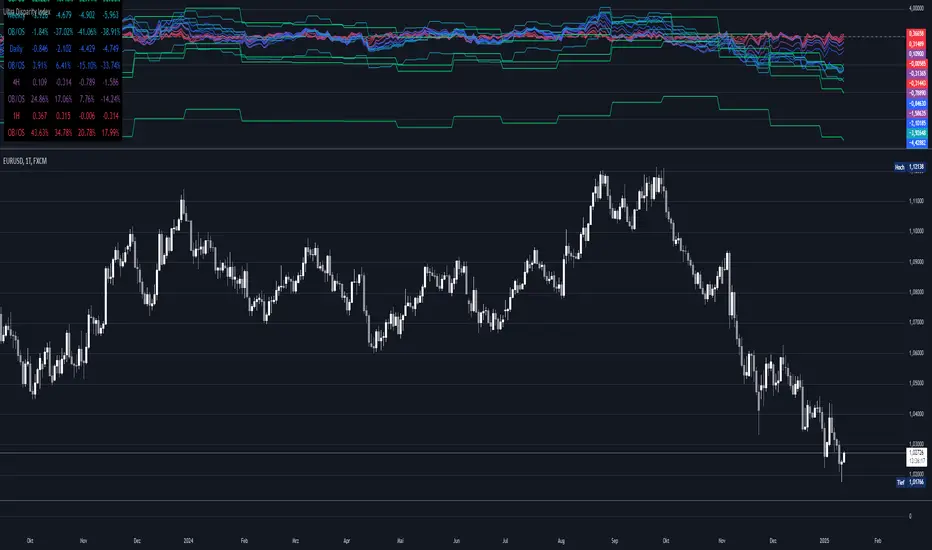
Ultra Disparity IndexGain insights into price movements across multiple timeframes with the Ultra Disparity Index . This indicator highlights overbought/oversold levels based on price disparities from moving averages.
Introduction
The Ultra Disparity Index is designed for traders who seek a deeper understanding of price movements and trends across various timeframes. By analyzing the disparity between the current price and its moving averages, the indicator helps identify overbought and oversold conditions.
Detailed Description
The indicator works by calculating the percentage difference between the current price and its moving averages over four user-defined lengths. It operates on multiple timeframes monthly, weekly, daily, 4-hour, and 1-hour giving traders a comprehensive view of market dynamics.
.........
Disparity Calculation
The indicator computes how far the current price is from moving averages to reveal the degree of disparity.
.....
Overbought/Oversold Zones
By normalizing disparities into percentages relative to the overbought/oversold range, the indicator represents overbought (100%) and oversold (-100%).
.....
Timeframe Flexibility
The user can visualize data from monthly to hourly intervals, ensuring adaptability to different trading strategies.
.....
Customizable Inputs
Users can configure moving average lengths and toggle visibility for specific timeframes and levels.
.........
Summary
The indicator uses simple moving averages (SMAs) as a benchmark for calculating disparity. This disparity is then analyzed using statistical tools, such as standard deviation, to derive meaningful levels. Finally, the results are visualized in a table, providing traders with an easy-to-read summary of disparity values and their respective normalized percentages.
Wickiness IndexWickiness Index - Detect Indecision and Trend Exhaustion
The Wickiness Index is a versatile technical indicator designed to measure the proportion of wicks (upper and lower shadows) relative to the total range of price bars over a specified lookback period. It provides insights into market indecision, reversals, and trend exhaustion by analyzing the structural composition of candlesticks. The indicator calculates the lengths of upper and lower wicks along with the body of each candlestick. Each bar's wick length is expressed as a percentage of the total range (High - Low). The ratio is scaled to 0–100, where 100 represents entirely wicks with no body (indicating pure indecision) and 0 represents no wicks with only body (indicating strong directional movement). These values are then averaged over the lookback period (default = 5 bars) to provide a smoothed representation of wickiness, reducing noise and highlighting trends.
A high value, especially above 70, suggests indecision or potential reversals, as candlesticks dominated by wicks often appear near tops or bottoms. Conversely, low values below 30 indicate trend strength and strong momentum, useful for spotting breakouts and trend continuation. Mid-range values between 30 and 70 often indicate consolidation phases or gradual transitions between trends. Traders can adjust the lookback period to match their trading style, with shorter periods offering faster responses and longer periods providing smoother trends.
This indicator is particularly useful for trend reversal detection, breakout confirmation, and volatility filtering. It scales effectively across all timeframes, making it suitable for both intraday traders and long-term investors. When combined with volume analysis or trend-following indicators, the Wickiness Index can further strengthen trade signals. The visual design includes a blue line for the index and horizontal reference lines at 30 and 70, allowing for quick and intuitive interpretation.
The Wickiness Index offers a unique perspective on market sentiment and price action behavior, providing traders with valuable insights into potential turning points, momentum shifts, and market indecision. It is a powerful tool for improving decision-making in volatile markets and identifying areas where price trends may weaken or reverse.

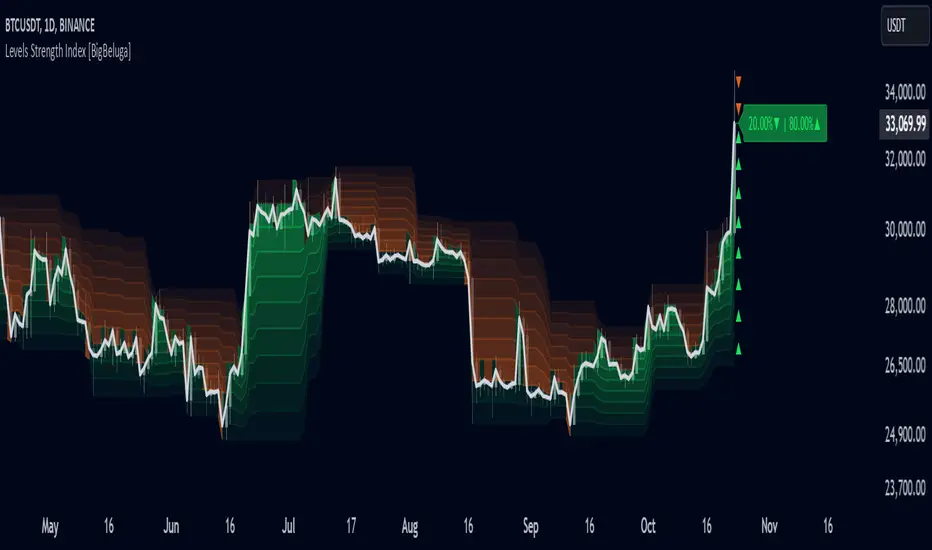
Levels Strength Index [BigBeluga]Levels Strength Index provides a unique perspective on market strength by comparing price positions relative to predefined levels, delivering a dynamic probability-based outlook for potential up and down moves.
🔵 Idea:
The Levels Strength Index analyzes the price position against a series of calculated levels, assigning probabilities for upward and downward movements. These probabilities are displayed in percentage form, providing actionable insights into market momentum and strength. The color-coded display visually reinforces whether the price is predominantly above or below key levels, simplifying trend analysis.
🔵 Key Features:
Dynamic Probability Calculation: The indicator compares the current price position relative to 10 predefined levels, assigning an "Up" and "Down" percentage. For example, if the price is above 8 levels, it will display 80% upward and 20% downward probabilities.
Color-Coded Trend Visualization: When the price is above the majority of levels, the display turns green, signaling strength. Conversely, when below, it shifts to orange, reflecting bearish momentum.
Clear Up/Down Probability Labels: Probabilities are displayed with directional arrows next to the price, instantly showing the likelihood of upward or downward moves.
Probability-Based Price Line: The price line is color-coded based on the probability percentages, allowing a quick glance at the prevailing trend and market strength. This can be toggled in the settings.
Customizable Transparency: Adjust the transparency of the levels to seamlessly integrate the indicator with your preferred chart setup.
Fully Configurable: Control key parameters such as the length of levels and price color mode (trend, neutral, or none) through intuitive settings.
🔵 When to Use:
The Levels Strength Index is ideal for traders looking to:
Identify strong upward or downward market momentum using quantified probabilities.
Visualize price strength relative to key levels with intuitive color coding.
Supplement existing level-based strategies by combining probabilities and market positioning.
Gain instant clarity on potential market moves with percentage-based insights.
Whether you're trading trends or ranges, this tool enhances decision-making by combining level-based analysis with a dynamic probability system, offering a clear, actionable perspective on market behavior.
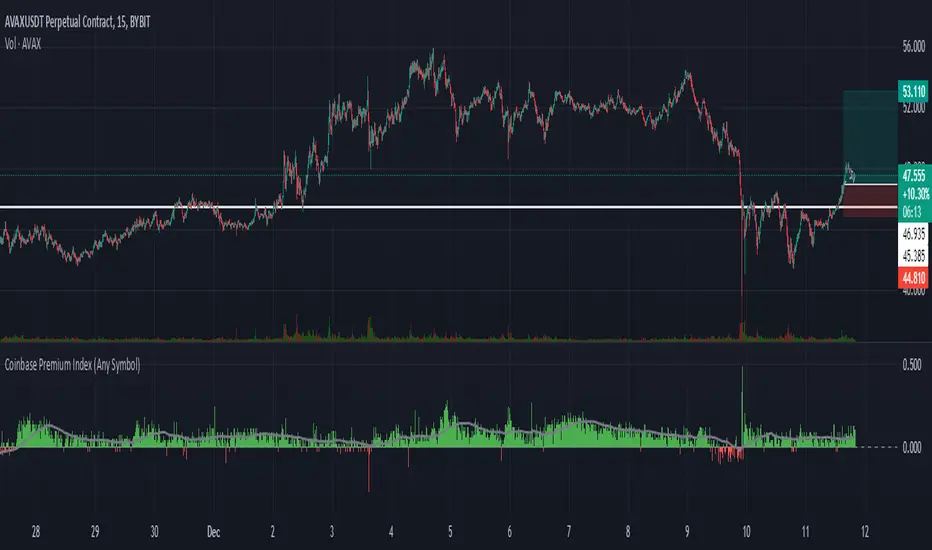
Coinbase Premium Index (Any Symbol)The Coinbase Premium Index provides a valuable insight into market dynamics by calculating the price premium between Coinbase (USD pairs) and Binance (USDT pairs). A positive premium typically indicates heavy buying pressure on Coinbase, often coinciding with upward price trends on lower timeframes. Conversely, a negative premium suggests selling pressure or weaker demand on Coinbase compared to Binance.
** Key Features: **
**Dynamic Symbol Detection**: Automatically detects the current chart symbol and adapts the premium calculation accordingly.
**Customizable Moving Averages**:
Select between SMA (Simple Moving Average) or EMA (Exponential Moving Average).
Adjust the moving average period to suit your trading strategy (default: SMA with 50 periods).
**Error Handling for Missing Data**:
Displays "Symbol not on Coinbase" when the cryptocurrency is unavailable on Coinbase.
Plots zero-value columns in light grey for unsupported symbols.
**Visual Representation**:
Premium values are displayed as columns: green for positive premiums, red for negative premiums.
A moving average line in light grey helps highlight trends.
Zero Line: A horizontal dashed line is included as a reference point.
** Why Use This Script?**
The Coinbase Premium Index helps traders identify moments of increased buying pressure among U.S. investors, often indicative of bullish momentum on lower timeframes. Use this tool to monitor premium dynamics and gain a clearer understanding of market sentiment across major exchanges.
** How to Use: **
Add this script to your TradingView chart.
Adjust the moving average type and period through the input menu.
Use the premium columns and moving averages to identify potential price trends and validate exchange-specific trading opportunities.
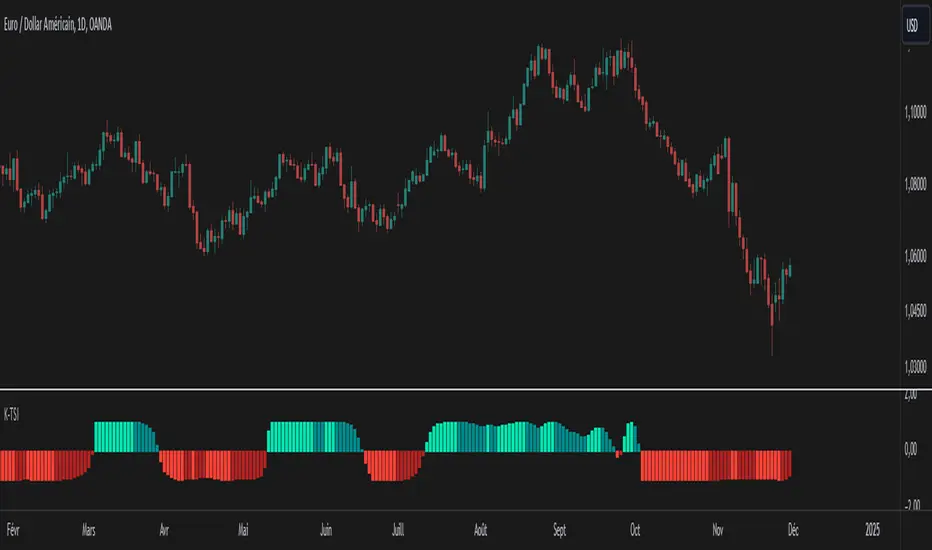
Kalman Trend Strength Index (K-TSI)The Kalman Trend Strength Index (K-TSI) is an innovative technical indicator that combines the Kalman filter with correlation analysis to measure trend strength in financial markets. This sophisticated tool aims to provide traders with a more refined method for trend analysis and market dynamics interpretation.
The use of the Kalman filter is a key feature of the K-TSI. This advanced algorithm is renowned for its ability to extract meaningful signals from noisy data. In financial markets, this translates to smoothing out price action while maintaining responsiveness to genuine market movements. By applying the Kalman filter to price data before performing correlation analysis, the K-TSI potentially offers more stable and reliable trend signals.
The synergy between the Kalman-filtered price data and correlation analysis creates an oscillator that attempts to capture market dynamics more effectively. The correlation component contributes by measuring the strength and consistency of price movements relative to time, while the Kalman filter adds robustness by reducing the impact of market noise. Basing these calculations on Kalman-filtered data may help reduce false signals and provide a clearer picture of underlying market trends.
A notable aspect of the K-TSI is its normalization process. This approach adjusts the indicator's values to a standardized range (-1 to 1), allowing for consistent interpretation across different market conditions and timeframes. This flexibility, combined with the noise-reduction properties of the Kalman filter, positions the K-TSI as a potentially useful tool for various market environments.
In practice, traders might find that the K-TSI offers several potential benefits:
Smoother trend identification, which could aid in detecting the start and end of trends more accurately.
Possibly reduced false signals, particularly in choppy or volatile markets.
Potential for improved trend strength assessment, which might lead to more confident trading decisions.
Consistent performance across different timeframes, due to the adaptive nature of the Kalman filter and the normalization process.
The K-TSI's visual representation as a color-coded histogram further enhances its utility. The changing colors and intensities provide an intuitive way to gauge both the direction and strength of trends, making it easier for traders to quickly assess market conditions.
While the K-TSI builds upon existing concepts in technical analysis, its integration of the Kalman filter with correlation analysis offers traders an interesting tool for market analysis. It represents an attempt to address common challenges in technical analysis, such as noise reduction and trend strength quantification.
As with any technical indicator, the K-TSI should be used as part of a broader trading strategy rather than in isolation. Its effectiveness will depend on how well it aligns with a trader's individual approach and market conditions. For traders looking to explore a more refined trend strength oscillator, the Kalman Trend Strength Index could be a worthwhile addition to their analytical toolkit.
Weighted Average Strength Index (WASI)Weighted Average Strength Index (WASI)
The Weighted Average Strength Index (WASI) is a variation of the standard RSI. It uses the Weighted Moving Average (WMA) instead of the Running Moving Average (RMA), making it more responsive to recent price changes. The hypothesis is that this weighted calculation might better capture momentum shifts, providing traders with more timely insights.
How to Use:
Backtest WASI on your preferred assets and timeframes to evaluate its effectiveness for your strategy.
Use for trend following or mean reversion :
- Overbought/Oversold (OB/OS) levels can signal potential mean-reversion opportunities.
- Midline (50 level) crossovers can be used for trend-following strategies.
- WASI and its moving average (MA) crossovers offer additional trend-following or reversal signals.
Parameters and Their Functions:
WASI Length: Determines the number of periods for WASI calculation. A longer length smooths the indicator but increases lag, while a shorter length makes it more sensitive. (When in doubt, go longer).
Source: The price source for the calculation (e.g., close, open, high, or low).
MA Type: Specifies the type of moving average applied to the WASI (options include SMA, EMA, WMA, HMA, and others).
MA Length: The number of periods for the moving average used on the WASI. Higher will lead to a smoother moving average.
Indicator Features:
Dynamic OB/OS Levels: Default overbought (70) and oversold (30) levels help identify potential reversal zones.
Midline Crossover: WASI crossing above or below the 50 level may indicate a trend shift.
WASI-MA Crossover: Crossovers between WASI and its moving average can signal trend-following or mean-reversion opportunities.
Disclaimer:
This indicator is a tool for analysis and should be used in conjunction with other forms of analysis or confirmation. Past performance does not guarantee future results.

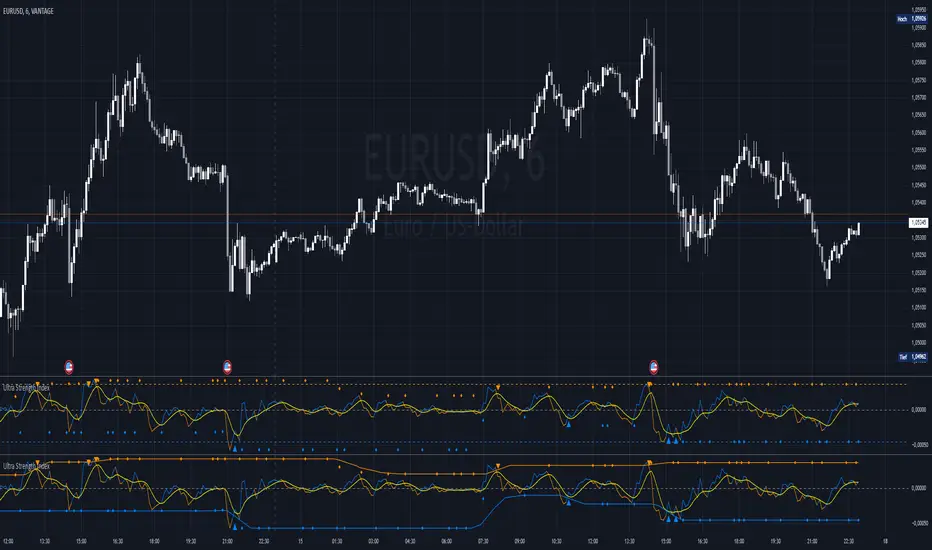
Ultra Strength IndexThe Ultra Strength Index is a momentum-based indicator designed to enhance price action analysis. It identifies overbought/oversold levels and generates buy/sell signals based on momentum shifts. With customizable smoothing and dynamic updates, it suits both trend-following and reversal strategies.
Introduction
The Ultra Strength Index is a powerful tool designed to help traders analyze price momentum, identify trends, and recognize potential turning points in the market. By combining advanced smoothing techniques and customizable settings, it provides a clear visual representation of overbought/oversold conditions and momentum signals, making it suitable for all trading styles.
Detailed Description
The Ultra Strength Index works by analyzing price momentum and visualizing it through smoothed calculations.
Here's how it works:
.........
Impulse Line
Tracks changes in price momentum using a simple moving average (SMA) of the price change. This line reflects the strength and direction of momentum.
.....
Signal Line
A more stable, smoother version of the impulse line, calculated using a Triple Weigthend Moving Average (TWMA) wich created RedKTrader . It acts as a baseline to compare momentum shifts.
.....
Overbought/Oversold Zones
The indicator detects extreme price conditions using historical momentum levels. These levels are dynamically smoothed over a customizable lookback period to minimize noise and ensure reliability.
.....
Repainting Feature
The "Enable Repaint" option offers real-time updating of overbought/oversold levels for more reactive signals, while disabling it provides the actual level for retrospective analysis.
.....
Buy and Sell Signals
The impulse line crosses into or out of overbought/oversold zones. (Triangle)
The impulse line crosses above or below the signal line, indicating potential momentum shifts. (Diamond)
.........
Customizable colors, smoothing periods, and signal settings allow traders to tailor the indicator to their strategy.
Special Thanks
I use the TWMA-Function created from RedKTrader to smooth the values.
Special thanks to him/her for creating and sharing this function!
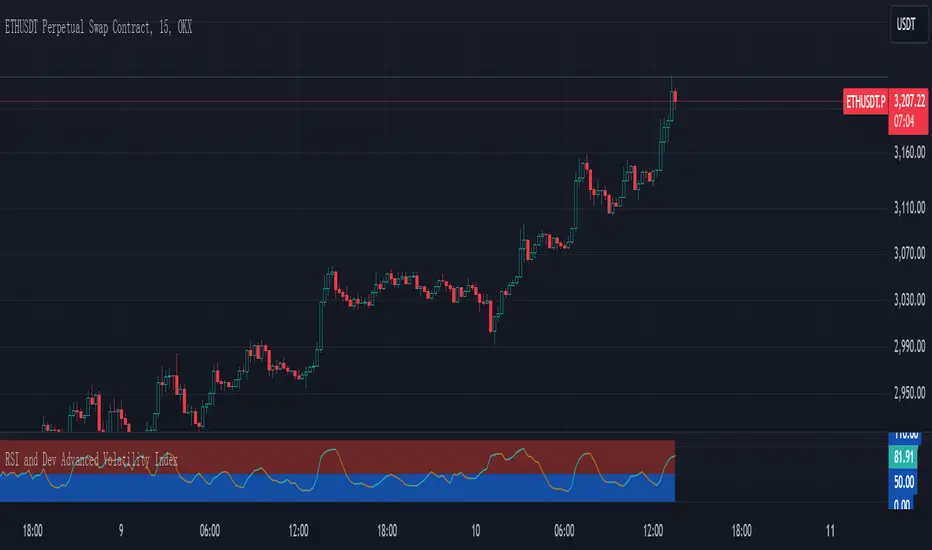
RSI and Dev Advanced Volatility IndexEnglish Explanation of the "RSI and Dev Advanced Volatility Index" Pine Script Code
Understanding the Code
Purpose:
This Pine Script code creates a custom indicator that combines the Relative Strength Index (RSI) and Deviation (DEV) to provide insights into market volatility.
Key Components:
* Deviation (DEV): Calculates the difference between the closing price and the 10-period simple moving average. This measures the extent to which the price deviates from its recent average, indicating volatility.
* RSI: The traditional RSI is then applied to the calculated deviations. This helps to smooth the data and identify overbought or oversold conditions in terms of volatility.
Calculation Steps:
* Deviation Calculation: The difference between the closing price and its 10-period simple moving average is calculated.
* RSI Calculation: The RSI is calculated on the deviations, providing a measure of the speed and change of volatility relative to recent volatility changes.
* Plotting:
* The RSI of the deviations is plotted on the chart.
* Horizontal lines are plotted at 50, 0, and 110 to visually represent different volatility zones.
* The area between the lines is filled with color to highlight low and high volatility regions.
Interpretation and Usage
* Volatility Analysis:
* High Volatility: When the RSI is above 50, it indicates high volatility, suggesting the market might be in a consolidation or trend reversal phase.
* Low Volatility: When the RSI is below 50, it indicates low volatility, suggesting a relatively calm market.
* Trading Signals:
* Buy Signal: When the RSI crosses above 50 from below, it might signal increasing volatility, which could be a buying opportunity.
* Sell Signal: When the RSI crosses below 50 from above, it might signal decreasing volatility, which could be a selling opportunity.
* Risk Management:
* By monitoring volatility, traders can better manage their risk. During periods of high volatility, traders might reduce their position size or adopt more conservative strategies.
Advantages
* Comprehensive: Combines RSI and DEV for a more holistic view of volatility.
* Sensitivity: Quickly responds to changes in market volatility.
* Visual Clarity: Color-coded zones provide a clear visual representation of different volatility levels.
Limitations
* Parameter Sensitivity: The indicator's performance is sensitive to parameter changes, such as the lookback period for the moving average.
* Lag: Like most technical indicators, it has some lag and might not capture every market movement.
* Not Predictive: It can only indicate current and past volatility, not future movements.
Summary
This custom indicator offers a valuable tool for analyzing market volatility. By combining RSI and DEV, it provides a more nuanced perspective on price fluctuations. However, it should be used in conjunction with other technical indicators and fundamental analysis for more robust trading decisions.
Key points to remember:
* Higher RSI values indicate higher volatility.
* Lower RSI values indicate lower volatility.
* Crossovers of the RSI line above or below 50 can provide potential trading signals.
* The indicator should be used in conjunction with other analysis tools for a more complete picture of the market.