Intraweek Highs & Lows🔎 Track and analyze intraweek price extremes with full flexibility.
The indicator detects weekly highs or lows for any selected weekday and monitors when other days break those levels.
⚙️ Inputs
Select day
Pick which weekday’s extreme you want to monitor.
Find Low/High
Select whether you want to track Lows or Highs.
Use candle Wick/Body
Choose if extremes are calculated by full wick or candle body.
Cutoff date
Toggle the date-based filter and choose the starting date for event display.
Tìm kiếm tập lệnh với "low"

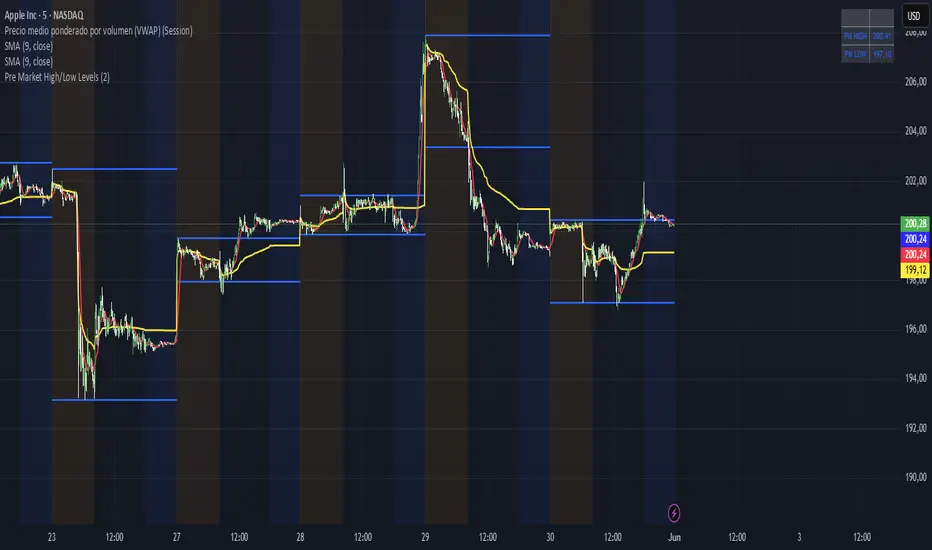
Pre Market High/Low LevelsPre Market High & Pre Market Low By Jadra
Pre Market High/Low Levels Indicator
This indicator automatically identifies pre-market high and low levels (4:00-9:30 AM ET) and marks them with blue horizontal lines that extend throughout the entire trading session. Perfect for NYSE and NASDAQ traders who use these key levels as support and resistance. Features color-coded backgrounds: yellow for pre-market, transparent for regular hours, and blue for post-market. Lines remain visible from pre-market through market close, providing constant visual references for making trading decisions based on these important psychological levels. Essential tool for day traders focusing on overnight price action and gap analysis in US equity markets.
Range Progress TrackerRANGE PROGRESS TRACKER(RPT)
PURPOSE
This indicator helps traders visually and statistically understand how much of the typical price range (measured by ATR) has already been covered in the current period (Daily, Weekly, or Monthly). It includes key features to assist in trend exhaustion analysis, reversal spotting, and smart alerting.
CORE LOGIC
The indicator calculates the current range of the selected time frame (e.g., Daily), which is:
Current Range = High - Low
This is then compared to the ATR (Average True Range) of the same time frame, which represents the average price movement range over a defined period (default is 14).
The comparison is expressed as a percentage, calculated with this formula:
Range % = (Current Range / ATR) × 100
This percentage shows how much of the “average expected move” has already occurred.
WHY IT MATTERS
When the current range approaches or exceeds 100% of ATR, it means the price has already moved as much as it typically does in a full session.
This indicates a lower probability of continuing the trend with a new high or low, especially when the price is already near the session's high or low.
This setup can signal:
A possible consolidation phase
A reversal in trend
The market entering a corrective phase
SMART ALERTS
The indicator can alert you when:
A new high is made after the range percentage exceeds your set threshold.
A new low is made after the range percentage exceeds your set threshold.
You can adjust the Range % Alert Threshold in the settings to tailor it to your trading style.

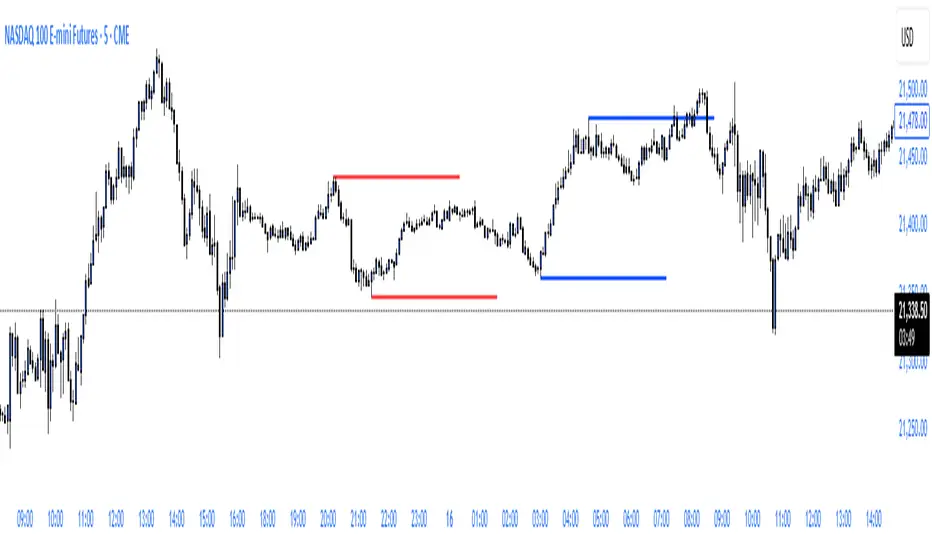
ryantrad3s session highs and lowsThis indicator allows you find London Session and Asia Session highs and lows without marking them yourself. This indicator can also help you find good draws on liquidity for the day and potential highs and lows you can target during that trading day. I recommend trading NQ and ES with this indicator because that's what I seen it work best with. The blue lines are London Session high and low and the red lines are Asia Session high and low. Hope this can save you time marking out your chart before market open.
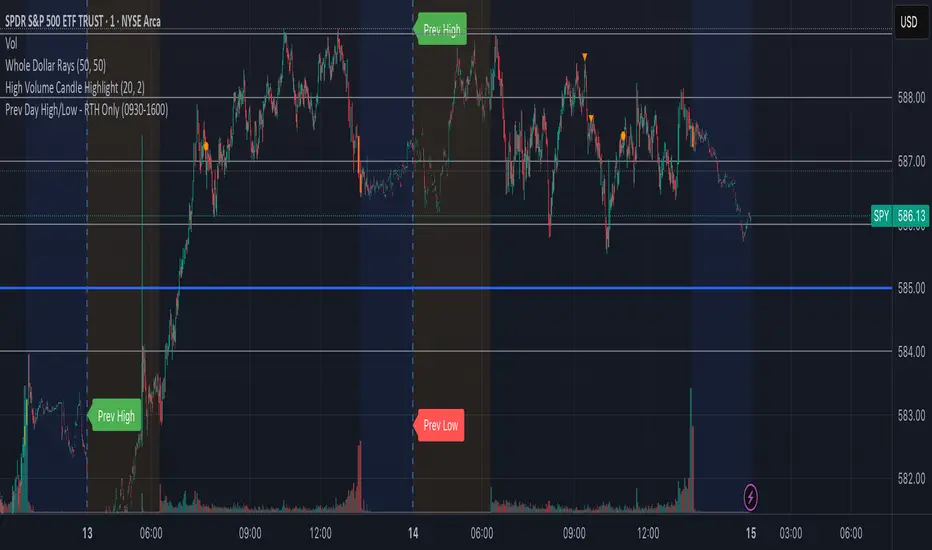
Prev Day High/Low - RTH OnlyThis indicator displays the previous day’s Regular Trading Hours (RTH) high and low levels on your chart, but only during the next day’s RTH session — keeping your charts clean while highlighting the most relevant price zones.
🔧 Features:
RTH Timing: 09:30 to 16:00 (New York time)
Auto-Detection: Automatically tracks the high and low of each RTH session
Next-Day Visibility: Lines are only shown during the following day’s RTH session
Minimal Chart Clutter: Levels disappear after the session ends, keeping focus on what's relevant
Clear Labels: Optional “Prev High” and “Prev Low” markers at market open
📊 Use Case:
Perfect for intraday and 0DTE options traders who rely on prior session key levels for:
Breakout trades
Reversal setups
Support/resistance confluence
These levels are often respected by institutions and algo flows, making them highly actionable when approached in the next RTH session.
🧠 Why This Matters:
Many traders overpopulate their charts with persistent support/resistance lines. This script keeps only what’s essential — the previous day’s RTH range — and only when it matters most: the following day’s active market hours.
Volumetric Tensegrity🧮 Volumetric Tensegrity unifies two of the Leading Indicator suite's critical engines — ZVOL ( volume anomaly detection ) and OBVX ( directional conviction ). Originally designed as a structural economizer for traders navigating strict indicator limits (e.g. < 10 slots per chart), it was forced to evolve beyond that constraint simply to fulfill it, albeit with a difference. The fatal flaw of traditional fusion, where two metrics are blended mathematically, is that they lose scale integrity (i.e. meaning). VTense encodes optical tensegrity to scale the amplitude of the ZVOL histogram and the slope of the OBVX spread independently, so that expansion and direction may coexist without either dominating the frame.
🧬 Tensegrity , by definition, is an intelligent design principle where elements in compression are suspended within a network of continuous tension, forming a stable, self-supporting structure . Originally conceived in esoteric biomorphology (c.f. Da Vinci, Snelson, Casteneda), tensegrity balances force through opposition, not rigidity. Applied to financial markets, Volumetric Tensegrity captures this same principle: price compresses, volume expands, conviction builds or fades — yet structure holds through the interplay. The result is not a prediction engine, but a pressure field — one that visualizes where structure might bend, break, or rebound based on how volume breathes.
🗜️ Rather than layering multiple indicators and consuming precious chart space, VTense frees up room for complementary overlays like momentum mapping, liquidity tiers, or volatility phase detection — making it ideal for modular traders operating in tight technical real estate.
🧠 Core Logic - VTense separates and preserves two essential structural forces:
• ZVOL Histogram : A Z-score-based expansion map that measures current volume deviation from its historical average. It reveals buildup zones, dormant stretches, and breakout pressure — regardless of price behavior.
• OBVX Spread : A directional conviction curve that tracks the difference between On-Balance Volume and its volume-weighted fast trend. It shows whether the crowd is leaning in (accumulation/distribution) or backing off.
🔊 ZVOL controls the amplitude of the histogram, while OBVX controls the curvature and slope of the spread. Without sacrificing breathing behavior or analytical depth, VTense provides a compact yet dynamic lens to track both expansion pressure and directional bias within a single footprint.
🌊 Volumetric Tensegrity forecasts breakout readiness, trend fatigue, and compression zones by measuring the volatility within volume . Unlike traditional tools that track volatility of price, this indicator reveals when effort becomes unstable — signaling inflection points before price reacts. Designed to decode rhythm shifts at the volume level, it operates as a pre-ignition scanner that thrives on low-timeframe charts (15m and under) while scaling effectively to 1H for validation.
🪖 From Generals to Scouts
👀 When used jointly, ZVOL + OBVX act as the general : deep-field analysts confirming stress, commitment, or exhaustion. VTense , by contrast, functions as a scout — capturing subtle buildup and alignment before structure fully reveals itself. The indicator aims to be a literal vanguard, establishing a position that can be confirmed or flexibly abandoned when the higher authority arrives to evaluate.
🥂 Use the ZVOL + OBVX pair when :
• You need independent axis control and manual dissection
• You’re building long-form confluence setups
• You have more indicator slots than you need
🔎 Use VTense when :
• You need compact clarity across multiple instruments
• You’re prioritizing confluence _detection_ over granular separation
• You’re building efficient multi-layered systems under slot constraints
🏗️ Structural Behavior and Interpretation
🫁 Z VOL Respiration Histogram : Structural Effort vs Baseline
🔵 Compression Coil – volume volatility is low and stable; the market is coiling
🟢 Steady Rhythm – volume is healthy but unremarkable; balanced participation
🟡 Passive/Absorbed Effort – expansion failing to manifest; watch for reversal
🟠 Clean Expansion – actionable volatility rise backed by structure
🔴 Volatile Blowout – chaos, climax; likely end-phase or fakeout
⚖️ ZVOL Respiration measures how hard the crowd is pressing — not just that volume is rising, but how statistically abnormal the surge is. Because it is rescaled proportionally to OBVX, the amplitude of the histogram reflects structural urgency without overwhelming the visual field.
🖐️ OBVX Spread : Real-Time Directional Conviction Behind Price Moves
🔑 The curvature of the spread reveals not just directional bias but crowd temp o: sharp slopes = urgent transitions; gradual slopes = building structural shifts. Curvature is key: sharp OBVX slope = urgency; gentle arcs = controlled drift or indecision.
• Green Rising : Accumulation — upward pressure from real buyers
• Red Falling : Distribution — sell pressure, downward slope
• Flat Curves : Transitional → uncertainty, microstructure digestion
🎭 Synchronized vs Divergent Behavior
⏱️ Synchronized (high-confluence) : often precedes structural breakouts, with internal conviction clearly visible before price resolves.
• ZVOL expands (yellow/orange/red) and OBVX climbs steeply green = strong bullish pressure
• ZVOL expands while OBVX steepens red = growing sell-side intent
🪤 Divergent (conflict tension) : flags potential traps, fakeouts, and liquidity sweeps.
• ZVOL expands sharply, but OBVX flattens or opposes → reactive expansion without crowd commitment
⛔️ Latent Drift + Structural Holding Patterns : tensegrity in action — the market holds tension without directional release.
• ZVOL compresses (blue) + OBVX meanders near zero → structure is resting, building up energy
• After prolonged drift, expect violent asymmetry when balance finally breaks
📚 Phase Interpretation: Dynamic Structural Read
• 1️⃣ Quiet Coil : Histogram flat, OBVX flat → no urgency
• 2️⃣ Initial Pulse : Yellow bars, OBVX slope builds → actionable tension
• 3️⃣ Structural Breath : Synchronized expansion and slope → directional commitment
• 4️⃣ Disagreement : Spike in ZVOL, flattening OBVX → exhaustion risk or false signal
💡 Suggested Use
• Run on 15m charts for breakout anticipation and 1H for validation
• Pair with ZVOL + OBVX to confirm crowd conviction behind the tension phase
• Use as a rhythm filter for the suite's trend indicators (e.g., RDI , SUPeR TReND 2.718 , et. al.)
• Ideal during low-volume regimes to detect pressure buildup before triggers
🧏🏻 Volumetric Tensegrity doesn’t signal. It breathes , and listens to pressure shifts before they speak in price. As a scout, it lets you see structural posture before signals align — helping you front-run resolution with clarity, not prediction.

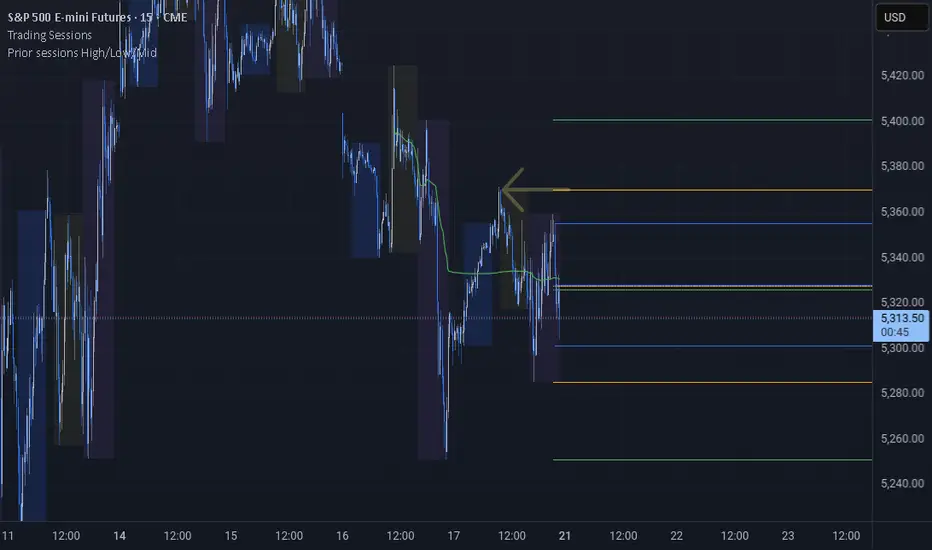
Prior sessions High/Low/MidThis indicator highlights the High, Low, and Midpoint of the most recently completed trading sessions. It helps traders visualize key price levels from the previous session that often act as support, resistance, or reaction zones.
It draws horizontal lines for the high and low of the last completed session, as well as the midpoint, which is calculated as the average of the high and low. These lines extend to the right side of the chart, remaining visible as reference levels throughout the day.
You can independently enable or disable the Tokyo, London, and New York sessions depending on your preferences. Each session has adjustable start and end times, as well as time zone settings, so you can align them accurately with your trading strategy.
This indicator is particularly useful for intraday and swing traders who use session-based levels to define market structure, bias, or areas of interest. Session highs and lows often align with institutional activity and can be key turning points in price action.
Please note that this script is designed to be used only on intraday timeframes such as 1-minute to 4-hour charts. It will not function on daily or higher timeframes.
Session Highs and Lows IndicatorSession Highs and Lows Indicator
This indicator automatically tracks and displays the High and Low prices for major trading sessions:
London
New York
Asia
New York Close
For each session, it plots:
A label at the highest and lowest price point reached during the session.
A dashed line showing the high and low levels extended to the right (until the current bar), helping traders visualize key support/resistance zones.
You can toggle visibility for each session individually through the settings panel.
Session times are set in GMT+8, but you can adjust them in the code if needed.
Color code:
London: Blue
New York: Red
Asia: Green
New York Close: Orange
All lines and labels are semi-transparent to avoid chart clutter.
Ideal for intraday and session-based trading strategies.

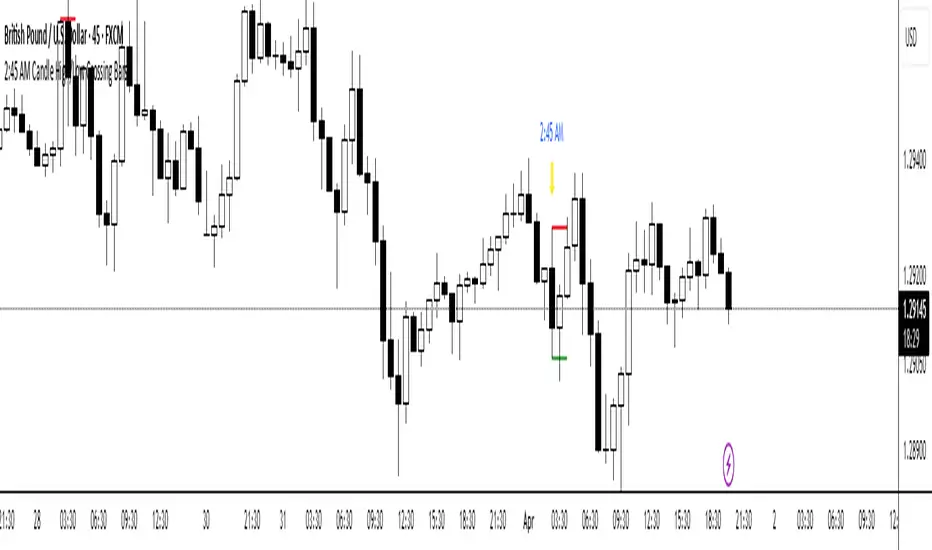
2:45 AM Candle High/Low Crossing Bars2:45 AM Candle High/Low Crossing Bars is an indicator that focuses on the trading view 2:45am NY TIME high and low indicating green for buy and red bars for sell, with the 2:45am new york time highlight/ If the next candle sweeps the low we buy while if it sweeps the high we sell, all time zoon must be the new York UTC time.
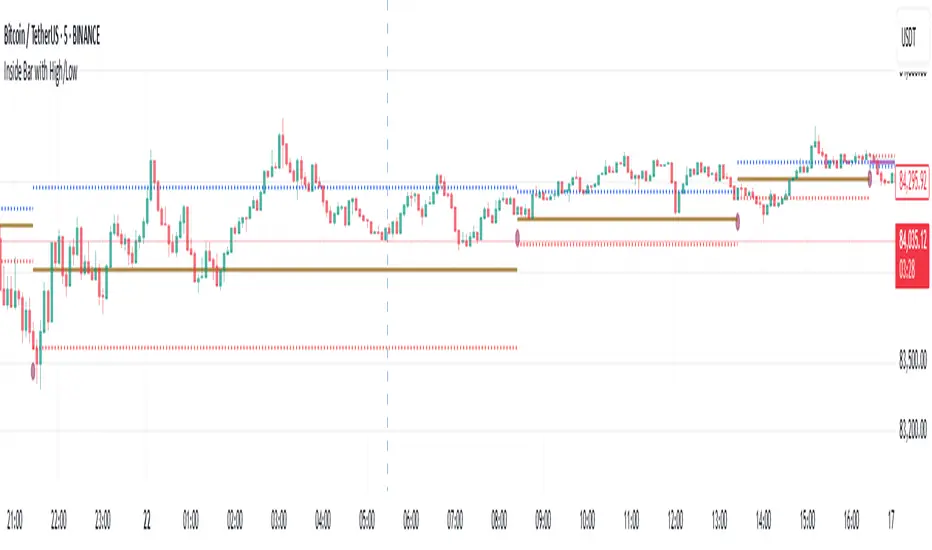
Inside Bar with High/LowInside Bar with High/Low
The indicator plots horizontal mid line between two Inside bars with High / Low with Multi Time Frame Selection by the user which can be traded in trending markets in the direction of the trend, when traded this way they are typically referred to as a ‘Breakout Play’ or an inside bar ‘Price Action Breakout Pattern’ They can also be traded counter-trend, typically from ‘Key Chart Levels’ , when traded this way they are often referred to as ‘Inside Bar Reversals’ .
The classic entry for an inside bar signal is to place a buy stop or sell stop at the high or low of the mother bar, and then when price breakouts above or below the mother bar, your entry order is filled with best time frame preferably more than 1 hour.
Stop loss placement is typically at the opposite end of the mother bar, or it can be placed near the mother bar halfway point (50% level), typically if the mother bar is larger than average.
It’s worth noting that these are the ‘classic’ or standard entry and stop loss placements for an inside bar setup is a useful tool for traders looking to identify potential reversals using the 20/50 EMA and candlestick patterns. However, like any trading tool, it should be used in conjunction with other indicators and analysis techniques for better accuracy
And also this tool is especially useful for day traders who want to track price action during specific times of the day and make informed decisions based on market behavior with more than 60 minutes period
As always, back testing and customization are recommended to optimize performance across different market conditions
In the end, experienced traders may decide on other entries or stop loss placements as they see fit.
Please remember that this indicator is provided for educational purposes only and does not constitute financial advice
JL - DWM OHLCThis indicator plots the following price levels on your chart automatically AND will not show up if you are using a timeframe bigger than 60 minutes, 1 day, or 1 week.
Here are the price levels that are automatically plotted for you, and so you know the styling is different for Daily, Weekly, Monthly levels so you can easily distinguish between them:
- Prior Day: High / Low / Close
- Current Day: Open
- Prior Week: High / Low / Close
- Current Week: Open
- Prior Month: High / Low / Close
- Current Month: Open
These plots are timeframe dependent and will not plot on subsequently higher timeframes, here is how they work:
Daily Price Levels are only shown on timeframes that are smaller than 60 minutes.
Weekly Price Levels are only shown on timeframes smaller than 1 Day.
Monthly Price Levels are only shown on timeframes smaller than 1 Week.
This way, you can turn on the indicator and not have to think about turning off certain price levels if you switch to a larger / longer timeframe than what you typically use.
For example, Daily OHLC price levels will quickly clutter the 60 minute chart, and likely you don't need to know the HLC of the Prior Day if you are looking at the 60 minute chart. Therefor it may be helpful to automatically hide the Daily price level plots, and only show the Weekly and Monthly plots on the 60 minute timeframe.
I hope you find this indicator helpful, thanks for reading.

Premarket High/Low Breakout AlertsPremarket High/Low Breakout Alerts
Description: This custom TradingView indicator helps you track premarket breakouts and breakdowns for a list of selected stocks. The indicator monitors the premarket session and sends an alert every time the stock's price breaks above the premarket high or below the premarket low.
Key Features:
Track Multiple Stocks: Easily monitor multiple stocks (e.g., AAPL, TSLA, NVDA, etc.) and get alerts when they break premarket levels.
Premarket Session Monitoring: The indicator checks for price movements during the premarket session (4:00 AM to 9:30 AM EST).
Customizable Ticker List: Modify the list of tickers directly from the TradingView settings to suit your daily trading needs.
Breakout and Breakdown Alerts: Receive instant alerts for both breakout (above premarket high) and breakdown (below premarket low) conditions.
Plot Premarket Levels: The premarket high and low levels are plotted on the chart for easy reference.
How to Use:
Add this indicator to your chart.
Go to the indicator settings and input your desired stock tickers (e.g., AAPL, TSLA, MSFT).
The indicator will automatically track the premarket levels and send alerts when those levels are broken.
Customize the tickers daily if needed.
Ideal For:
Day Traders who want to track premarket movements.
Swing Traders looking for strong breakouts from premarket levels.
Scalpers who need quick alerts to catch price action early.

Two-Candle Highs & LowsSimple indicator which highlights highs and lows as two-candle reversal patterns:
1. High pattern : A bullish candle followed by a bearish candle, marking the highest price of the two.
2. Low pattern : A bearish candle followed by a bullish candle, marking the lowest price of the two.
It draws horizontal lines at the high/low levels, making it useful for price action analysis such as identifying potential reversals or support/resistance zones.

Smoothed Low-Pass Butterworth Filtered Median [AlphaAlgos]Smoothed Low-Pass Butterworth Filtered Median
This indicator is designed to smooth price action and filter out noise while maintaining the dominant trend. By combining a Butterworth low-pass filter with a median-based smoothing approach , it effectively reduces short-term fluctuations, allowing traders to focus on the true market direction.
How It Works
Median Smoothing: The indicator calculates the 50th percentile (median) of closing prices over a customizable period , making it more robust against outliers compared to traditional moving averages.
Butterworth Filtering: A low-pass filter is applied using an approximation of the Butterworth formula , controlled by the Cutoff Frequency , helping to eliminate high-frequency noise while preserving trends.
EMA Refinement: A 7-period EMA is applied to further smooth the signal, providing a more reliable trend representation.
Features
Trend Smoothing: Reduces market noise and highlights the dominant trend.
Dynamic Color Signals: The EMA line changes color to indicate trend strength and direction.
Configurable Parameters: Customize the median length, cutoff frequency, and EMA length to fit your strategy.
Versatile Use Case: Suitable for both trend-following and mean-reversion strategies.
How to Use
Bullish Signal: When the EMA is below the price and rising , indicating upward momentum.
Bearish Signal: When the EMA is above the price and falling , signaling a potential downtrend.
Reversal Zones: Monitor for trend shifts when the color of the EMA changes.
This indicator provides a clear, noise-free view of market trends , making it ideal for traders seeking improved trend identification and entry signals .

[volfgang] Pivot Levels (Open, Close, High, Low)This script provides a clear and consistent way to track key price levels from Weekly and Daily bars, directly on your current chart interval.
The default colours are;
Today & This Week Open = White
Yesterday & Previous Week Open = Cream
Yesterday's High = Red
Yesterday's Low = Green
Weekly Pivots are 2px, and Daily Pivots are 1px.
Instead of requiring manual referencing of daily or weekly charts, these significant levels are automatically drawn and updated in real time, extending to the right as new bars form.
It adds value by helping traders quickly identify potential support/resistance zones and compare intraday price action with higher-timeframe pivots. This approach can aid in scalping, day trading, or swing trading strategies that rely on past price levels for trade entries, exits, or stop loss placement.
Daily Pivots Displayed Intraday
The script imports the previous day’s High, Low, Open, and Close and draws lines on the current chart, so you can see exactly where those levels lie on any intraday timeframe. You can easily change the colour of these lines in the menu.
Instead of switching between multiple charts for daily references, you can keep an intraday chart open and still watch how price behaves around these important daily pivots.
Weekly Pivots for Broader Context
In addition to daily levels, it also shows the previous week’s Open and Close. This feature helps traders who want to maintain a broader perspective and gauge the market’s weekly trend or bias while remaining on lower timeframes.
Automatic Line & Label Management
Each new trading day triggers a “session change” in the code, prompting the script to delete old lines and labels for daily levels. This keeps your chart from getting cluttered with outdated lines.
Weekly lines and labels follow the same approach, ensuring only the most recent weekly levels are highlighted.
Real-Time Extension
Lines are continuously extended to the right as new bars print, ensuring that you always have an updated view of your key price levels without any manual adjustments.
On the last bar, the script shifts to a time-based coordinate system for seamless visual extension.
Minimal Recalculation
This script uses security() calls in a carefully optimized way to reduce unnecessary recalculations and avoid repaint issues. By referencing open , close , etc., the lines remain fixed once the daily (or weekly) candle is confirmed.
Flexible Usage
You can apply this script to any symbol on TradingView. It’s especially beneficial for Forex pairs, indices, futures, or cryptocurrencies where you want to track significant past levels.
If you’re a scalper looking for areas of likely reaction, or a swing trader watching weekly opens for trend confirmation, these levels can be integral to your technical approach.
How to Use
Add to Chart: Click the “Add to Favorite Indicators” or “Apply to Chart” button once published.
Enable or Disable Previous Day Bars: Use the script’s input to toggle the display of previous day’s High, Low, Open, and Close lines if you only want weekly lines (or vice versa).
Customize Visuals: You can change line colors, width, and label text in the “Style” or “Inputs” tab. Adjust them to fit your preferred color scheme.
Interpretation:
Daily levels typically carry relevance for the next trading session. They can be used for intraday support/resistance, breakout checks, or gap fills.
Weekly levels help identify more prominent zones for bigger moves or for understanding overall sentiment from the prior week.
Conceptual Underpinnings
Support/Resistance: Past opens/closes often act as support or resistance because they represent important points of reference (where trading started or ended during a prior session).
Market Psychology: Many traders watch daily or weekly closes to gauge momentum and bias, which can become self-fulfilling as more participants join around those levels.
Improved Situational Awareness: By having these levels automatically drawn and updated, traders avoid missing critical areas where price may pivot.
This script is intentionally open-source to help traders study and personalize it.
By merging daily and weekly pivot concepts in a single script, it provides a convenient and efficient tool—rather than a simple mashup, it unifies two timeframes that are crucial in short-term and medium-term trading decisions.
Remember that these levels alone do not constitute a complete trading system; they are best used as part of a broader strategy involving risk management, additional technical signals, and market context.

Previous Day High and Low by DRK TradingThe Previous Day High and Low Indicator is a simple yet powerful tool designed for traders who want to keep track of critical levels from the previous trading session. This indicator automatically marks the high and low of the previous day on your chart with dashed horizontal lines, making it easier to identify key support and resistance zones.
Features:
Horizontal Lines: Clearly marks the previous day's high and low levels.
Dynamic Updates: Automatically updates at the start of a new trading day.
Visual Clarity: Includes labels at the start of the day for quick reference.
Customizable: Works seamlessly across all timeframes and instruments.
Use Case:
Identify potential breakout and reversal zones.
Enhance intraday and swing trading strategies by focusing on key price levels.
Plan stop-loss and target levels based on historical price movements.
This indicator is perfect for price action traders, intraday scalpers, and swing traders who rely on past price behavior to make informed decisions.

First day candle high and low of monthThis script is designed to mark the high and low levels of the first candle of each month on the chart. These levels are often considered significant support and resistance zones, as they can represent key liquidity points in the market.
The idea behind this tool is based on the observation that the low of the first monthly candle can act as a critical support level, especially during a bullish market trend. If the price breaks below this low in a bull market, it may indicate a potential manipulation or stop-loss hunting rather than a genuine shift in trend. Similarly, the high of the first monthly candle may serve as a key resistance level, particularly in consolidating or range-bound markets.
By dynamically plotting these levels, the script provides traders with valuable insights into potential liquidity zones and significant market reactions. It allows for customizable line colors and lengths, making it adaptable to various trading styles and preferences.
This tool is particularly useful for traders who wish to align their strategies with institutional market behaviors, as it highlights areas where liquidity is likely to be targeted. Use it as part of your broader analysis to identify potential trade setups, manage risk effectively, and understand market dynamics more comprehensively.

Swing High/Low Pivots Strategy [LV]The Swing High/Low Pivots Strategy was developed as a counter-momentum trading tool.
The strategy is suitable for any market and the default values used in the input settings menu are set for Bitcoin (best on 15min). These values, expressed in minimum ticks (or pips if symbol is Forex) make this tool perfectly adaptable to every symbol and/or timeframe.
Check tooltips in the settings menu for more details about every user input.
STRTEGY ENTRY & EXIT MECHANISMS:
Trades Entry based on the detection of swing highs and lows for short and long entries respectively, validated by:
- Limit orders placed after each new pivot level confirmation
- Moving averages trend filter (if enabled)
- No active trade currently open
Trades Exit when the price reaches take-profit or stop-loss level as defined in the settings menu. A double entry/second take-profit level can be enabled for partial exits, with dynamic stop-loss adjustment for the remaining position.
Enhanced Trade Precision:
By limiting entries to confirmed swing high (HH, LH) or swing low (HL, LL) pivot points, the strategy ensures that trades occur at levels of significant price reversals. This precision reduces the likelihood of entering trades in the midst of a trend or during uncertain price action.
Risk Management Optimization:
The strategy incorporates clearly defined stop-loss (SL) and take-profit (TP) levels derived from the pivot points. This structured approach minimizes potential losses while locking in profits, which is critical for consistent performance in volatile markets.
Trend Filtering for Better Entry:
The use of a configurable moving average filter adds a layer of trend validation. This prevents entering trades against the dominant market trend, increasing the probability of success for each trade.
Avoidance of Noise:
The lookback period (length parameter) confirms pivots only after a set number of bars, effectively filtering out market noise and ensuring that entries are based on reliable, well-defined price movements.
Adaptability Across Markets:
The strategy is versatile and can be applied across different markets (Forex, stocks, crypto) due to its dynamic use of ticks and pips converters. It adapts seamlessly to varying price scales and asset types.
Dual Quantity Entries:
The original and optionnal double-entry mechanism allows traders to capture both short-term and extended profits by scaling out of positions. This adaptive approach caters to varying risk appetites and market conditions.
Clear Visualization:
The plotted pivot points, entry limits, SL, and TP levels provide visual clarity, making it easy for traders to track the strategy's behavior and make informed decisions.
Automated Execution with Alerts:
Integrated alerts for both entries and exits ensure timely actions without the need for constant market monitoring, enhancing efficiency. Configurable alert messages are suitable for API use.
Any feedback, comments, or suggestions for improvement are always welcome.
Hope you enjoy!

Multi-Timeframe Highs and LowsThe "Multi-Timeframe Highs and Lows" indicator is a comprehensive tool designed to plot recent Highs and Lows across multiple timeframes, including 15-Minute, 30-Minute, 1-Hour, 4-Hour, 8-Hour, Daily, Weekly, and Monthly. This indicator provides traders with a clear view of critical support and resistance levels, enabling precise decision-making for entries, exits, and stop-loss placements. It features customizable lookbacks, dynamic line extensions, and advanced label placement logic to prevent overlap, ensuring a clean and clutter-free chart. With fully customizable colors and styles for each timeframe, traders can tailor the indicator to their preferences. Whether you’re a scalper, swing trader, or position trader, this tool adapts to your strategy, providing actionable insights for breakout, reversal, and trend-following setups. Optimized for performance, it handles multiple lines and labels efficiently, making it suitable for high-activity charts. The "Multi-Timeframe Highs and Lows" indicator is an indispensable tool for traders seeking to identify and utilize key price levels across all timeframes with precision and clarity.
Average High-Low Multi Time Frame Lines SunilTitle: Multi-Timeframe Average High-Low Levels with Custom Timeframes
Description:
This indicator calculates the average of high and low prices across up to four customizable timeframes. By default, it includes 30 minutes, 1 hour, 3 hours, and 1 day, but you can modify these directly in the input settings to suit your trading strategy.
Features:
Plots average high-low levels for selected timeframes with distinct colors.
Highlights buy zones (green) when the price is above all levels and sell zones (red) when the price is below all levels.
Marks areas where all levels align with a subtle blue background.
Use this tool to identify key levels and potential trading opportunities across multiple timeframes at a glance!

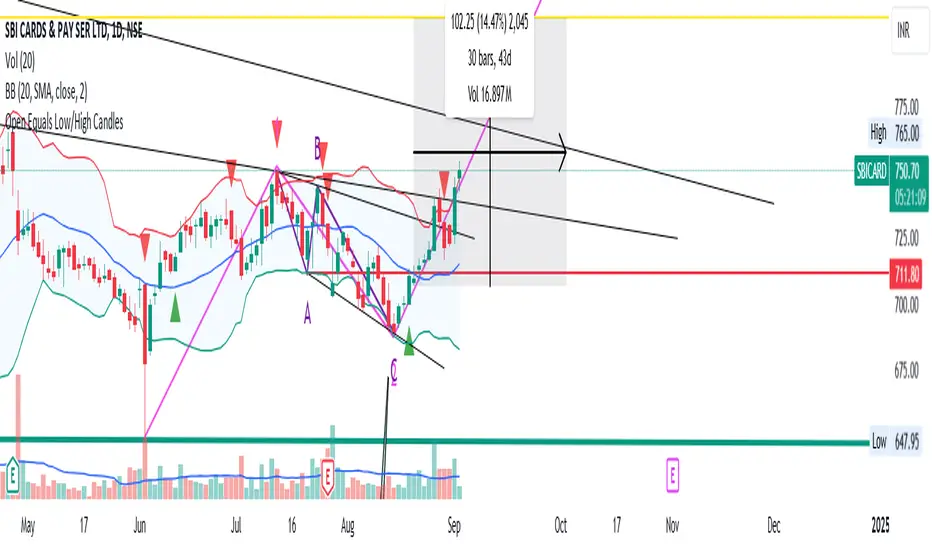
Open Equals Low/High Candles
This Indicator basically helps us to get the candles where Open = Low & Open =High.
Significance:
1) Open = Low Candles
----> Such candles are very powerful, as the Open = Low marks that there aren't any sellers left below the price on that day. Denoting BULLS power and aggression.
2) Open = High Candles
----> Open = High Candles signify that as soon as the markets opened, Bears were very strong, and no buyers left above the opening price for that candle. Denoting Strong BEARISH sentiment and aggression.
PS: This indicator can be used across all timeframes and indices. As it is purely based on Price-Action study.
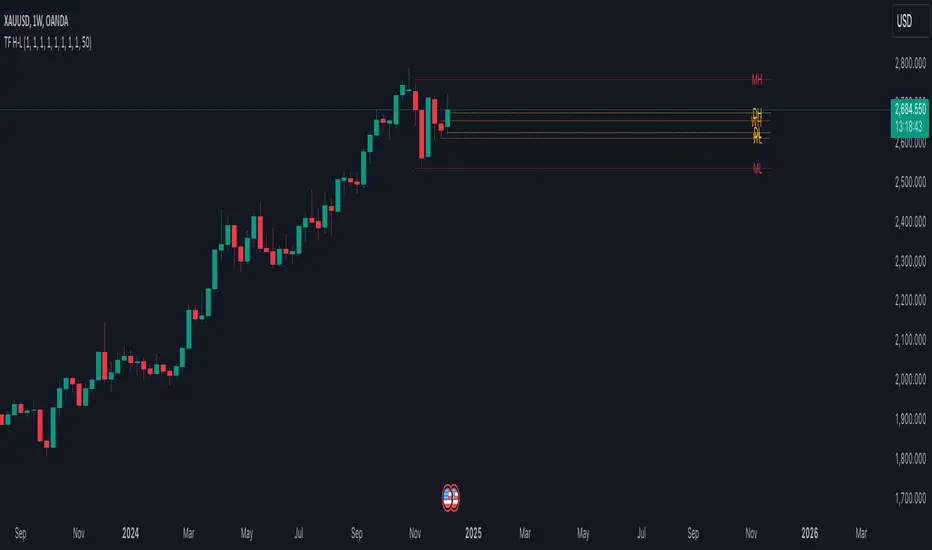
Higher Timeframe Open High Low ClosePURPOSE
1. Multi-timeframe analysis (MTFA).
2. Better visualize intraday price action relative higher timeframe price action, and this is not limited to the current time frame or the higher time frame including current price movement.
3. Higher Timeframes provides an overview of the long-term trend (e.g., weekly or monthly charts).
4. Confirm trends occurring on more than one timeframe.
5. Improve choice of entry and exit points.
ORIGINALITY
1. Compare current lower time frame price movement to current or previous higher time frame movement. The user specifies in the settings the higher time frame (day, week, month, quarter, or year) and the associated price movement data, including OHLC, average prices, and moving average levels.
2. Previous time frames and all specified levels (OHLC, average prices, and moving averages) can be shifted together to overlay the current time frame. This allows analysis of lower/intraday price movement against that of any past higher time frames.
3. Use: In the settings, the current time frame (i.e., that including current price movement) 'count from current' is '0', a count of '1' would shift one higher level time frame such that the open date of that shifted time frame aligns with the open date of the current time frame. A count of '3' would shift three higher level time frames to align with the current."
4. Example: On the Wednesday July 24 intraday chart, overlay the daily OHLC, typical price, and 10-day EMA data occurring at the close of Wednesday July 17. This allows analyze current price movement against data from one week prior.
HIGHER TIMEFRAME DATA that can be PLOTTED and SHIFTED
1. Open, High, Low, Close.
2. Average prices: Median (HL/2), Typical (HLC/3), (Average OHLC/4), Body Median (OC/2), Weighted Close (HL2C/4), Biased 01 (HC/2 if Close > Open, else LC/2), Biased 02 (High if Close > HL/2, else Low), Biased 03 (High if Close > Open, else Low).
3. Moving averages with user specified source, length and type.

First 12 Candles High/Low BreakoutThis indicator identifies potential breakout opportunities based on the high and low points formed within the first 12 candles after the market opens on a 5-minute timeframe. It provides visual cues and labels to help traders make informed decisions.
Features:
Market Open High/Low: Marks the highest and lowest price of the first 12 candles following the market open with horizontal lines for reference.
Breakout Signals: Identifies potential buy or sell signals based on the first 5-minute candle closing above the open high or below the open low.
Target and Stop-Loss: Plots horizontal lines for target prices (100 points by default, adjustable) and stop-loss levels (100 points by default, adjustable) based on the entry price.
Visual Cues: Uses green triangles (up) for buy signals and red triangles (down) for sell signals.
Informative Labels: Displays labels with "Buy" or "Sell" text, target price, and stop-loss price next to the entry signals (optional).
Customization:
You can adjust the target and stop-loss point values using the provided inputs.
How to Use:
Add the script to your TradingView chart.
The indicator will automatically plot the open high, open low, potential entry signals, target levels, and stop-loss levels based on the first 12 candles after the market opens.
Use the signals and price levels in conjunction with your own trading strategy to make informed decisions.
