FibDT BreakoutThis indicator plots the Fib high and low based on a given lookback input. Once price breaks out towards one side of the pivot , it looks through multiple timeframes to watch if momentum is falling. If momentum falls through a certain threshold, it will close the order.
Take profit at your own discretion. The PnL from this is strictly based on closing when the momentum has hit a threshold. If you're actively watching and closing at conservative levels, it can potentially be much higher.
Tìm kiếm tập lệnh với "momentum"

Profit-sync with Trexen StratThere are various scripts and indicators on Tradingview, but not many of them combine theories to improve the profitability of an indicator using settings from multiple time frames.
This script takes the Average True Range trailing exit idea to enter trades. Many other ideas have been tested to filter entry signals which may be weak or not profitable such as a second ATR with Higher TF, MFI/VFI, RSI , Momentum wavetrend, Weis Wave, MACD , Stochastic etc, but I felt the following works best:
- Over the ATR entries there is a directional filter very similar to Renko candles which can be set to a higher time frame, I use 4 hour with 15 min candles for example, this will only allow 15 min buy signals to execute if the 4 hour is also on the buy side.
- There is also a Trend directional filter which can be set to a higher/lower time frame, currently I am using this on allow setting to allow more trades
The higher both filter are, the more accurate the trades will be, but less frequent. The filters convert entry signals into exit signal which can be used as take profit point with alerts if there is a position open.
The overall theory is to follow trend and to exit with profit. I have tested different take profit alerts but think it’s better to either catch a whole price move or sell with a set trailing limit order at like 0.4/0.5%.
As I am trading BTC with a bot and not with TA I think it is good to get in on a trend reversal, follow the trend up and get out quick with profit. There is a lot of manipulation with crypto so things like Momentum indicators and money-flow may not represent what is actually happening in the market.

Cyber Ensemble StrategyStrategy base on CYBER ENSEMBLE , with stop-loss algorithm integrated.
~ * ~ * ~ * ~ * ~ * ~ * ~ * ~ * ~ * ~ * ~ * ~ * ~ * ~ * ~ * ~ * ~ * ~ * ~ * ~ * ~
Note:
In no way is this intended as a financial/investment/trading advice. You are responsible for your own investment decisions and trades.
Please exercise your own judgement for your own trades base on your own risk-aversion level and goals as an investor or a trader. The use of OTHER indicators and analysis in conjunction (tailored to your own style of investing/trading) will help improve confidence of your analysis, for you to determine your own trade decisions.
~ * ~ * ~ * ~ * ~ * ~ * ~ * ~ * ~ * ~ * ~ * ~ * ~ * ~ * ~ * ~ * ~ * ~ * ~ * ~ * ~
Please check out my other indicators sets and series, e.g.
LIVIDITIUM (dynamic levels),
AEONDRIFT (multi-levels standard deviation bands),
FUSIONGAPS (MA based oscillators),
MAJESTIC (Momentum/Acceleration/Jerk Oscillators),
PRISM (pSAR based oscillator, with RSI/StochRSI as well as Momentum/Acceleration/Jerk indicators),
PDF (parabolic SAR /w HighLow Trends Indicator/Bar-color-marking + Dynamic Fib Retrace and Extension Level)
and more to come.
Constructive feedback and suggestions are welcome.
To continue to keep this strategy free to use, especially if it has benefited your trades, please consider tipping a little of any gains you've made to my HRT fund. =D
cybernetwork @ EOS
37DzRVwodp5UZBYjCKvVoZ5bDdDqhr7798 @ BTC
MPr8Zhmpsx2uh3F5R4WD98MRJJpwuLBhA3 @ LTC
1Je6c1vvSCW7V2vA6RYDt6CEvqGYgT44F4 @ BCH
AS259bXGthuj4VZ1QPzD39W3ut4fQV5giC @ NEO
rDonew8fRDkZFv7dZYe5w3L1vJSE51zFAx @ Ripple XRP
0xc0161d27201914FC0bAe5e350a193c8658fc4742 @ ETH
GAX6UDAJ52OGZW4FVVG3WLGIOJLGG2C7CTO5ZDUK2P6M6QMYBJMSJTDL @ Stellar XLM
xrb_16s8cj8eoangfa96shsnkir3wctdzy76ajui4zexek6xmqssweu85rdjxrt4 @ Nano
~ JuniAiko
(=^~^=)v~
CYBER ENSEMBLE

QuantCat Mom Finder Strategy (1H)QuantCat Momentum Finder Strategy
This strategy is designed to be used on the 1 hour time frame, on all x/btc pairs.
The beautiful thing is it plots the take profit, and stoploss for you for each entry- where I would say use the stoploss for sure and feel with water with how the price action is looking when in profit.
In this strategy, I actually implemented my own trading style into building the strategy. Having to replicate my own trading strategy into an algorithm, I can't make it exactly perfect to how I would trade, but what I can do is try and program the parameters that give it the absolute best chance of making a big move with a small drawdown- which replicates part of my momentum trading style. Here I am using RSI, MACD, EMA and trend filtering values to find moments where there has been a momentum change to play the rest of the move. It only picks the best entries.
There is always a 3-4 R/R move on average with with these trades, meaning 1 in 4 only need to hit to be a break even trader- where most of these strategies have about 35% hit rate.
The stoploss is so crucial to minimise any damage from huge unexpected candles, the strategies can just be used for entries as well, you don't have to stick to the exact formula- of the long and short system, but this by itself is profitable.
The system nets positive results on
-ETH/BTC
-LTC/BTC
-XRP/BTC
-ADA/BTC
-NEO/BTC etc.
We also have a free 15M strategy available too.
You can join our discord server to get live alerts for the strategy as well as speak to our devs! Link in signature below!!!

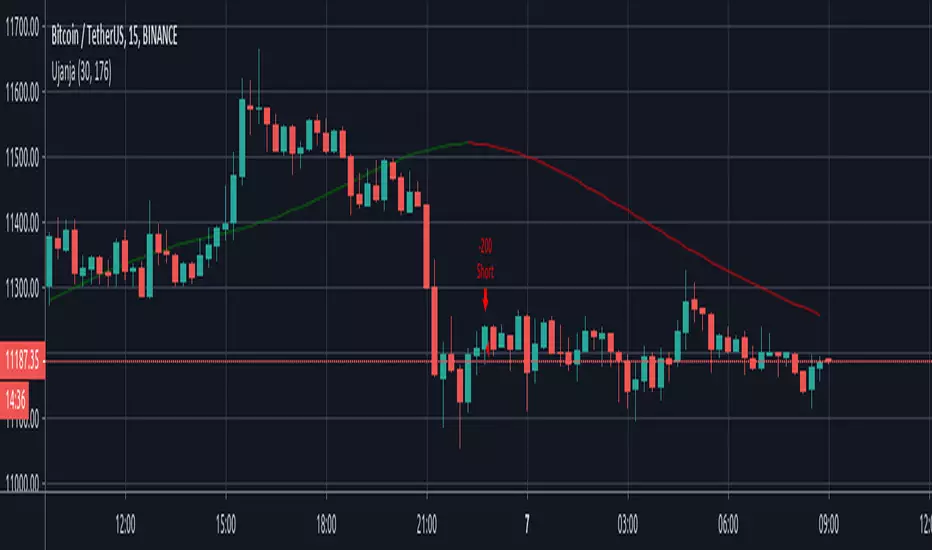
UjanjaUjanja uses Zero Lag EMA combined with Hull Moving Average for smoothing purposes. It is a less aggressive. It is only to be used with huge volume , huge momentum and high volatility to get trend analysis... It doesn't repaint at all.
Advised use :
Trades highly volatile Crypto currencies, stocks as well as Gold .
It is only to be used with huge momentum and high volatility to get trend analysis... It doesn't repaint at all.
RSI-RENKO Divine Strategy (Backtesting)Live, non-repainting strategy using RENKO and RSI mixed together to multiple types of long and short positions.
- Features -
Live entry direction with trade warnings and alerts
Live trade building buy and sell limits (for buy/sell limits)
Entry location icons as well as pyramid entries (to add to existing position)
Swing trades that keep you in the trade for the maximum possible profit
1 scalp target based on the RSI settings and entry location
Dynamic trailing stop for swings and scalps
Alert conditions for every update and condition change of the strategy (Provided by indicator study)
4 pre-built color themes, including candlestick coloring
This strategy is best used with the companion indicators: Renko RSI and Renko Trend Momentum using the identical RSI and Trend settings.
The linked script is identical and used solely for alerts, because Trading View still after 3 years of requesting does not provide the ability to use alert conditions inside a strategy script, only an indicator script. This strategy should be used to backtest your settings.
The approach to this strategy uses several parallel trades of different types. In order to generate multiple trade types the "pyramid trades" setting of the strategy (second tab of the settings that lets you adjust the number of pyramid contracts) should be used.
- Trade Types -
Swing: This trade is entered on the solid arrows after the RSI has become oversold or overbought. It is key that all trades wait for some degree of pullback before entering, even after the trend flips between positive and negative. This trade is held until stopped out or an opposite trade is triggered that reverses the position.
Scalp: These trades have a limit buy/sell entry and a target. The initial target is the opposing RSI overbought or oversold level and changes in real time.
Turning on/off the different trade types (strategy only) is simple done by decreasing the number of contracts used for that trade type to zero. When the quantity is set to zero, that trade is not considered.
- Session -
The session filter is used to narrow trade executions by only allowing trades that are inside the session boundaries. This can be used to isolate the London or New York session for example. The default is 24 x 7 which filters no trades (Trading View has a bug when resetting this, so simply reset the indicator to get it back to 24x7).
Please see the following 3 videos introducing the concept of this strategy.
All feature requests or bug reports are welcome either by direct messaging or comments on this page or the linked indicator page.
Please PM for access. Cheers.

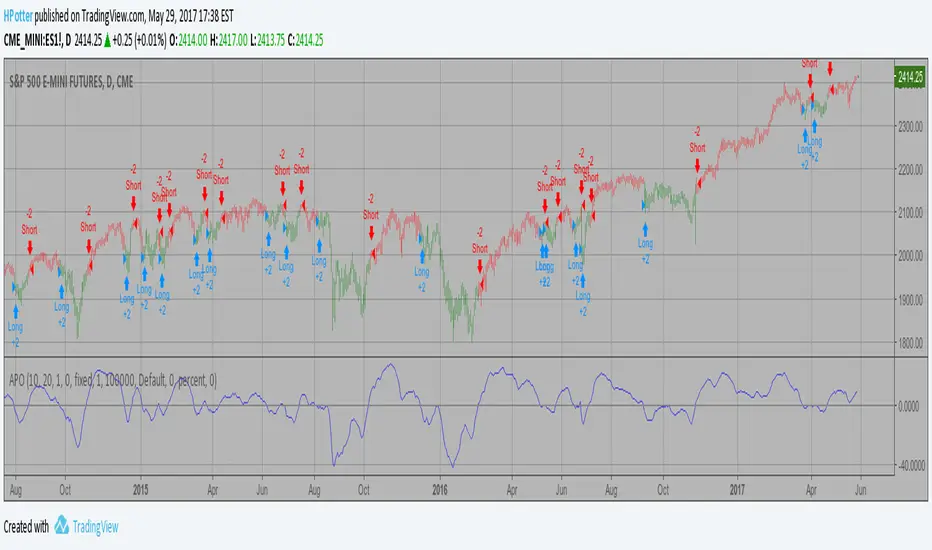
Combo Backtest 123 Reversal and Absolute Price Oscillator (APO) This is combo strategies for get
a cumulative signal. Result signal will return 1 if two strategies
is long, -1 if all strategies is short and 0 if signals of strategies is not equal.
First strategy
This System was created from the Book "How I Tripled My Money In The
Futures Market" by Ulf Jensen, Page 183. This is reverse type of strategies.
The strategy buys at market, if close price is higher than the previous close
during 2 days and the meaning of 9-days Stochastic Slow Oscillator is lower than 50.
The strategy sells at market, if close price is lower than the previous close price
during 2 days and the meaning of 9-days Stochastic Fast Oscillator is higher than 50.
Secon strategy
The Absolute Price Oscillator displays the difference between two exponential
moving averages of a security's price and is expressed as an absolute value.
How this indicator works
APO crossing above zero is considered bullish, while crossing below zero is bearish.
A positive indicator value indicates an upward movement, while negative readings
signal a downward trend.
Divergences form when a new high or low in price is not confirmed by the Absolute Price
Oscillator (APO). A bullish divergence forms when price make a lower low, but the APO
forms a higher low. This indicates less downward momentum that could foreshadow a bullish
reversal. A bearish divergence forms when price makes a higher high, but the APO forms a
lower high. This shows less upward momentum that could foreshadow a bearish reversal.
WARNING:
- For purpose educate only
- This script to change bars colors.

Bone Scalp StrategyThis is how I scalp trades. Very simple to use
There are 0-4 Numbered rows of squares, each row has the following definition
4 - Rigor Row - Describes how much rigor is the movement
3 - Momentum Row - Describes how much momentum there is in the movement
2 - Energy Row - Describes how much Gas is in the movement
1 - Vector Row - Describes which direction it is going
0 - Go/No Go Row - Turns Green when all are Green
Turns Red when Rigor is red with the combination of any of the other are red (ie Rigor Red and (Momentum Red and Vector Red)

Bill Williams Awesome strategy(lirshah)The Awesome Oscillator is an indicator used to measure market momentum. AO calculates the difference of a slow period and a fast period Simple Moving Averages. The Simple Moving Averages that are used are not calculated using closing price but rather each bar's midpoints.
AO is generally used to affirm trends or to anticipate possible reversals.
this strategy has been written according to BWA and has the best results on M15 chart.
the strategy is compatible with Most markets such as Forex, crypto, CFD and indexes

Absolute Price Oscillator (APO) Backtest 2.0 The Absolute Price Oscillator displays the difference between two exponential
moving averages of a security's price and is expressed as an absolute value.
How this indicator works
APO crossing above zero is considered bullish, while crossing below zero is bearish.
A positive indicator value indicates an upward movement, while negative readings
signal a downward trend.
Divergences form when a new high or low in price is not confirmed by the Absolute Price
Oscillator (APO). A bullish divergence forms when price make a lower low, but the APO
forms a higher low. This indicates less downward momentum that could foreshadow a bullish
reversal. A bearish divergence forms when price makes a higher high, but the APO forms a
lower high. This shows less upward momentum that could foreshadow a bearish reversal.
You can change long to short in the Input Settings
WARNING:
- For purpose educate only
- This script to change bars colors.

Inverse Fisher - BK
This chart has S/R levels, derived from an oscillator, overlaid on price action for easy identification of clusters and turning points. It also marks bars (up / down triangles above/below) with reducing momentum to show potential upcoming bounce levels. This S/R level is derived from %B, while you can do the same from other metrics like volume , momentum etc.
Best time setting 30min
I want these results to be correct. Because it's incredible

Ergodic CSI Backtest This is one of the techniques described by William Blau in his book
"Momentum, Direction and Divergence" (1995). If you like to learn more,
we advise you to read this book. His book focuses on three key aspects
of trading: momentum, direction and divergence. Blau, who was an electrical
engineer before becoming a trader, thoroughly examines the relationship between
price and momentum in step-by-step examples. From this grounding, he then looks
at the deficiencies in other oscillators and introduces some innovative techniques,
including a fresh twist on Stochastics. On directional issues, he analyzes the
intricacies of ADX and offers a unique approach to help define trending and
non-trending periods.
This indicator plots Ergotic CSI and smoothed Ergotic CSI to filter out noise.
You can change long to short in the Input Settings
WARNING:
- For purpose educate only
- This script to change bars colors.

theMegalodon_Strategy_TestThis is the strategy tester for theMegalodon!
--------------------------------------
THEMEGALODON
theMegalodon looks for the institutional finger prints, the whales or the big boys.
theMegalodon is really simple to use.
theMegalodon combines the 8 different unique indicators, that each have almost perfect success rate.
theMegalodon works with any kind of market state, any kind of trading, and any kind of asset.
theMegalodon has more features than any other indicator in the market: Out of 9 working indicators, we have 3 momentum, 3 price and 3 volume indicators showing you the best signals.
--------------------------------------
theMegalodon is designed for us, the small fishes in the ocean, the millennials, the college students. This will basically makes us the new Megalodons(whale hunters).
All you have to do is:
1- Look for green or red arrows.
2- Look for orange or red candles.
3- Repeat
--------------------------------------
TECHNICAL DETAILS
Some boring info that you don't necessarily need to know.
1- Draws fibonacci retracement (s)' levels depending on your preferred look back period (Default: 365 and 120)
i) Can draw 2 fibs on the same chart. Can reverse the fib levels. Even, add an additional fib level to look for.
ii) Automatic fill function for a Reload Zone inside of a Reload Zone. *61.8% levels to 100% levels or 0% levels
2- Changes the color of the candle when strong buy(orange) or strong sell(red). Draws arrows on the chart for long and short positions.
i) Analyses and Combines
a) Price
b) Momentum
c) Volume
3- Prints out the indicators that are either giving Short or Long signs on the right corner.
4- The closer the unclebo indicator(click enable UncleBo) gets to the All time high, the better buy it is.
i) Same with the other way around. The closer it gets to the 0, the better sell it is.
5- Draws Bollinger Bands on the chart and shows where to buy or sell
6-The indicator is designed to be used in Daily time frame for the best calls to short or long.
--------------------------------------------------
iPyra◬
Enlighten others

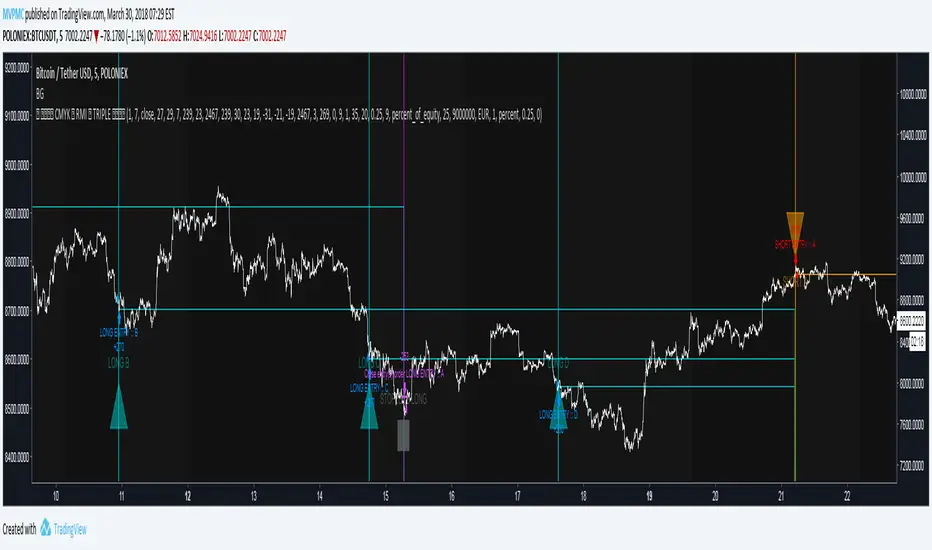
CMYK RMI TRIPLE Automated strategy▼ This is the strategy version of the script.
◊ Introduction
This script makes use of three RMI 's, that indicate Overbought/Oversold on different timescales that correspond with Frequency’s that move the market.
◊ Origin
The Relative Momentum Index was developed by Roger Altman and was introduced in his article in the February, 1993 issue of Technical Analysis of Stocks & Commodities magazine.
While RSI counts up and down ticks from close to close, the Relative Momentum Index counts up and down ticks from the close relative to a close x number of days ago.
This results in an RSI that is smoother, and has another setting for fine tuning results.
This bot originated out of Project XIAM , an investigative script that outlined my approach towards Automated Trading Strategies.
Are you interested in writing bots yourself ? check out the beta version of this script.
It has many bugs, but also most of the Skeleton.
◊ Usage
This script is intended for Automated Trading with AUTOVIEW or TVAUTOTRADER , on the 1 minute chart.
◊ Features Summary
Overlay Mode
Indicator Mode
Three RMI's
Trend adjustment
Pyramiding
Ignore first entries
Take Profit
Stop Loss
Interval between Entries
Multiring Fix
Alert signal Seperation
◊ Community
Wanna try this script out ? need help resolving a problem ?
CMYK :: discord.gg
AUTOVIEW :: discordapp.com
TRADINGVIEW UNOFFICIAL :: discord.gg
◊ Setting up Autoview Alerts
Use the study version of this script, To set up The Alerts Autoview Picks up on.
The Signals to work with are :
Open 1 Long
Use this to open one Long Position.
With quantity being : /
Once per bar
Being larger than 0
Comment example : e=exchange b=long q=amount t=market
Open 1 Short
Use this to open one Short Position.
With quantity being : /
Once per bar
Being larger than 0
Comment example : e=exchange b=short q=amount t=market
Close1 Position
Use this to Close The amount of one Open Position.
With quantity* being : /
Once per bar
Being larger than 0
Comment example : e=exchange c=position q=amount t=market
*Beware when using a percental % quantity, instead of an absolute quantity.
Percental Quantities are based on the , Not
And will change in absolute value relative to the amount of open trades.
Close All positions
Use this to Close All Open Positions.
With quantity being :
Once per bar
Being larger than 0
Comment example : e=exchange c=position t=market
For the specific Syntax used in the comment of the alert, visit Autoview .
◊ Setting up TVAutotrader
Use the strategy version of this script, And load it into TVAT .
◊ Backtesting
Use the strategy version of this script for backtesting.
◊ Contact
Wanna try this script out ? need help resolving a problem ?
CMYK :: discord.gg
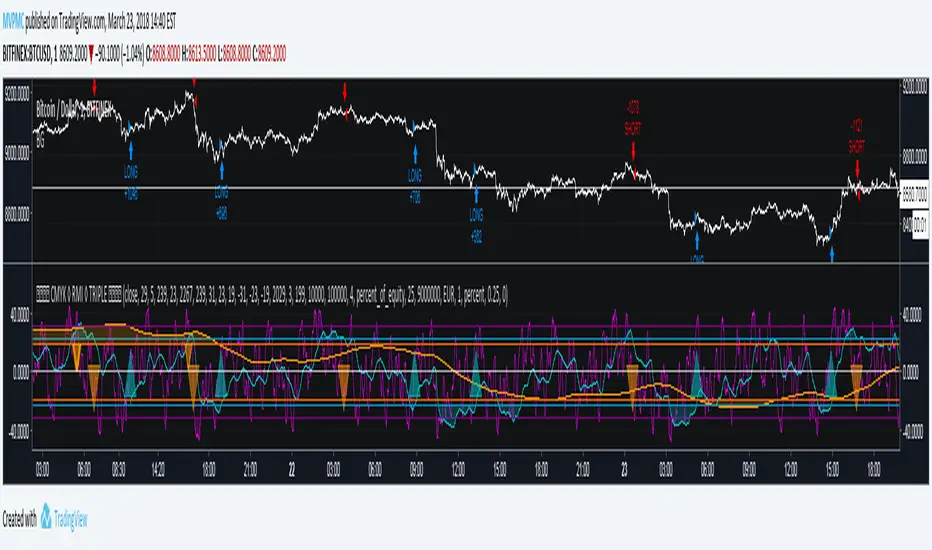
CMYK RMI TRIPLE◊ Introduction
This script makes use of three RMI's, to indicate Overbought/Oversold.
Adjustments can easily be made, through its settings or script.
◊ Origin
The Relative Momentum Index was developed by Roger Altman and was introduced in his article in the February, 1993 issue of Technical Analysis of Stocks & Commodities magazine.
While RSI counts up and down days from close to close, the Relative Momentum Index counts up and down days from the close relative to a close x number of days ago.
This results in an RSI that is smoother.
This is a part of Project XIAM.
◊ Theoretical Approach
Philosophy γ :: consequential
◊ Usage
You can use this as an indicator for manual trading, or apply AUTOTVIEW to automate your trading.
My advice is to combine this with another indicator before you do this.
The script is written in an organized and flexible manner to do this.
◊ Features
3 RMI's with seperately adjustable HIGH / LOW levels.
Trend adjustment on the SLOW RMI.
Adjustable Interval between entries / Once per dip-top entry.
Take Profit & Stop loss
◊ Community
Wanna share your findings ? or need help resolving a problem ?
CMYK :: discord.gg
AUTOVIEW :: discordapp.com
TRADINGVIEW UNOFFICIAL :: discord.gg
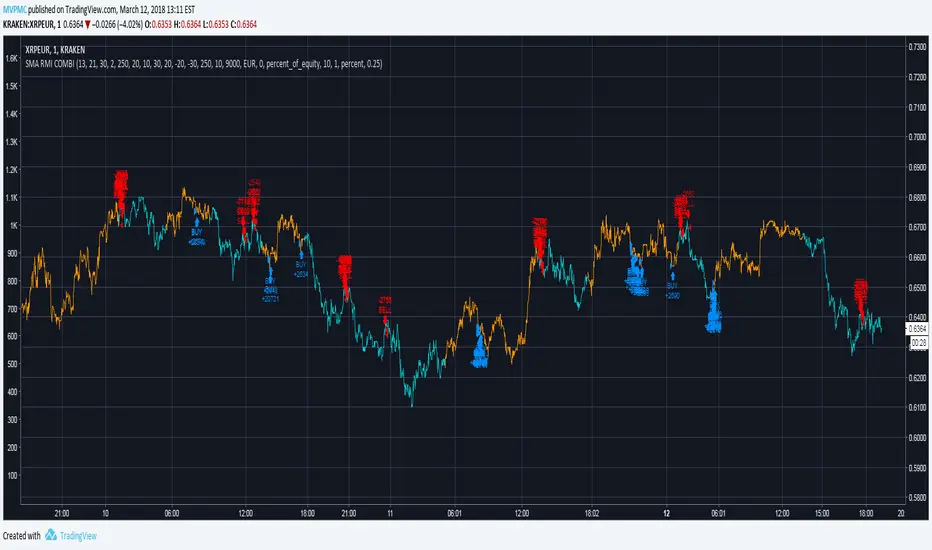
CMYK XIAM◊ Introduction
This is project XIAM, a trading bot based on SMA and RMI
◊ Origin
Based on 'The Relative Momentum Index' by Roger Altman : February, 1993 issue of Technical Analysis of Stocks & Commodities magazine.
While RSI counts up and down days from close to close, the Relative Momentum Index counts up and down days from the close relative to a close x number of days ago.
This results in an RSI that is smoother. The input has been changed to the change of a smoothed close multiplied by a smoothed volume .
In addition SMA is used to detect an up/downwards phase.
◊ Adjustments
CMYK color theme applied.
◊ Usage
Automatic trading strategy
◊ Future Prospects
Remove jitter.
Take Variance into account
Auto adjusting settings evaluated on previous placements.
Proper asset management.
Slickwater Strategy [frac]This indicator is the culmination of various other indicators and attempts to help traders assess the actual current trend and filter out all the noise.
In reality, this indicator is extremely similar to the Traders Dynamic Index in concept and the overall results of the indicator across any time frame. The differences though are that while TDI uses just RSI, this uses RSI, CCI, MFI, and TSI, and also includes an assessment of the momentum associated with the move, to better enable traders to detect divergence.
The default settings generate the best returns across any time frame, however can be ultra sensitive and generate too many trade signals on high resolution time frames (i.e., the 15M or 30M). If one desires less sensitive results, one can use (14,12,9) for the first 3 inputs. This generates consistent signals, but is not as sensitive as the default.
In general:
GO LONG:
- Scalp: Wt1 crosses over Wt2
- Short Term: Wt1 crosses over Wt2 and the middle band. Wt2 is above the middle band as well
- Medium Term: Same as short term, but there are extended oversold trading signals (yellow dots)
- Long term: Same as medium term, but there is divergence in the momentum as well (i.e. it is increasing while price decreases)
GO SHORT:
- Scalp: Wt1 crosses under Wt2
- Short Term: Wt1 crosses under Wt2 and the middle band. Wt2 is below the middle band as well.
- Medium Term: Same as short term, but there are extended overbought trading signals (yellow dots)
- Long term: Same as medium term, but there is divergence in the momentum as well (i.e., it is decreasing while price increases)

True Strength Indicator BTCUSD 2HScript based on True Strength Index (TSI) and RSI
A technical momentum indicator that helps traders determine overbought and oversold conditions of a security by incorporating the short-term purchasing momentum of the market with the lagging benefits of moving averages. Generally a 25-day exponential moving average (EMA) is applied to the difference between two share prices, and then a 13-day EMA is applied to the result, making the indicator more sensitive to prevailing market conditions.
!!! IMPORTANT IN ORDER TO AVOID REPAITING ISSUES
!!! USE Chart resolution >= resCustom parameter, suggestion 2H
Yellow zones indicates that you can claim position for better profits even before a claim confirmation.
Dark zones indicates areas where RSI shows overbought and oversold conditions.
BTCUSD

Absolute Price Oscillator (APO) Backtest The Absolute Price Oscillator displays the difference between two exponential
moving averages of a security's price and is expressed as an absolute value.
How this indicator works
APO crossing above zero is considered bullish, while crossing below zero is bearish.
A positive indicator value indicates an upward movement, while negative readings
signal a downward trend.
Divergences form when a new high or low in price is not confirmed by the Absolute Price
Oscillator (APO). A bullish divergence forms when price make a lower low, but the APO
forms a higher low. This indicates less downward momentum that could foreshadow a bullish
reversal. A bearish divergence forms when price makes a higher high, but the APO forms a
lower high. This shows less upward momentum that could foreshadow a bearish reversal.
You can change long to short in the Input Settings
Please, use it only for learning or paper trading. Do not for real trading.
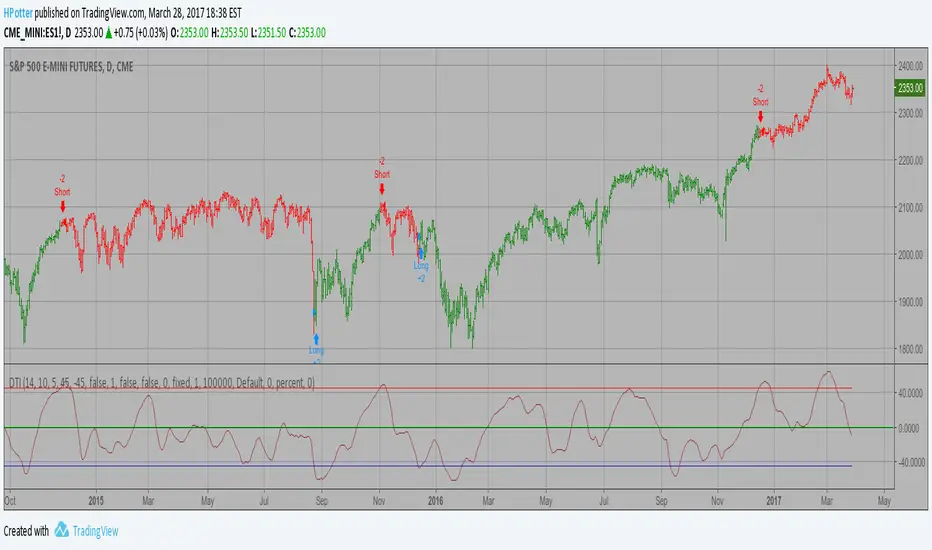
Directional Trend Index (DTI) This technique was described by William Blau in his book "Momentum,
Direction and Divergence" (1995). His book focuses on three key aspects
of trading: momentum, direction and divergence. Blau, who was an electrical
engineer before becoming a trader, thoroughly examines the relationship between
price and momentum in step-by-step examples. From this grounding, he then looks
at the deficiencies in other oscillators and introduces some innovative techniques,
including a fresh twist on Stochastics. On directional issues, he analyzes the
intricacies of ADX and offers a unique approach to help define trending and
non-trending periods.
Directional Trend Index is an indicator similar to DM+ developed by Welles Wilder.
The DM+ (a part of Directional Movement System which includes both DM+ and
DM- indicators) indicator helps determine if a security is "trending." William
Blau added to it a zeroline, relative to which the indicator is deemed positive or
negative. A stable uptrend is a period when the DTI value is positive and rising, a
downtrend when it is negative and falling.
You can change long to short in the Input Settings
Please, use it only for learning or paper trading. Do not for real trading
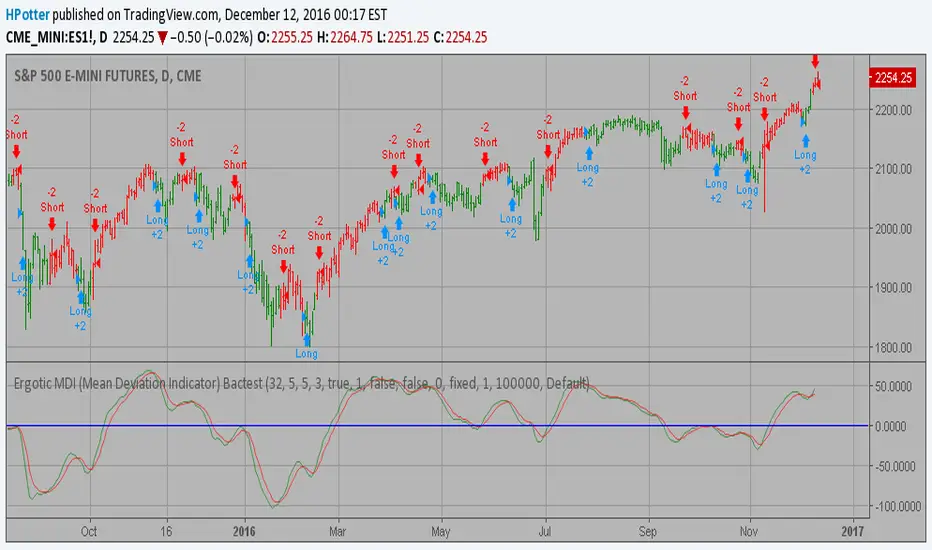
Ergotic MDI (Mean Deviation Indicator) Bactest This is one of the techniques described by William Blau in his book "Momentum,
Direction and Divergence" (1995). If you like to learn more, we advise you to
read this book. His book focuses on three key aspects of trading: momentum,
direction and divergence. Blau, who was an electrical engineer before becoming
a trader, thoroughly examines the relationship between price and momentum in
step-by-step examples. From this grounding, he then looks at the deficiencies
in other oscillators and introduces some innovative techniques, including a
fresh twist on Stochastics. On directional issues, he analyzes the intricacies
of ADX and offers a unique approach to help define trending and non-trending periods.
You can change long to short in the Input Settings
Please, use it only for learning or paper trading. Do not for real trading.
Ergotic MACD Strategy Backtest This is one of the techniques described by William Blau in his book
"Momentum, Direction and Divergence" (1995). If you like to learn more,
we advise you to read this book. His book focuses on three key aspects
of trading: momentum, direction and divergence. Blau, who was an electrical
engineer before becoming a trader, thoroughly examines the relationship
between price and momentum in step-by-step examples. From this grounding,
he then looks at the deficiencies in other oscillators and introduces some
innovative techniques, including a fresh twist on Stochastics. On directional
issues, he analyzes the intricacies of ADX and offers a unique approach to help
define trending and non-trending periods.
Blau`s indicator is like usual MACD, but it plots opposite of meaningof
stndard MACD indicator.
You can change long to short in the Input Settings
Please, use it only for learning or paper trading. Do not for real trading.

ECO Strategy Backtest We call this one the ECO for short, but it will be listed on the indicator list
at W. Blau’s Ergodic Candlestick Oscillator. The ECO is a momentum indicator.
It is based on candlestick bars, and takes into account the size and direction
of the candlestick "body". We have found it to be a very good momentum indicator,
and especially smooth, because it is unaffected by gaps in price, unlike many other
momentum indicators.
We like to use this indicator as an additional trend confirmation tool, or as an
alternate trend definition tool, in place of a weekly indicator. The simplest way
of using the indicator is simply to define the trend based on which side of the "0"
line the indicator is located on. If the indicator is above "0", then the trend is up.
If the indicator is below "0" then the trend is down. You can add an additional
qualifier by noting the "slope" of the indicator, and the crossing points of the slow
and fast lines. Some like to use the slope alone to define trend direction. If the
lines are sloping upward, the trend is up. Alternately, if the lines are sloping
downward, the trend is down. In this view, the point where the lines "cross" is the
point where the trend changes.
When the ECO is below the "0" line, the trend is down, and we are qualified only to
sell on new short signals from the Hi-Lo Activator. In other words, when the ECO is
above 0, we are not allowed to take short signals, and when the ECO is below 0, we
are not allowed to take long signals.
You can change long to short in the Input Settings
Please, use it only for learning or paper trading. Do not for real trading.
