Simple HEMAs Color(MTF)Simple HEMAs, MTF for both fast and slow HEMA and color selection for multimple use.
Tìm kiếm tập lệnh với "mtf"

Ultimate Ichimoku Trend Board MTF – 6× Cloud Analyzer⚡️ Ultimate Ichimoku Trend Board MTF – 6× Cloud Analyzer
Unleash the full power of Ichimoku with this multi-timeframe trend dashboard ⚙️
Quickly identify whether each timeframe is Bullish 🟢, Bearish 🔴, or Inside the Cloud 🟠, and align your trades with the dominant trend like a pro.
🔥 Features:
✅ 6 customizable timeframes (M5 → H4)
✅ Clean & minimal dashboard — no chart clutter
✅ Instantly visualize market direction across all layers
✅ Perfect for scalpers, intraday, and swing traders
💡 See the Clouds. Read the Trends. Dominate the Market. 🌥💪

FVGC — MTF ScreenerFVGC — MTF Screener (by Capital Complex)
Part of the FVGC Suite.
A compact, real-time dashboard that scans the 30s, 1m, 2m, and 3m timeframes for FVGC-compliant conditions—showing a green/red dot when a bullish/bearish setup is arming, and a green/red square when the setup confirms. Built to sit beside FVGC — Signals and FVGC — Visual Overlay so you can monitor multiple timeframes at once without clutter.
---
## What it does
Multi-TF heads-up display : Tracks 30s, 1m, 2m, 3m for valid FVGC criteria.
Clear state encoding:
* Dot = conditions are aligning (setup arming).
* Square = entry model confirmed (go/no-go).
Rule-true logic: Mirrors your FVGC rule set (tap/engulf/inversion and guardrails) so the screener matches what your Signals indicator would accept on each timeframe.
Noise control: Honors your Trading Windows to keep the screen focused on the session you actually trade.
---
## Why traders use it
Time compression: See four lower timeframes progress from “almost” to “confirmed” at a glance.
Discipline aid: Use the dot phase as a heads-up, and the square as the only moment you consider action—no more chart hopping.
Suite cohesion: Screener tells you when, Visual Overlay shows where, Signals defines how.
---
## Key features & options
Timeframes: 30s, 1m, 2m, 3m (fixed for clarity and speed).
FVGC-aligned filters: Honors your suite’s guardrails (e.g., IFVG/BOS logic, midpoint FTC checks, opposing-FVG 50% behavior, opening-range distance caps by TF).
Trading Windows aware: Optional pre-window arming visibility for early heads-up.
Readable UI: On-chart table/HUD with per-state colors (dot/square), custom text color control, and minimal footprint.
Timezone aware: Defaults to America/New_York to align with RTH and your other FVGC tools.
---
## Notes
Designed for index futures, indices, and liquid FX.
This is a visual scanner; it does not place orders. Pair with FVGC — Signals for your actual entry/management logic.
---
## Credits & suite
Capital Complex — FVGC Suite
© TheHiddenMarkets (code components)
---
## Disclaimer
This tool is for educational purposes only and does not constitute financial advice. Trading involves risk; do your own research and manage risk appropriately.

Directional Volume Cloud MTFThe Directional Volume Cloud MTF transforms raw volume into a visually intuitive cloud histogram that highlights directional bias and exhaustion zones.
🔍 Core Logic
- Volume bias is calculated using candle direction (bullish/bearish) and smoothed via EMA.
- Bias strength is normalized against average volume to produce a ratio from -1 to +1.
- Color and opacity dynamically reflect bias direction and strength — pale clouds indicate weak volume, while vivid clouds signal strong conviction.
Features
- Customizable bullish/bearish colors
- Dynamic opacity based on volume strength
- Declining volume signals for potential reversals
- Multi-timeframe bias overlay (e.g., daily bias on intraday chart)
📈 Use Cases
- Spot volume exhaustion before reversals
- Confirm breakout strength with bias intensity
- Compare short-term vs long-term volume pressure
Whether you're scalping intraday moves or validating swing setups, this cloud-based volume heatmap offers a clean, modular way to visualize market conviction.

Weis Wave Volume MTF 🎯 Indicator Name
Weis Wave Volume (Multi‑Timeframe) — adapted from the original “Weis Wave Volume by LazyBear.”
This version adds multi‑timeframe (MTF) readings, configurable colors, font size, and screen position for clear dashboard‑style display.
🧠 Concept Background — What is Weis Wave Volume (WWV)?
The Weis Wave Volume indicator originates from Wyckoff and David Weis’ techniques.
Its purpose is to link price movement “waves” with the amount of traded volume to reveal how strong or weak each wave is.
Instead of showing bars one by one, WWV accumulates the total volume while price keeps moving in the same direction.
When price direction changes (up → down or down → up), it:
Finishes the previous wave volume total.
Starts a new wave and begins accumulating again.
Those wave volumes help traders see:
Effort vs Result: Big volume with small price move ⇒ absorption; low volume with big move ⇒ weak participation.
Trend confirmation or exhaustion: High volume waves in trend direction strengthen it, while low‑volume waves hint exhaustion.
⚙️ How this Script Works
Trend & Wave Detection
Compares close with the previous bar to determine up or down movement (mov).
Detects trend reversals (when mov direction changes).
Builds “waves,” each representing a continuous run of bars in one direction.
Volume Accumulation
While price keeps the same direction, the script adds each bar’s volume to the running total (vol).
When direction flips, it resets that total and starts a new wave.
Multi‑Timeframe Computation
Calculates these wave volumes on three timeframes at once, chosen dynamically:
Active Chart Timeframe Displays WWV for:
1 min 1 min
5 min 5 min
15 min 15 min
Any other Chart TF
It uses request.security() to pull each timeframe’s latest WWV value and current wave direction.
Visual Output
Instead of plotting histogram bars, it shows a table with three numeric values:
WWV (1): 25.3 M | (15): 312 M | (240): 2.46 B
Each value is color‑coded:
user‑selected Uptrend Color when price wave = up
user‑selected Downtrend Color when wave = down
You can position this small table in any corner/center (top / bottom × left / center / right).
Font size is user‑adjustable (Tiny → Huge).
📈 How Traders Use It
Quickly gauge buying vs selling effort across multiple horizons.
Compare short‑term wave volume to higher‑timeframe waves to spot:
Alignment → all up and big volumes = strong trend
Divergence → small or opposite‑colored higher‑TF wave = potential reversal or pause
Combine with Wyckoff, VSA, or standard trend analysis to judge if a breakout or pullback has real participation.
🧩 Key Features of This Version
Feature Description
Multi‑Timeframe Panel Displays WWV values for 3 selected TFs at once
Dynamic TF Mapping Auto‑adjusts which TFs to use based on chart
Up/Down Color Coding Customizable colors for wave direction
Adjustable Font and Placement Set font size (Tiny→Huge) and screen corner/center
No Histograms Keeps chart clean; acts as a compact WWV dashboard

Relative Strength Index + MTF VEIODORIOAn advanced technical indicator that combines multiple RSI (Relative Strength Index) analysis features into a single, comprehensive tool.
Main Features:
1. Traditional RSI
Calculates the standard Relative Strength Index with a configurable period (default: 14)
Displays overbought and oversold levels
Includes colored background fill for better visualization
2. Multi-Timeframe (MTF) Chart
Displays RSI values simultaneously across 8 different timeframes:
1 minute, 5 minutes, 15 minutes, 30 minutes
1 hour, 4 hours, 1 day, 1 week
MORE - MTF Open Retest Extensions [Pro]Overview
MORE- MTF Open Retest Extensions highlights what price typically does after a higher-timeframe structure break (taking out the previous candle’s high or low) and before a potential retest of the current open.
It plots percentile extension levels (above/below the broken side) that quantify how far price has historically moved prior to an open retest if a retest occurs, giving traders objective context for stretch vs. common movement around structural breaks.
Key features
• Break-aware logic: MORE activates only after the current timeframe has broken the prior candle’s high/low. No break → no extensions.
• Open-retest probabilities: Displays the empirical likelihood of retesting the current open following a break, with sensitivity to when in the interval the break occurred (early/late breaks can behave differently).
• Pre-retest extension percentiles: Five percentile bands (e.g., 25/50/75/85/95) show how far price typically extends before any open retest on the broken side.
• Multi-timeframe dashboard: Monitor multiple reference timeframes (e.g., 1h → 12h) while viewing any chart timeframe. See which breaks are active and the highest percentile reached this interval.
• Filtering & display controls: Toggle historical zones, choose zones vs. lines (or both).
• Filtering with a threshold: User can enter a threshold for the historical probability so that the open, zones, levels and dashboard only show for timeframes above this user defined input. e.g. input of 70%, zone and levels will only be drawn when the historical data was greater than or equal to this level.
• Show selected timeframe or all untested opens the dashboard is showing as "Active"
• 2 Alert types: Set for a specific timeframe to alert an activate open for retest or set a percentile level to be crossed and alert on cross.
No signals, just context: MORE is a descriptive tool for structure and stretch—use it alongside your own strategy and risk framework.
Methodology (transparency)
• MORE uses embedded statistical datasets constructed from extensive historical price behavior across multiple timeframes.
• Each dataset represents conditional empirical outcomes —specifically, how far price extended beyond a prior candle’s high/low before retesting its open on the same timeframe.
• Percentiles and probabilities are calculated from these internal data arrays, ensuring the indicator runs deterministically on TradingView with no external data connections .
• The proprietary component lies in:
The way volatility and structure are normalized across timeframes;
How conditional breaks and open-retest windows are segmented; and
How percentile extension zones are blended into continuous statistical envelopes.
• These methods and datasets are unique to LevelLogic Indicators and are not replicated from any public or open-source scripts.
• Outputs summarize historical tendencies for educational context only — they are not predictive signals .
How to use
• Pick the reference timeframe (e.g., 1H, 2H, 4H, … 12H).
• Wait for a break of the prior candle’s high/low on that timeframe—MORE then plots the pre-retest extension percentiles on the broken side.
• Use the open-retest probability as context only; combine with your own entry/management rules.
• Optionally toggle historical view to study prior intervals and how far price usually stretched before any open retest.
• Consider alerts on percentile crosses if you want notifications when price enters statistically stretched areas.
Notes
Educational/analytical tool — no signals, no performance or outcome promises.
Historical tendencies change with regime; treat outputs as context, not advice.
Non-standard bars (e.g., Heikin Ashi/Renko) are for display only.
Credits
Developed by LevelLogic Indicators to provide clear, empirical context around breaks and open-retest behavior across multiple timeframes.
Invite-only script
Only users approved by the author can access this script. Request permission per the author’s instructions.

Ghost Signal — MTF EMA/VWAP Confluence SystemGhost Signal — MTF EMA/VWAP Confluence System
Purpose
Ghost Signal is an intraday trend-entry tool that tries to do one thing well: only fire when multiple, independent edges agree. It looks for pullbacks to the EMA-20 or clean trend-continuations, then gates those raw triggers behind VWAP/Anchored-VWAP alignment, higher-timeframe structure, momentum, spacing (anti-chop), volume and ATR context. The goal is fewer, higher-quality entries that avoid “death-by-a-thousand scalps” in chop.
What it plots
EMA 20/50/200 for trend structure and spacing (no-braid filter).
VWAP (session) and optional Anchored VWAP (Daily/Weekly/Monthly).
ENTRY labels when all filters pass.
A compact status table: HTF score (M/W/D/4H/15/5), VWAP/AVWAP arrows, EMA regime, slopes %, ATR%, spacing %, and distance from EMA-50.
How signals are built
Raw triggers (on chart TF or a lower “signal TF” for intrabar precision):
PB20: trend pullback that crosses back through EMA-20.
TC: trend-continuation when price holds the side of EMA-20 with limited gap.
Confluence filters (must pass):
EMA regime & slopes: 20>50>200 for longs (reverse for shorts) with minimum slope on EMA-20/50.
VWAP/AVWAP alignment: price must be above both for longs / below for shorts, with a configurable margin.
HTF structure score: combines M/W/D/4H/15/5 states and penalizes corrections.
Anti-chop spacing: minimum separation between 20↔50 and 50↔200.
Context: volume ≥ SMA×mult, ATR% ≥ floor, max distance from EMA-50 to avoid late chases.
Optional breakout: close > prior high (long) / < prior low (short).
Time lockouts: exclude known messy windows (open/close, FX rollover, etc.).
Adaptive slope (optional): slopes auto-tighten/loosen with market heat (ATR% & relative volume).
How to use
Works on 1–5m best; designed for futures, stocks, FX, and crypto.
Use the status table to confirm context (HTF score, VWAP arrows, slopes/ATR/spacing).
Pair with your own risk model; common templates: stop ≈ 1.5–2× ATR, TP ≈ 1.2–1.8R or an ATR trail.
Turn the Signal TF to “1” on 3m/5m charts if you want intrabar PB20 detection.
Why it helps
Ghost Signal tries to stack institutional anchors (VWAP/AVWAP), higher-timeframe bias, and momentum/structure so you participate in moves with real sponsorship—and sit out the braid.
Notes & limits
No indicator removes risk. Expect fewer signals on range days, slippage around news, and thinner markets to require stricter volume/spacing. Past results don’t guarantee future returns.

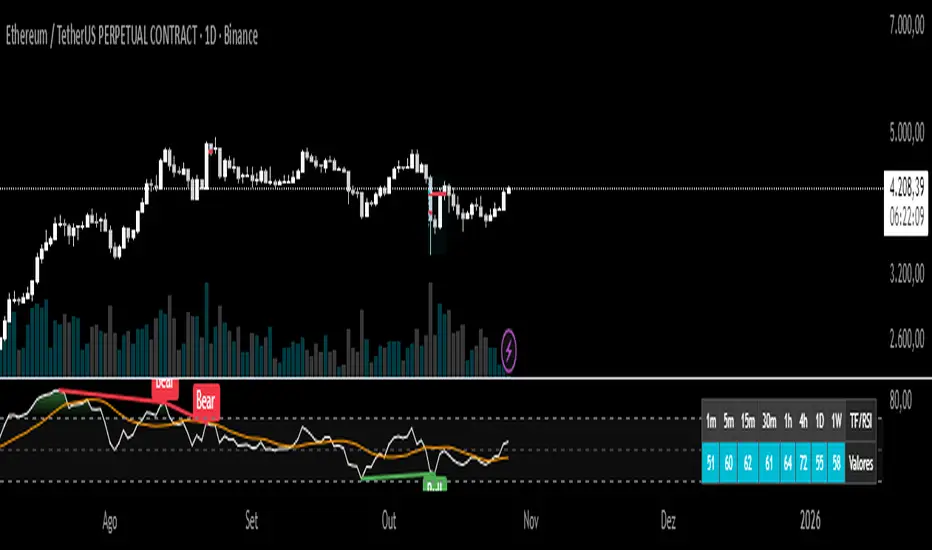
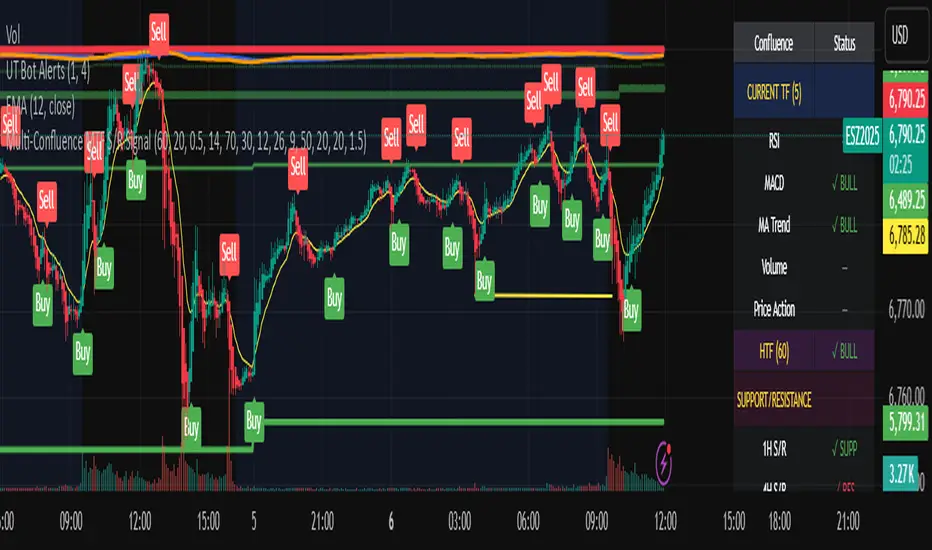
Multi-Confluence MTF S/R Signal5 Confluences:
RSI - Detects oversold/overbought conditions with momentum
MACD - Confirms trend direction and momentum shifts
Moving Average Trend - Validates price position relative to 50 SMA and 20 EMA
Volume - Ensures strong participation (1.5x average volume)
Price Action - Confirms breakout (higher high for buys, lower low for sells)
Features:
Green triangles below bars = BUY signal (all 5 confluences bullish)
Red triangles above bars = SELL signal (all 5 confluences bearish)
Background coloring when signals occur
Real-time dashboard showing each confluence status
Built-in alerts you can enable
Customizable parameters for all indicators
Multi-Timeframe Features:
Higher Timeframe Analysis (Default: 60 min)
HTF Trend - Checks if price is above/below moving averages on higher timeframe
HTF MACD - Confirms momentum direction
HTF RSI - Validates not overbought/oversold
Signal Types:
Strong Signals (Full triangles with text)
✅ All 5 current timeframe confluences aligned
✅ Higher timeframe confirmation (2 of 3 HTF conditions)
GREEN "BUY" or RED "SELL" labels
Weak Signals (Small transparent triangles with "?")
✅ All 5 current timeframe confluences aligned
❌ NO higher timeframe confirmation
Use with caution - may signal counter-trend trades
Dashboard Updates:
Shows Current Timeframe section (all 5 confluences)
Shows HTF status (your chosen higher timeframe)
Displays final signal strength
Customizable Settings:
Enable/Disable MTF - Toggle multi-timeframe confirmation
Higher Timeframe - Choose any timeframe (15m, 60m, 4H, D, etc.)
Require HTF - Force HTF confirmation or allow weak signals
Alerts:
Strong Buy/Sell - Full confirmation
Weak Buy/Sell - No HTF confirmation
ICT Cycle Boxes - MTFICT Cycle Boxes – Pro Strategy (3×MTF)
A multi-timeframe, confluence-driven strategy designed to capture impulsive moves, controlled pullbacks, and regime shifts. It evaluates three timeframes at once:
TF-A (Higher): establishes the broader regime.
TF-B (Mid): confirms trend context and momentum.
TF-C (Trade TF): times the entry.
Two entry tiers are used:
Very-Good Entries: all conditions align in the direction of the higher-timeframe regime, with fresh confirmation on the trade timeframe.
Medium Entries: directionally aligned but with lighter confirmation, for additional opportunities during established trends.
Risk is managed with ATR-based stops/targets on the trade timeframe, an optional trailing stop, position sizing by percent of equity, a cooldown after flat, and optional early exit when the trade timeframe returns to a neutral regime. Session filtering and flip-on-opposite are available for refined execution.
How to use
Set TF-A/TF-B/TF-C to suit your market (e.g., W/D/60, D/240/30).
Adjust risk parameters (stop/target, trailing, position size).
Enable session filtering if desired.
Review results in the Strategy Tester and fine-tune to your market and instrument.

Period Separator - MTF with Price LevelsPeriod Separator - MTF with Price Levels
A customizable multi-timeframe period separator indicator that displays a user-defined number of vertical lines with corresponding horizontal price levels.
Key Features:
Multi-Timeframe Support: Works with all timeframes from 1-minute to yearly (12M, 3M, M, W, D, 4H, 1H, 15m, 5m, 1m)
Complete Price Level Analysis: Shows horizontal lines for High, Low, 0.75, 0.50, 0.25, and Open levels for all visible periods between vertical separators
Seconds Chart Compatibility: Special 1-minute separator option for seconds timeframes
Full Customization: Independent color, style, and width settings for all lines
Smart Alerts: Optional price break alerts for high/low levels with sound options
Clean Memory Management: Automatically manages line objects to prevent chart clutter
Sliding Window Display: Set exactly how many vertical separator lines to show (1-20), with older lines automatically removed as new periods begin
Perfect for:
Session/period analysis with controlled visual complexity
Support/resistance level identification across multiple periods
Fibonacci-style level trading between defined time periods
Clean chart presentation with limited historical data display
Settings:
Number of Vertical Lines: Controls exactly how many period separators are visible
All price levels can be toggled on/off independently
Comprehensive styling options for professional chart presentation
Ideal for traders who want period-based analysis without overwhelming their charts with too many historical lines.
EMA 89 và EMA 34 - MTF AlertEMA34/89 in MTF and alert. If you want to find indicator for alert, I thing it for you

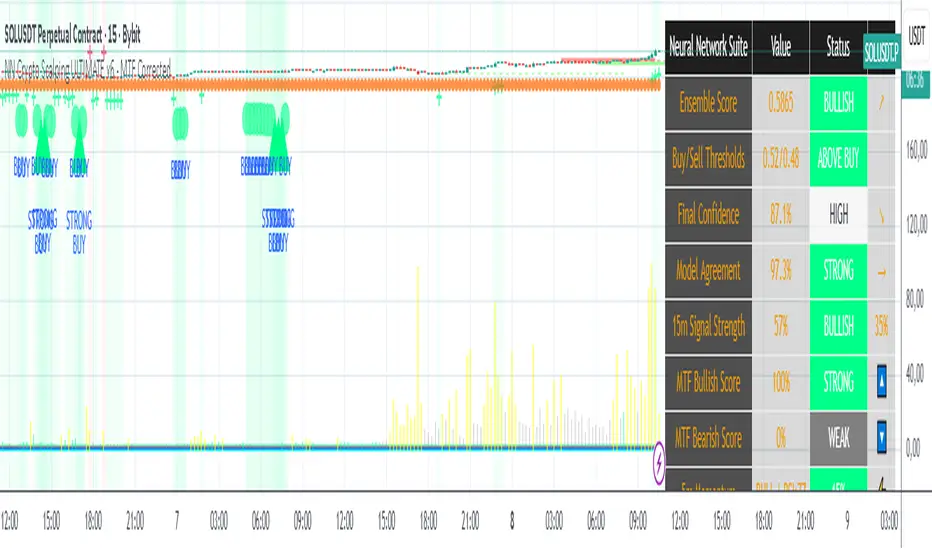
NN Crypto Scalping ULTIMATE v6 - MTF mapercivNeural Network Crypto Trading System v6.1
Complete Technical Documentation
Author
: Neural Network Ensemble Trading System
Version
: 6.1 - MTF Corrected & Bias Fixed
Date
: January 2025
Platform
: TradingView PineScript v6
Executive Summary
The
Neural Network Crypto Trading System v6.1
is an advanced algorithmic trading system that combines three specialized neural networks into an intelligent ensemble to generate cryptocurrency trading signals. The system integrates multi-timeframe analysis, crypto-specific optimizations, dynamic risk management, and continuous learning to maximize performance in highly volatile markets.
Key Features:
Ensemble of 3 specialized Neural Networks
(Primary, Momentum, Volatility)
Multi-Timeframe Analysis
with 5 timeframes (5m, 15m, 1h, 4h, 1D)
22 Advanced Features
for each model
Anti-repainting
guaranteed with confirmed data
8 Market Regime
automatic detections
6 Signal Levels
(Strong/Moderate/Weak Buy/Sell)
Professional dashboard
with 15+ real-time metrics
Intelligent alert system
with webhook integration
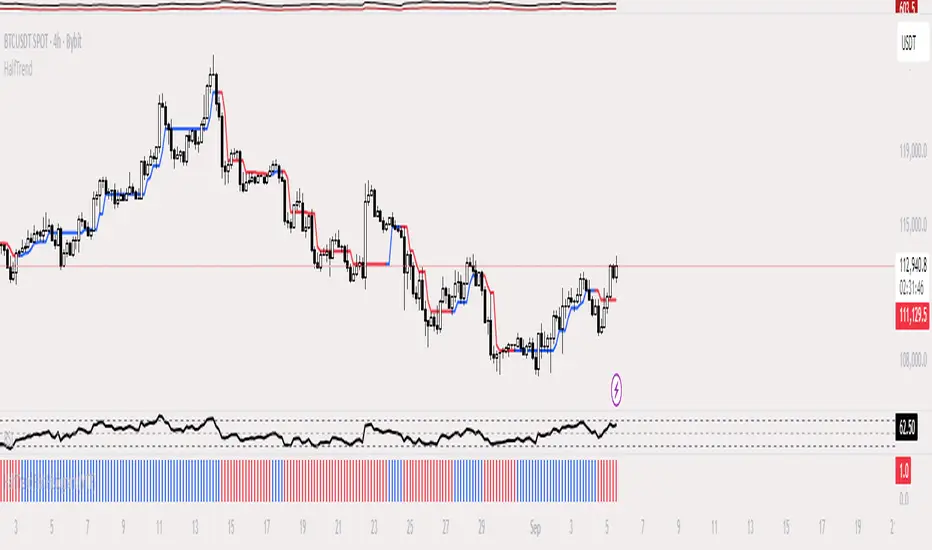
HalfTrend Histogram (MTF)This indicator shows the halftrend on a histogram (rather than a line on the chart) and has an option for Multi timeframe (MTF).
It uses the logic of the original halftrend coded by Everget.
The halftrend is a trend-following indicator that uses volatility to to determine change in bias.
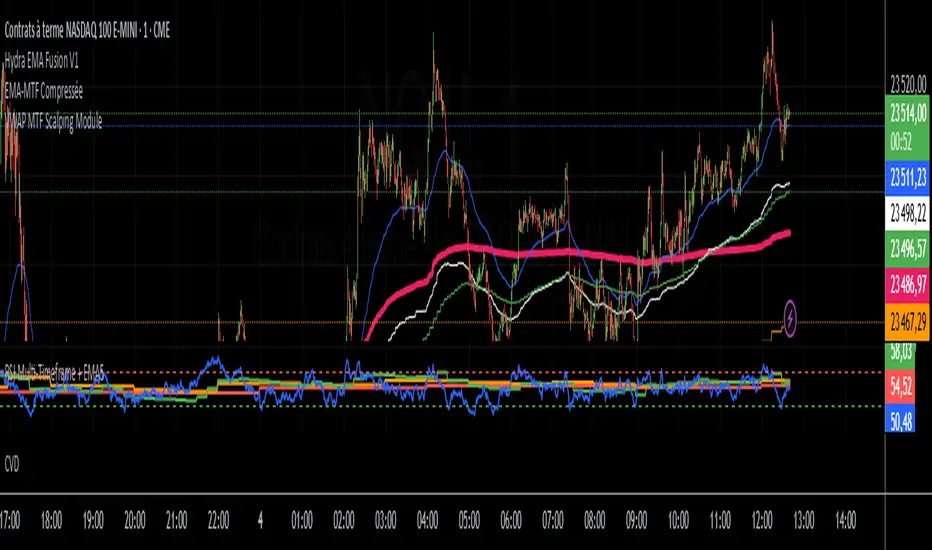
VWAP MTF Scalping ModuleThe VWAP MTF indicator allows you to visualize anchored VWAP across multiple timeframes, while maintaining a clean and responsive display.
Designed for intraday traders, scalpers, and swing traders, this module offers a clear view of volume-weighted average price zones across key timeframes (1m, 5m, 15m, 1h... customizable).
ADX MTF mura visionOverview
ADX MTF — mura vision measures trend strength and visualizes a higher-timeframe (HTF) ADX on any chart. The current-TF ADX is drawn as a line; the HTF ADX is rendered as “step” segments to reflect closed HTF bars without repainting. Optional soft fills highlight the 20–25 (trend forming) and 40–50 (strong trend) zones.
How it works
ADX (current TF) : Classic Wilder formulation using DI components and RMA smoothing.
HTF ADX : Requested via request.security(..., lookahead_off, gaps_off).
When a new HTF bar opens, the previous value is frozen as a horizontal segment.
The current HTF bar is shown as a live moving segment.
This staircase look is expected on lower timeframes.
Auto timeframe mapping
If “Auto” is selected, the HTF is derived from the chart TF:
<30m → 60m, 30–<240m → 240m, 240m–<1D → 1D, 1D → 1W, 1W/2W → 1M, ≥1M → same.
Inputs
DI Length and ADX Smoothing — core ADX parameters.
Higher Time Frame — Auto or a fixed TF.
Line colors/widths for current ADX and HTF ADX.
Fill zone 20–25 and Fill zone 40–50 — optional light background fills.
Number of HTF ADX Bars — limits stored HTF segments to control chart load.
Reading the indicator
ADX < 20: typically range-bound conditions; trend setups require extra caution.
20–25: trend emergence; breakouts and continuation structures gain validity.
40–50: strong trend; favor continuation and manage with trailing stops.
>60 and turning down: possible trend exhaustion or transition toward range.
Note: ADX measures strength, not direction. Combine with your directional filter (e.g., price vs. MA, +DI/−DI, structure/levels).
Non-repainting behavior
HTF values use lookahead_off; closed HTF bars are never revised.
The only moving piece is the live segment for the current HTF bar.
Best practices
Use HTF ADX as a regime filter; time entries with the current-TF ADX rising through your threshold.
Pair with ATR-based stops and a MA/structure filter for direction.
Consider higher thresholds on highly volatile altcoins.
Performance notes
The script draws line segments for HTF bars. If your chart becomes heavy, reduce “Number of HTF ADX Bars.”
Disclaimer
This script is for educational purposes only and does not constitute financial advice. Trading involves risk.

FibADX MTF Dashboard — DMI/ADX with Fibonacci DominanceFibADX MTF Dashboard — DMI/ADX with Fibonacci Dominance (φ)
This indicator fuses classic DMI/ADX with the Fibonacci Golden Ratio to score directional dominance and trend tradability across multiple timeframes in one clean panel.
What’s unique
• Fibonacci dominance tiers:
• BULL / BEAR → one side slightly stronger
• STRONG when one DI ≥ 1.618× the other (φ)
• EXTREME when one DI ≥ 2.618× (φ²)
• Rounded dominance % in the +DI/−DI columns (e.g., STRONG BULL 72%).
• ADX column modes: show the value (with strength bar ▂▃▅… and slope ↗/↘) or a tier (Weak / Tradable / Strong / Extreme).
• Configurable intraday row (30m/1H/2H/4H) + D/W/M toggles.
• Threshold line: color & width; Extended (infinite both ways) or Not extended (historical plot).
• Theme presets (Dark / Light / High Contrast) or full custom colors.
• Optional panel shading when all selected TFs are strong (and optionally directionally aligned).
How to use
1. Choose an intraday TF (30/60/120/240). Enable D/W/M as needed.
2. Use ADX ≥ threshold (e.g., 21 / 34 / 55) to find tradable trends.
3. Read the +DI/−DI labels to confirm bias (BULL/BEAR) and conviction (STRONG/EXTREME).
4. Prefer multi-TF alignment (e.g., 4H & D & W all strong bull).
5. Treat EXTREME as a momentum regime—trail tighter and scale out into spikes.
Alerts
• All selected TFs: Strong BULL alignment
• All selected TFs: Strong BEAR alignment
Notes
• Smoothing selectable: RMA (Wilder) / EMA / SMA.
• Percentages are whole numbers (72%, not 72.18%).
• Shorttitle is FibADX to comply with TV’s 10-char limit.
Why We Use Fibonacci in FibADX
Traditional DMI/ADX indicators rely on fixed numeric thresholds (e.g., ADX > 20 = “tradable”), but they ignore the relationship between +DI and −DI, which is what really determines trend conviction.
FibADX improves on this by introducing the Fibonacci Golden Ratio (φ ≈ 1.618) to measure directional dominance and classify trend strength more intelligently.
⸻
1. Fibonacci as a Natural Strength Threshold
The golden ratio φ appears everywhere in nature, growth cycles, and fractals.
Since financial markets also behave fractally, Fibonacci levels reflect natural crowd behavior and trend acceleration points.
In FibADX:
• When one DI is slightly larger than the other → BULL or BEAR (mild advantage).
• When one DI is at least 1.618× the other → STRONG BULL or STRONG BEAR (trend conviction).
• When one DI is 2.618× or more → EXTREME BULL or EXTREME BEAR (high momentum regime).
This approach adds structure and consistency to trend classification.
⸻
2. Why 1.618 and 2.618 Instead of Random Numbers
Other traders might pick thresholds like 1.5 or 2.0, but φ has special mathematical properties:
• φ is the most irrational ratio, meaning proportions based on φ retain structure even when scaled.
• Using φ makes FibADX naturally adaptive to all timeframes and asset classes — stocks, crypto, forex, commodities.
⸻
3 . Trading Advantages
Using the Fibonacci Golden Ratio inside DMI/ADX has several benefits:
• Better trend filtering → Avoid false DI crossovers without conviction.
• Catch early momentum shifts → Spot when dominance ratios approach φ before ADX reacts.
• Consistency across markets → Because φ is scalable and fractal, it works everywhere.
⸻
4. How FibADX Uses This
FibADX combines:
• +DI vs −DI ratio → Measures directional dominance.
• φ thresholds (1.618, 2.618) → Classifies strength into BULL, STRONG, EXTREME.
• ADX threshold → Confirms whether the move is tradable or just noise.
• Multi-timeframe dashboard → Aligns bias across 4H, D, W, M.
⸻
Quick Blurb for TradingView
FibADX uses the Fibonacci Golden Ratio (φ ≈ 1.618) to classify trend strength.
Unlike classic DMI/ADX, FibADX measures how much one side dominates:
• φ (1.618) = STRONG trend conviction
• φ² (2.618) = EXTREME momentum regime
This creates an adaptive, fractal-aware framework that works across stocks, crypto, forex, and commodities.
⚠️ Disclaimer : This script is provided for educational purposes only.
It does not constitute financial advice.
Use at your own risk. Always do your own research before making trading decisions.
Created by @nomadhedge

Anchorman - EMA Channel + EMA + MTF Status Table PRICE BREAKOUTUses a high/low EMA Channel to tell you when strong price breakouts are happening plus comes with a EMA to help follow the trend if you like. I designed it so it can alert you when a single TF touch happens or a breakout alignment on MTF happens (I recommend this) its up to you also its single alert so no need to do bullish or bearish signals just one signal will alert you when a breakout happens in EITHER direction.

Hitu - MTF High/Low Marker
This indicator is a powerful tool for traders, designed to display the high and low levels from multiple significant timeframes directly on your chart. It helps you quickly identify key support, resistance, and liquidity levels at a glance, improving your understanding of the market structure.
Key Features:
* Multi-Timeframe Support: Visualize high and low levels from Monthly, Weekly, Daily, 4H, 1H, 15M, and 5M timeframes.
* Full Customization: Each timeframe's line can be customized with your preferred color and style (Solid, Dashed, or Dotted) directly from the settings.
* Toggle On/Off: You have complete control to enable or disable any timeframe level to match your specific trading strategy.
How It Helps:
The MTF High/Low Marker simplifies the process of finding crucial price zones. By seeing key highs and lows from higher timeframes on your current chart, you can make more informed decisions about your entries, exits, and overall risk management.
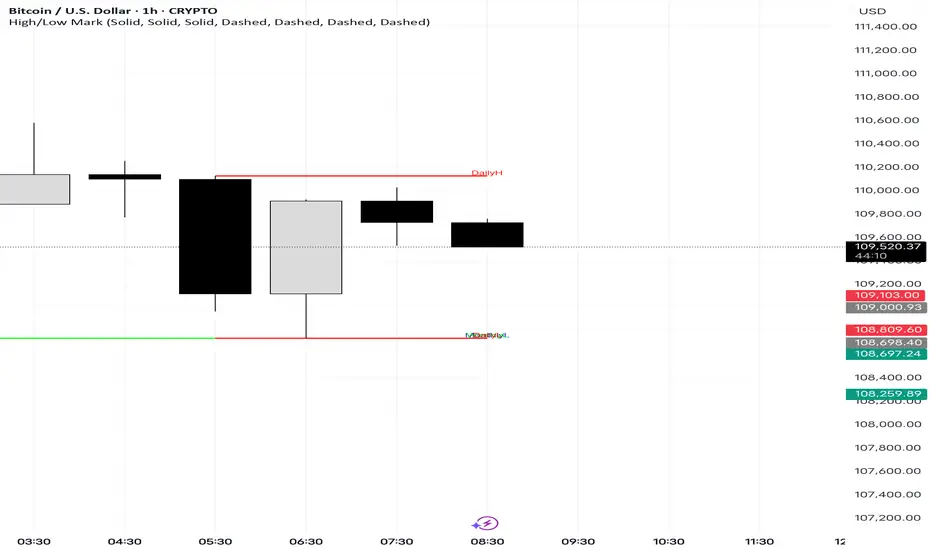
Tabela de Tendência e RSI MTF - Tabela em BaixoTabela de Tendência e RSI MTF - Tabela em Baixo
This custom TradingView indicator provides a consolidated view of trend and Relative Strength Index (RSI) across multiple timeframes, all within an intuitive table directly on your chart. Designed for traders seeking quick and efficient analysis of market momentum and direction across different time horizons, this indicator automatically adapts to the asset you are currently viewing.
With the table down

Jitendra: MTF AIO Technical Indicators with Trend ▲▼Jitendra: MTF AIO Technical Indicators with Trend ▲▼
Why We Designed this Indicator
we build this indicator to Analysis Multi-timeframe Technical Data in dashboard to get Better and Quick Data in which Time Frame where it is in Momentum or in Swing,
By combining multiple technical indicators with trend direction arrows and displaying them in a customizable table.
It also optionally plots some indicators EMA, VWAP, Supertrend, Bollinger Bands on the chart.
Traders who want a compact technical summary across multiple timeframes without switching charts.
Quickly assess trend strength, momentum, divergence, volume pressure in one glance.
Combine with price action to make higher-confidence entries/exits.
How to Use This Indicator
In setting there are Two parts
First Part - for Plot Multi EMA, Bollinger Band, Supertrend 10,2 & 10, 3 factorial
Second Part- To get Data on Table for Quick Analysis
Chart Plots With Enable Disable Toggle in Setting
VWAP (optional)
4 EMAs (lengths configurable)
Bollinger Bands (optional)
Two separate Supertrend indicators with custom ATR period and multiplier
Indicators Data in Table
For each selected timeframe:
VWAP position (price above/below)
MACD value + trend arrow
MACD Histogram (optional)
RSI value + arrow (rising/falling)
ADX value + arrow (strength rising/falling)
+DI / -DI values + trend arrows
RSI Divergence detection (regular + hidden)
EMA levels (up/down relative to price)
EMA crossover (EMA1 vs EMA2 arrow)
Stochastic %K
Volume Matrix:
Raw volume
20 SMA volume
Volume % change from SMA
Multi-Timeframe Support
Current timeframe + up to 5 user-defined timeframes (e.g., 1H, 4H, Daily, Weekly, Monthly)
Customizable Toggles
Enable/disable any indicator
Choose which EMAs to show
Show/hide trend arrows
Choose which volume metrics to display
Choose table position (top_left, top_right, etc.)
Choose table text size
Trend Arrows & Colors
Green ▲ = bullish / rising trend
Red ▼ = bearish / falling trend
Gray – = neutral/no change
Background colors indicate overbought/oversold, trend strength, or volume surge.
Indicator Data Fetch PINE CODE Short Summary
request.security() → pulls data from the selected timeframe (tf).
Each indicator’s calculation can be wrapped inside request.security() so the values are computed on that timeframe.
//@version=5
// === 1. VWAP ===
vwap_htf = request.security(syminfo.tickerid, tf, ta.vwap)
// === 2. MACD ===
macd_src = request.security(syminfo.tickerid, tf, close)
macd_val = ta.ema(macd_src, 12) - ta.ema(macd_src, 26)
macd_sig = ta.ema(macd_val, 9)
macd_hist = macd_val - macd_sig
// === 3. RSI ===
rsi_htf = request.security(syminfo.tickerid, tf, ta.rsi(close, 14))
// === 4. ADX & DI ===
adx_htf = request.security(syminfo.tickerid, tf, ta.adx(14))
plusDI = request.security(syminfo.tickerid, tf, ta.plus_di(14))
minusDI = request.security(syminfo.tickerid, tf, ta.minus_di(14))
// === 5. Supertrend ===
= request.security(syminfo.tickerid, tf, ta.supertrend(3, 7))
// === 6. Bollinger Bands ===
basis = ta.sma(close, 20)
dev = ta.stdev(close, 20)
bb_up = request.security(syminfo.tickerid, tf, basis + dev * 2)
bb_low = request.security(syminfo.tickerid, tf, basis - dev * 2)
// === 7. Stochastic ===
k = ta.sma(ta.stoch(close, high, low, 14), 3)
d = ta.sma(k, 3)
stochK = request.security(syminfo.tickerid, tf, k)
stochD = request.security(syminfo.tickerid, tf, d)
// === 8. EMA ===
ema20 = request.security(syminfo.tickerid, tf, ta.ema(close, 20))
ema50 = request.security(syminfo.tickerid, tf, ta.ema(close, 50))
// === 9. Historical Volatility (HV) ===
logReturns = math.log(close / close )
hv = request.security(syminfo.tickerid, tf, ta.stdev(logReturns, 20) * math.sqrt(252))
plot(vwap_htf, "VWAP")
plot(macd_val, "MACD", color=color.blue)
plot(rsi_htf, "RSI", color=color.purple)

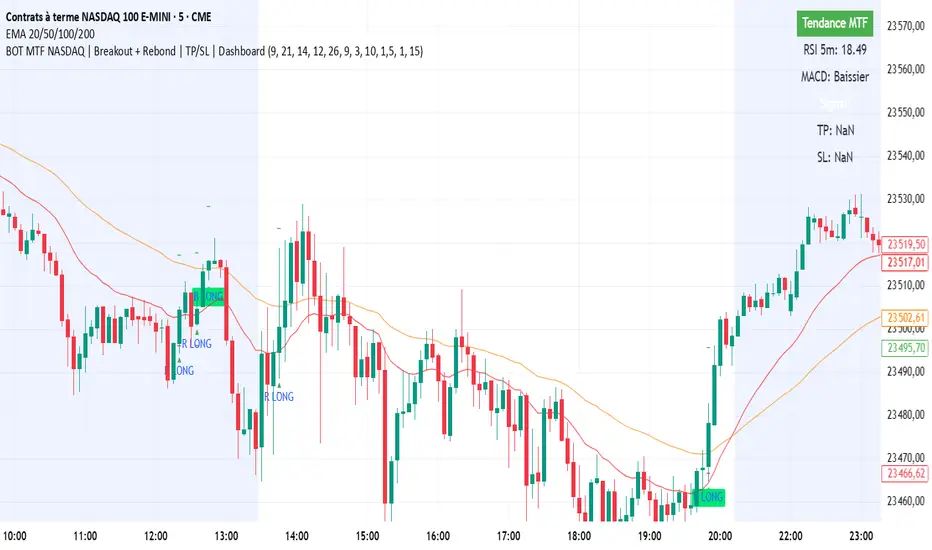
BOT MTF NASDAQ | Breakout + Rebond | TP/SL | DashboardBOT MTF NASDAQ | Breakout + Rebond | TP/SL | Dashboard
Keltner Channels MTFKeltner Channels MTF | Adapted 🌌
Navigate the market’s wild waves with these Keltner Channels, a sleek spin on AlchimistOfCrypto’s Bollinger Bands! This Pine Script v6 indicator tracks price action like a radar, highlighting trends with scientific precision. 🧪
Key Features:
Customizable Channels: Adjust period and multiplier to map market volatility, signaling potential reversals when prices hit the upper or lower bands. 📈
MA Options: Switch between Exponential or Simple Moving Average for trend clarity. ⚙️
Band Styles: Select Average True Range, True Range, or Range to define volatility edges. 📏
Glow Effect: Illuminate bands with 8 vibrant themes (Neon, Grayscale, etc.) for visual pop. ✨
Trend Signals: Spot bullish/bearish shifts with glowing circles, flagging momentum changes. 💡
Alerts: Catch price breakouts or trend reversals at band edges, warning of potential market U-turns. 🚨
Perfect for traders decoding market trends with a touch of cosmic style! 🌠
