ORB + SMA + EMA + BUY/SELL by yuvaraj ORB (Opening Range Breakout)
Meaning:
ORB stands for Opening Range Breakout.
It is a trading strategy where you watch the price movement for the first few minutes after the market opens (for example, 9:15 – 9:30 AM in India).
You mark the high and low during this period.
If price goes above the high, it signals a possible buy (long trade).
If price goes below the low, it signals a possible sell (short trade).
Why traders use it:
First few minutes decide the market direction.
Helps catch early momentum trades.
Very popular for intraday traders (Nifty, BankNifty, Crude Oil, etc.).
Example:
Market opens at 9:15.
First 5 minutes: High = 100, Low = 95.
If price moves above 100 → Buy.
If price moves below 95 → Sell.
📌 SMA (Simple Moving Average)
Meaning:
SMA stands for Simple Moving Average.
It is the average closing price of a stock over a certain number of candles.
Example:
SMA 9 → Average price of last 9 candles.
SMA 50 → Average price of last 50 candles.
Why traders use it:
Shows trend direction.
SMA going up → Uptrend, SMA going down → Downtrend.
You can use multiple SMAs (for example SMA 9 and SMA 50):
If SMA 9 crosses above SMA 50 → Buy signal.
If SMA 9 crosses below SMA 50 → Sell signal.
🔑 Key Difference:
Feature ORB SMA
Type Strategy (price breakout) Indicator (average price)
Use Entry trigger for trades Identifies trend direction
Works Best Intraday (first minutes) Any timeframe (intraday or swing)
Plots ORB High/Low lines for the first few minutes
Plots SMA 9/50/180 & EMA 20
Plots trailing stopline + Buy/Sell arrows
Optional bar color / background color toggle
Alert conditions for Buy/Sell
ORB high/low lines
SMA 9/50/180 + EMA 20
Buy/Sell arrows + trailing stopline
Tìm kiếm tập lệnh với "nifty"

Dual Relative Strength FlexibleDual Relative Strength Flexible (RS1 & RS2)
This indicator calculates two Relative Strength (RS) values to compare a stock’s performance over two timeframes against different benchmarks.
Key Features:
RS1: Measures long-term relative strength of the stock versus a primary benchmark index (e.g., NIFTY).
RS2: Measures short-term relative strength which can be customized by the user to compare the stock against a sectoral index, NIFTY 500, NIFTY Total Market, or any other preferred index.
Zero Baseline: Displays neutral performance level for quick interpretation.
Color-coded plots to highlight outperformance (green hues) or underperformance (red hues).
Background shading: Green when both RS1 & RS2 are positive, red when both are negative.
Info Table: Shows current RS1, RS2 values, benchmark names, and their difference in percentage terms.

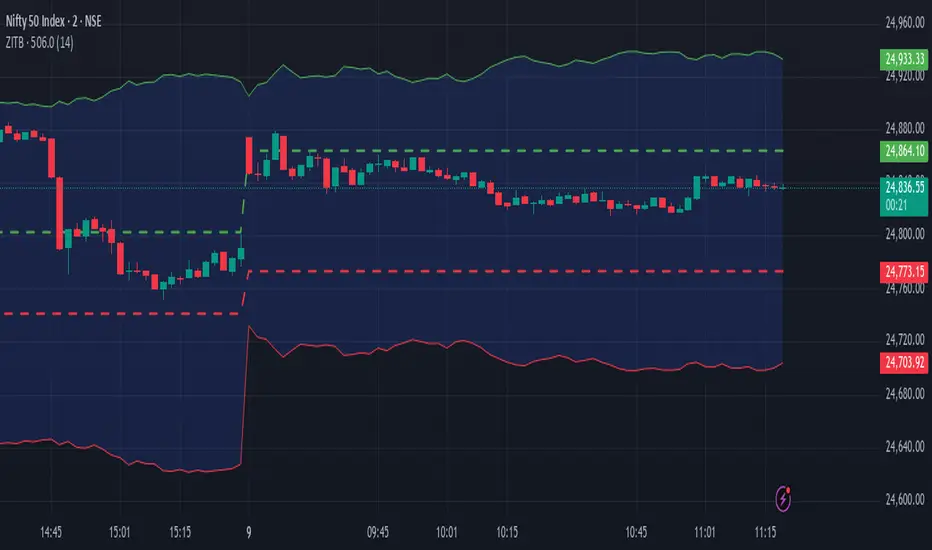
Zarattini Intra-day Threshold Bands (ZITB)This indicator implements the intraday threshold band methodology described in the research paper by Carlo Zarattini et al.
papers.ssrn.com
Overview:
Plots intraday threshold bands based on daily open/close levels.
Supports visualization of BaseUp/BaseDown levels and Threshold Upper/Lower bands.
Optional shading between threshold bands for easier interpretation.
Usage Notes / Limitations:
Originally studied on SPY (US equities), this implementation is adapted for NSE intraday market timing, specifically the NIFTY50 index.
Internally, 2-minute candles are used if the chart timeframe is less than 2 minutes.
Values may be inaccurate if the chart timeframe is more than 1 day.
Lookback days are auto-capped to avoid exceeding TradingView’s 5000-bar limit.
The indicator automatically aligns intraday bars across multiple days to compute average deltas.
For better returns, it is recommended to use this indicator in conjunction with VWAP and a volatility-based position sizing mechanism.
Can be used as a reference for Open Range Breakout (ORB) strategies.
Customizations:
Toggle plotting of base levels and thresholds.
Toggle shading between thresholds.
Line colors and styles can be adjusted in the Style tab.
Author:
Gokul Ramachandran – software architect, engineer, programmer. Interested in trading and investment. Currently trading and researching strategies that can be employed in NSE (Indian market).
Contact: (mailto:gokul4trading@gmail.com)
LinkedIn: www.linkedin.com
Intended for educational and research purposes only.
Snehal Desai's Nifty Predictor This script will let you know all major indicator's current position and using AI predict what is going to happen nxt. for any quetions you can mail me at snehaldesai37@gmail.com. for benifit of all.

STOCK SCHOOL | FVGThe Stock School FVG Indicator is designed to help traders identify and trade Fair Value Gaps (FVGs) and Inverse FVGs (IFVGs) with precision.
Built for both intraday and swing traders, this tool highlights high-probability trading zones where institutions leave imbalances in the market.
✨ Key Features:
Auto-detects FVGs & IFVGs in real-time
Works on all timeframes and instruments (Nifty, BankNifty, Stocks, Forex, Crypto)
Non-repainting logic for reliable signals
Clean and easy-to-use interface with Stock School styling
Perfect for Smart Money Concept (SMC) traders
🚀 With this indicator, you can:
Spot institutional footprints quickly
Combine with BOS, CHoCH, Order Blocks for high accuracy
Trade liquidity sweeps + FVG collisions with confidence
💡 Disclaimer:
This indicator is for educational purposes only. Trading involves risk. Always use proper risk management.

Dual Relative Strength (Fast & Slow, Single Baseline)Dual-Period RS Setup (Fast + Slow)
1. Fast RS (Early Leadership)
• Indicator: Relative Strength (by modhelius)
• Comparative Symbol: NIFTY
• Period: 26 weeks (~6 months)
• Purpose: Detects early shifts in relative strength before price fully confirms.
⸻
2. Slow RS (Confirmation)
• Add the same indicator again.
• Comparative Symbol: NIFTY
• Period: 52 weeks (1 year)
• Purpose: Confirms sustained leadership. Helps filter noise & false positives.

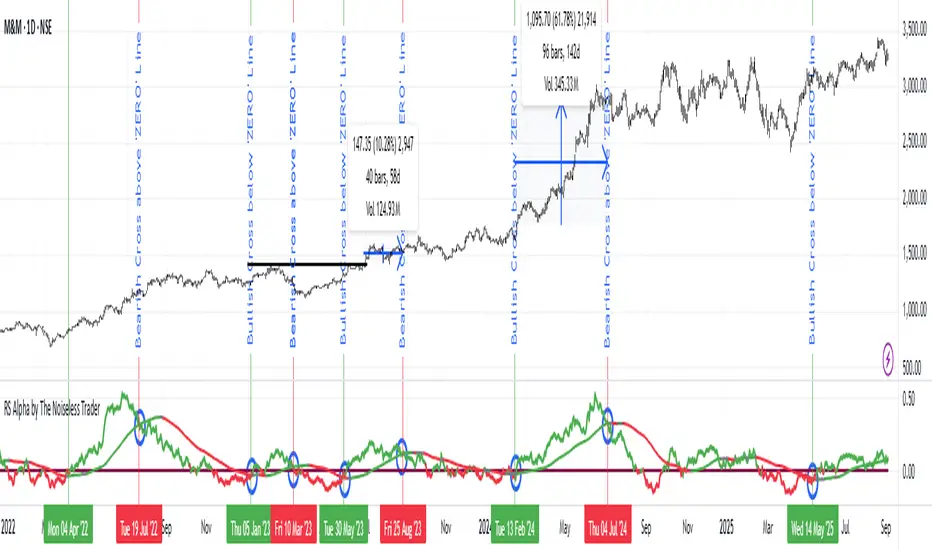
RS Alpha by The Noiseless TraderRS Alpha by The Noiseless Trader plots a clean, benchmark‑relative strength line for any symbol and (optionally) a mean line to assess trend and momentum in relative performance. It’s designed for uncluttered, professional RS analysis and works across any timeframe.
Compare any symbol vs a benchmark (default: NSE:NIFTY).
Optional log‑normalized RS for return‑aware comparisons.
Optional RS Mean with trend coloring (rising/falling).
Optional RS Trend zero‑line coloring based on short‑range slope.
Lightweight alerts for rising/falling RS mean.
Tip: Use RS to identify leaders (RS > 0 with rising mean) and laggards (RS < 0 with falling mean), then align setups with your price action rules.
Reading the indicator
Leadership: RS > 0 and RS Mean rising → outperformance vs benchmark.
Weakness: RS < 0 and RS Mean falling → underperformance vs benchmark.
Inflections: Watch RS crossing above/below its Mean for early shifts.
Zero‑line context: With RS Trend on, the zero line subtly reflects short‑term slope (green for positive, maroon for negative).
Alerts
Rising Strength – RS Mean turning/remaining upward.
Declining Strength – RS Mean turning/remaining downward.
(Use these as context; execute entries on your price‑action rules.)
Best practices
Pair RS with your trend/structure rules (e.g., higher highs + RS leadership).
For sectors/baskets, keep the Comparative Symbol consistent to rank peers.
Log‑normalized RS helps when comparing assets with very different volatilities or large base effects.
Test multiple length and Mean settings; 60 is a balanced default for swing/positional work.
Credits
Original concept & code: © bharatTrader
Modifications & refinements: The Noiseless Trader
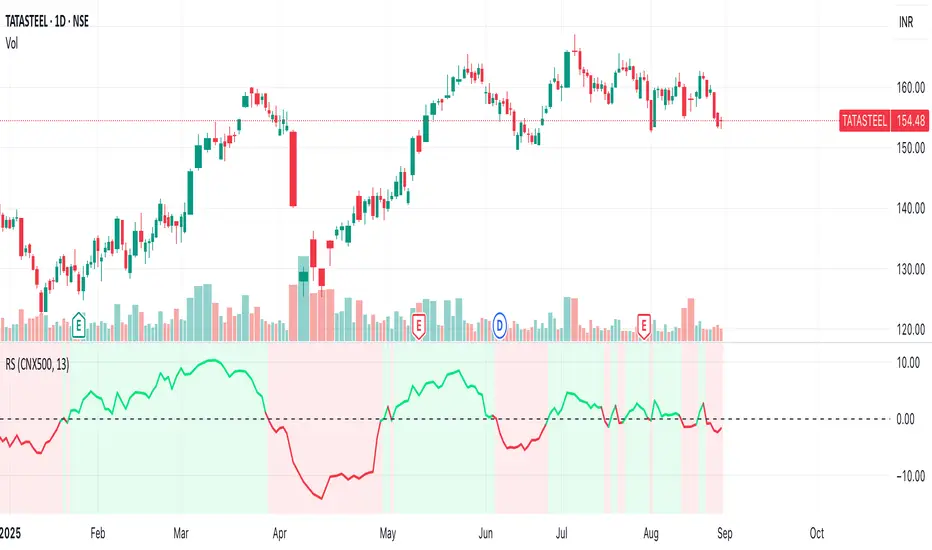
Relative Strength with CNX500This indicator compares the relative strength of the stock with respect to a wider benchmark index Nifty 500
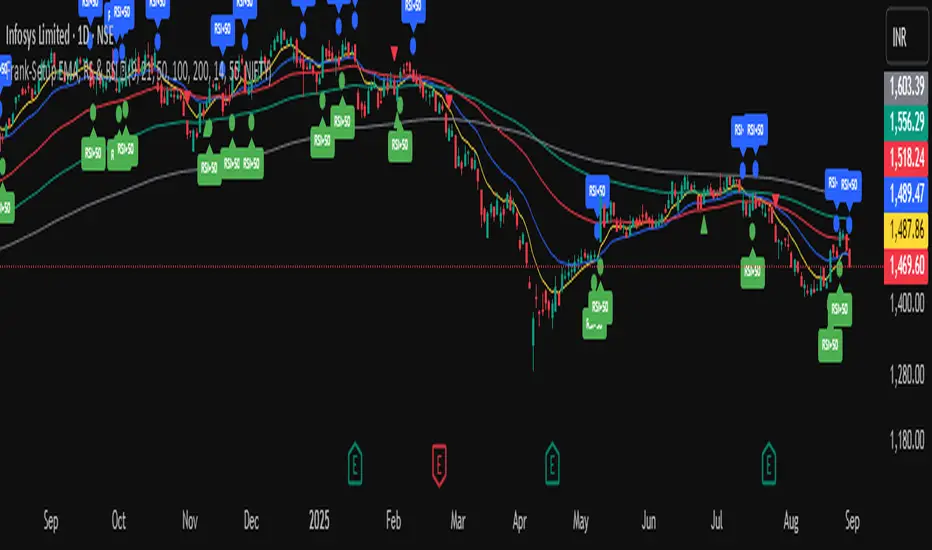
Frank-Setup EMA, RS & RSI ✅It is a clean and simple indicator designed to identify weakness in stocks using two proven methods: RSI and Relative Strength (RS) vs. a benchmark (e.g., NIFTY).
🔹 Features
RSI Weakness Signals
Plots when RSI crosses below 50 (weakness begins).
Plots when RSI moves back above 50 (weakness ends).
Relative Strength (RS) vs Benchmark
Compares stock performance to a chosen benchmark.
Signals when RS drops below 1 (stock underperforming).
Signals when RS recovers above 1 (strength resumes).
Clear Visual Markers
Circles for RSI signals.
Triangles for RS signals.
Optional RSI labels for clarity.
Built-in Alerts
Get notified instantly when RSI or RS weakness starts or ends.
No need to constantly watch charts.
🎯 Use Case
This tool is built for traders who want to:
Spot shorting opportunities when a stock shows weakness.
Track underperformance vs. the index.
Manage risk by exiting longs when weakness appears.
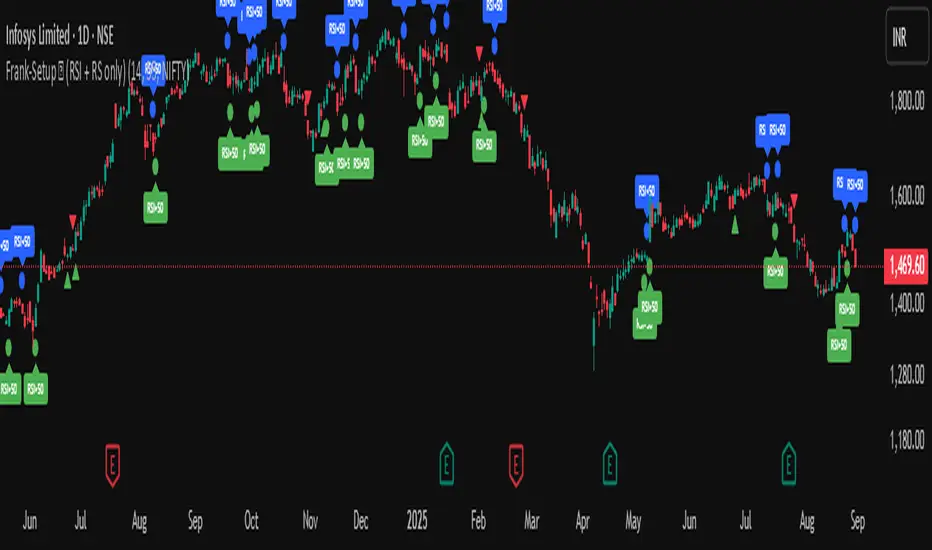
Frank-Setup ✅ (RSI + RS only)Frank-Shorting Setup ✅ is an indicator designed to help traders spot weakness in a stock by combining RSI and Relative Strength (RS) analysis.
🔹 Key Features
RSI Weakness Signals
Marks when RSI falls below 50 (downside pressure begins).
Marks when RSI moves back above 50 (weakness ends).
Relative Strength (RS) vs Benchmark
Compares stock performance to a benchmark (e.g., NIFTY).
Signals when RS drops below 1 (stock underperforming).
Signals when RS moves back above 1 (strength resumes).
Clear Chart Markings
Circles for RSI signals.
Triangles for RS signals.
Optional labels for extra clarity.
Alerts Built-In
Get notified when RSI or RS weakness starts/ends.
No need to monitor charts all the time

Frank-Shorting Setup ✅ (RSI + RS only)An indicator designed to help traders spot weakness in a stock by combining RSI and Relative Strength (RS) analysis.
🔹 Key Features
RSI Weakness Signals
Marks when RSI falls below 50 (downside pressure begins).
Marks when RSI moves back above 50 (weakness ends).
Relative Strength (RS) vs Benchmark
Compares stock performance to a benchmark (e.g., NIFTY).
Signals when RS drops below 1 (stock underperforming).
Signals when RS moves back above 1 (strength resumes).
Clear Chart Markings
Circles for RSI signals.
Triangles for RS signals.
Optional labels for extra clarity.
Alerts Built-In
Get notified when RSI or RS weakness starts/ends.
No need to monitor charts all the time
Third Eye ORB Pro (0915-0930 IST, no-plot)Third Eye ORB Pro (Opening Range Breakout + Range Mode)
This indicator is designed specifically for Indian stocks and indices (NIFTY, BANKNIFTY, FINNIFTY, MIDCAP, etc.) to track the Opening Range (09:15–09:30 IST) and generate actionable intraday trade signals. It combines two key modes — Range Mode (mean reversion inside the opening range) and Breakout Mode (momentum trading beyond the range).
1. Opening Range Framework (09:15–09:30 IST)
The indicator automatically plots the Opening Range High (ORH) and Opening Range Low (ORL) after the first 15 minutes of market open.
The area between ORH and ORL acts as the intraday battlefield where most price action occurs (historically ~70–80% of the day is spent inside this zone).
A shaded box and horizontal lines mark this range, serving as a visual reference for support and resistance throughout the day.
2. Range Mode (Mean Reversion Inside OR)
When price trades inside the Opening Range, the indicator looks for edge rejections to capture range-bound trades.
Range BUY (RB): Triggered near ORL when a bullish rejection candle forms (strong body + long lower wick).
Range SELL (RS): Triggered near ORH when a bearish rejection candle forms (strong body + long upper wick).
Optional filters (toggleable in settings):
RSI Filter: Only allow range buys if RSI is oversold (≤45) and range sells if RSI is overbought (≥55).
VWAP Filter: Only allow range trades if price is not too far from VWAP (distance ≤ X% of OR size).
Labels show suggested Stop Loss (just outside the OR band) and Target (midline/VWAP).
Cooldown logic prevents consecutive whipsaw signals.
3. Breakout Mode (Directional Moves Beyond OR)
When price closes strongly outside the ORH/ORL with momentum, the indicator confirms a breakout/breakdown trade.
Buffers are applied to avoid false breakouts:
ATR Buffer: Price must extend at least ATR × multiplier beyond the range edge.
% Buffer: Price must extend at least a percentage of OR size (default 10%).
Confirmation Filters:
Candle must have a strong body (≥60% of total bar range).
Optional “two closes” rule: price must close outside the range for 2 consecutive candles.
BUY BO: Trigger when price closes above ORH + buffer with momentum.
SELL BD: Trigger when price closes below ORL – buffer with momentum.
Labels and alerts are plotted for quick action.
4. Practical Usage
Works best on 5-minute charts for intraday trading.
Designed to help traders capture both:
Range-bound moves during the day (mean reversion plays).
Strong directional breakouts when institutions push price beyond the opening range.
Particularly effective on expiry days, trending sessions, and major news days when breakouts are more likely.
On sideways days, Range Mode provides reliable scalp opportunities at the OR edges.
5. Features
Auto-plots Opening Range High, Low, Midline.
Box + line visuals (no repainting).
Buy/Sell labels for both Range Mode and Breakout Mode.
Customizable buffers (ATR, % of range) to suit volatility.
Alerts for all signals (breakouts and range plays).
Built with risk management in mind (suggested SL and TP shown on chart).

Supertrend Trend Change Signals + Covered Points Only (v5)[NR]Supertrend with Buy/Sell Signals + Covered Points (v5)
Description
This indicator is a custom version of the Supertrend that provides:
Buy/Sell signals whenever the trend flips (Up → Buy, Down → Sell).
Covered points label at the end of each trend, showing the total price movement captured from entry to exit.
Optional colored candles based on trend direction.
Visual markers (triangle up/down) for quick identification of flips.
Built-in alert conditions for Buy and Sell flips.
Use case:
Designed for traders who want not only entry/exit alerts but also a quick view of how many points the previous run covered. Especially useful for index futures (e.g., NIFTY, BankNIFTY) or instruments where point movement matters.
⚠ Note: This is a study/indicator, not a strategy. It does not auto-trade and should be combined with your own analysis and risk management.

SmartPlusSmartPlus
Overview
The SmartPlus indicator is a complete framework for intraday traders. It combines key market reference points (VWAP, moving averages, and the first 15-minute high/low range) with predictive levels based on historical daily moves. Together, these elements allow traders to build directional bias, spot breakouts, and manage risk throughout the session.
Key Features
1. VWAP (Volume-Weighted Average Price)
- Plots the intraday VWAP in real time.
- VWAP acts as a central “fair value” reference point for institutional order flow.
- Price trading above VWAP generally suggests bullish bias, while below VWAP leans bearish.
2. Exponential Moving Averages (EMAs)
- Two configurable EMAs are included:
- Fast EMA (default: 21 periods)
- Slow EMA (default: 34 periods)
- Each EMA is plotted with a single, user-selectable color for clarity.
- Crossovers or alignment between price, VWAP, and EMAs help define market structure.
3. Smart Bar Coloring
- Candles automatically change color when conditions align:
- Bull Zone: Price above VWAP, Fast EMA, and Slow EMA.
- Bear Zone: Price below VWAP, Fast EMA, and Slow EMA.
- Fluorescent bar coloring helps highlight momentum zones visually without additional analysis.
4. First 15-Minute High/Low/Mid (Automatic)
- Automatically detects the first 15 minutes of each new trading day (no manual input required).
- Plots horizontal lines for:
- First 15-Minute High (green)
- First 15-Minute Low (red)
- Midpoint of that range (gray)
- Once the initial 15-minute window ends, these levels remain projected throughout the session as breakout or support/resistance zones.
- Alerts trigger when price breaks above the high or below the low after the window.
5. Daily Support/Resistance Forecast
- Uses a rolling lookback of recent daily ranges (default: 126 days).
- Tracks average up moves and down moves from the daily open.
- Optionally incorporates standard deviation for wider confidence bands.
- Plots forecast levels above/below the current day’s open for reference.
Trading Logic (How to Use)
- Bullish Bias:
- Price is above VWAP, above both EMAs, and ideally above the first 15-minute high.
- This setup suggests trend continuation or breakout opportunities on the long side.
- Bearish Bias:
- Price is below VWAP, below both EMAs, and ideally below the first 15-minute low.
- This setup suggests downward pressure or breakout opportunities on the short side.
- Neutral / Caution Zone:
- Price caught between VWAP, EMAs, or inside the 15-minute range often signals indecision.
- Best to wait for confirmation or breakout before committing to trades.
Expectations After Using It
- The script provides context and structure, not trading signals.
- It highlights where price is relative to meaningful market levels so traders can act with greater confidence.
- Combining VWAP, EMAs, and the 15-minute breakout framework helps traders stay aligned with the market’s natural rhythm.
Disclaimer
This script is a tool for market analysis and educational purposes only.
It does not constitute financial advice, trading recommendations, or guaranteed profitability.
Markets are inherently risky, and past patterns do not ensure future results.
Always combine this tool with sound risk management, personal research, and professional guidance before making any trading decisions.

Pure Price Zone Flow🔎 What this indicator is
It’s a price-action-based zone indicator. Unlike moving average systems, this one relies only on:
1. Swing Highs & Swing Lows → The highest and lowest points within a recent lookback period (like "mini support & resistance").
2. ATR (Average True Range) → A volatility measure that expands the zone, making it more adaptive to different market conditions.
3. Breakouts & Retests → When price breaks above a swing high (bullish) or below a swing low (bearish), the indicator marks it and highlights the new trend.
👉 The goal is to spot clean structure shifts and define clear trend zones where traders can position themselves.
________________________________________
⚙️ How it is calculated
1. Swing High & Swing Low
o We look back len candles (default 20).
o Find the highest high (swingHigh) and the lowest low (swingLow) in that window.
o This forms the price range zone.
2. ATR Expansion
o We calculate ATR over the same len.
o Add/subtract it (multiplied by atrMult) to the zone edges to expand them.
o This ensures the zones breathe with volatility (tight in quiet markets, wide in choppy ones).
3. Mid-Zone
o Simply the average of swingHigh and swingLow.
o If price is above mid → bullish bias.
o If below mid → bearish bias.
o This gives us the trend color for candles.
4. Breakouts
o If the close crosses above swingHigh, we mark a bullish breakout with a label.
o If the close crosses below swingLow, we mark a bearish breakdown.
________________________________________
📊 How it helps traders
This indicator helps by:
1. Identifying Structure Shifts
o Many traders watch swing highs/lows for breakouts or reversals.
o This automates the process and visually confirms when structure is broken.
2. Dynamic Zone Trading
o Instead of fixed support/resistance, the ATR expansion adapts to volatility.
o This avoids false signals in high-volatility conditions.
3. Trend Bias at a Glance
o Candle coloring instantly tells you whether price is in bullish or bearish territory relative to the mid-zone.
4. Breakout Confirmation
o The labels show when a breakout has occurred, so traders can react quickly (e.g., enter with trend, wait for retest, or avoid fading moves).
________________________________________
🌍 Markets it works best in
• Crypto (Bitcoin, Ethereum, etc.): Very effective since crypto is breakout-driven and respects swing levels.
• Forex: Good for volatility-adaptive structure analysis, especially in trending pairs.
• Indices (SPX, NASDAQ, DAX, NIFTY): Useful for breakout trading during session opens or key news events.
• Commodities (Gold, Oil, Silver): Works well to define intraday ranges and breakout levels.
⚠️ Less useful in low-volatility, mean-reverting assets (like some penny stocks or sideways ranges), because breakouts may be rare or fake.
________________________________________
💡 How it adds value
• Strips away unnecessary complexity (no lagging averages).
• Focuses directly on what price is doing structurally.
• Adaptive → works across different markets & timeframes.
• Easy visualization → zones, trend coloring, breakout markers.
• Helps traders trade with the flow of the market, instead of guessing tops/bottoms.
________________________________________
👉 In short:
This indicator turns raw price action into clear, actionable zones.
It highlights when the market shifts from balance to breakout, so traders can align with momentum rather than fighting it.

Straddle Charts - Live (Enhanced)Track options straddles with ease using the Straddle Charts - Live (Enhanced) indicator! Originally inspired by @mudraminer, this Pine Script v5 tool visualizes live call, put, and straddle prices for instruments like BANKNIFTY. Plotting call (green), put (red), and straddle (black) prices in a separate pane, it offers real-time insights for straddle strategy traders.
Key Features:
Live Data: Fetches 1-minute (customizable) option prices with error handling for invalid symbols.
Price Table: Displays call, put, straddle prices, and percentage change in a top-left table.
Volatility Alerts: Highlights bars with straddle price changes above a user-defined threshold (default 5%) with a yellow background and concise % labels.
Robust Design: Prevents plot errors with na checks and provides clear error messages.
How to Use: Input your call/put option symbols (e.g., NSE:NIFTY250814C24700), set the timeframe, and adjust the volatility threshold. Monitor straddle costs and volatility for informed trading decisions.
Perfect for options traders seeking a simple, reliable tool to track straddle performance. Check it out and share your feedback!

Volume Delta Pressure Tracker by GSK-VIZAG-AP-INDIA📢 Title:
Volume Delta Pressure Tracker by GSK-VIZAG-AP-INDIA
📝 Short Description (for script title box):
Real-time volume pressure tracker with estimated Buy/Sell volumes and Delta visualization in an Indian-friendly format (K, L, Cr).
📃 Full Description
🔍 Overview:
This indicator estimates buy and sell volumes using candle structure (OHLC) and displays a real-time delta table for the last N candles. It provides traders with a quick view of volume imbalance (pressure) — often indicating strength behind price moves.
📊 Features:
📈 Buy/Sell Volume Estimation using the candle’s OHLC and Volume.
⚖️ Delta Calculation (Buy Vol - Sell Vol) to detect pressure zones.
📅 Time-stamped Table displaying:
Time (HH:MM)
Buy Volume (Green)
Sell Volume (Red)
Delta (Color-coded)
🔢 Indian Number Format (K = Thousands, L = Lakhs, Cr = Crores).
🧠 Fully auto-calculated — no need for tick-by-tick bid/ask feed.
📍 Neatly placed bottom-right table, customizable number of rows.
🛠️ Inputs:
Show Table: Toggle the table on/off
Number of Bars to Show: Choose how many recent candles to include (5–50)
🎯 Use Cases:
Identify hidden buyer/seller strength
Detect volume absorption or exhaustion
✅ Compatibility:
Works on any timeframe
Ideal for intraday instruments like NIFTY, BANKNIFTY, etc.
Ideal for volume-based strategy confirmation.
🖋️ Developed by:
GSK-VIZAG-AP-INDIA

Awesome Indicator# Moving Average Ribbon with ADR% - Complete Trading Indicator
## Overview
The **Moving Average Ribbon with ADR%** is a comprehensive technical analysis indicator that combines multiple analytical tools to provide traders with a complete picture of price trends, volatility, relative performance, and position sizing guidance. This multi-faceted indicator is designed for both swing and positional traders looking for data-driven entry and exit signals.
## Key Components
### 1. Moving Average Ribbon System
- **4 Customizable Moving Averages** with default periods: 13, 21, 55, and 189
- **Multiple MA Types**: SMA, EMA, SMMA (RMA), WMA, VWMA
- **Color-coded visualization** for easy trend identification
- **Flexible configuration** allowing users to modify periods, types, and colors
### 2. Average Daily Range Percentage (ADR%)
- Calculates the average daily volatility as a percentage
- Uses a 20-period simple moving average of (High/Low - 1) * 100
- Helps traders understand the stock's typical daily movement range
- Essential for position sizing and stop-loss placement
### 3. Volume Analysis (Up/Down Ratio)
- Analyzes volume distribution over the last 55 periods
- Calculates the ratio of volume on up days vs down days
- Provides insight into buying vs selling pressure
- Values > 1 indicate more buying volume, < 1 indicate more selling volume
### 4. Absolute Relative Strength (ARS)
- **Dual timeframe analysis** with customizable reference points
- **High ARS**: Performance relative to benchmark from a high reference point (default: Sep 27, 2024)
- **Low ARS**: Performance relative to benchmark from a low reference point (default: Apr 7, 2025)
- Uses NSE:NIFTY as default comparison symbol
- Color-coded display: Green for outperformance, Red for underperformance
### 5. Relative Performance Table
- **5 timeframes**: 1 Week, 1 Month, 3 Months, 6 Months, 1 Year
- Shows stock performance **relative to benchmark index**
- Formula: (Stock Return - Index Return) for each period
- **Color coding**:
- Lime: >5% outperformance
- Yellow: -5% to +5% relative performance
- Red: <-5% underperformance
### 6. Dynamic Position Allocation System
- **6-factor scoring system** based on price vs EMAs (21, 55, 189)
- Evaluates:
- Price above/below each EMA
- EMA alignment (21>55, 55>189, 21>189)
- **Allocation recommendations**:
- 100% allocation: Score = 6 (all bullish signals)
- 75% allocation: Score = 4
- 50% allocation: Score = 2
- 25% allocation: Score = 0
- 0% allocation: Score = -2, -4, -6 (bearish signals)
## Display Tables
### Performance Table (Top Right)
Shows relative performance vs benchmark across multiple timeframes with intuitive color coding for quick assessment.
### Metrics Table (Bottom Right)
Displays key statistics:
- **ADR%**: Average Daily Range percentage
- **U/D**: Up/Down volume ratio
- **Allocation%**: Recommended position size
- **High ARS%**: Relative strength from high reference
- **Low ARS%**: Relative strength from low reference
## How to Use This Indicator
### For Trend Analysis
1. **Moving Average Ribbon**: Look for price above ascending MAs for bullish trends
2. **MA Alignment**: Bullish when shorter MAs are above longer MAs
3. **Color coordination**: Use consistent color scheme for quick visual analysis
### For Entry/Exit Timing
1. **Performance Table**: Enter when showing consistent outperformance across timeframes
2. **Volume Analysis**: Confirm entries with U/D ratio > 1.5 for strong buying
3. **ARS Values**: Look for positive ARS readings for relative strength confirmation
### For Position Sizing
1. **Allocation System**: Use the recommended allocation percentage
2. **ADR% Consideration**: Adjust position size based on volatility
3. **Risk Management**: Lower allocation in high ADR% stocks
### For Risk Management
1. **ADR% for Stop Loss**: Set stops at 1-2x ADR% below entry
2. **Relative Performance**: Reduce positions when consistently underperforming
3. **Volume Confirmation**: Be cautious when U/D ratio deteriorates
## Best Practices
### Timeframe Recommendations
- **Intraday**: Use lower MA periods (5, 13, 21, 55)
- **Swing Trading**: Default settings work well (13, 21, 55, 189)
- **Position Trading**: Consider higher periods (21, 50, 100, 200)
### Market Conditions
- **Trending Markets**: Focus on MA alignment and relative performance
- **Sideways Markets**: Rely more on ADR% for range trading
- **Volatile Markets**: Reduce allocation percentage regardless of signals
### Customization Tips
1. Adjust reference dates for ARS calculation based on significant market events
2. Change comparison symbol to sector-specific indices for better relative analysis
3. Modify MA periods based on your trading style and market characteristics
## Technical Specifications
- **Version**: Pine Script v6
- **Overlay**: Yes (plots on price chart)
- **Real-time Updates**: Yes
- **Data Requirements**: Minimum 252 bars for complete calculations
- **Compatible Timeframes**: All standard timeframes
## Limitations
- Performance calculations require sufficient historical data
- ARS calculations depend on selected reference dates
- Volume analysis may be less reliable in low-volume stocks
- Relative performance is only as good as the chosen benchmark
This indicator is designed to provide a comprehensive analysis framework rather than simple buy/sell signals. It's recommended to use this in conjunction with your overall trading strategy and risk management rules.

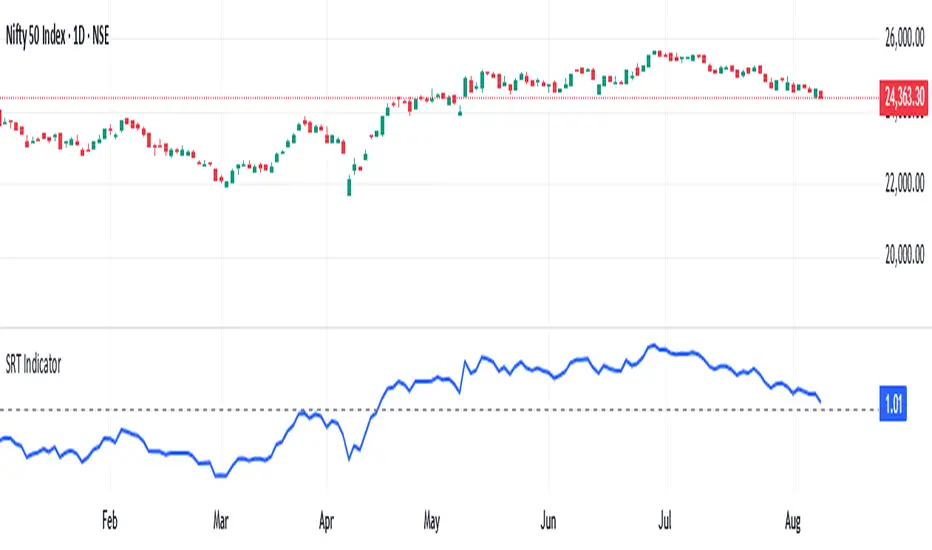
SRT Indicatorthis indicator simply plots the value of SRT below the chart. it is current spot price of nifty divided by its 124 daily SMA. typically one invests when srt is 0.7 to 0.9 and exits when it crosses 1.25. this can be adjusted according to our risk appetite.
Institutional Momentum Zones (ADX+ROC+DI+MACD+Filters)Institutional Momentum Zones (ADX + ROC + DI + MACD + Filters)
This indicator is designed to help traders visually identify Bullish, Neutral, and Bearish momentum zones on Nifty, indices, or any liquid asset, using a rules-based, institutional-style approach.
It combines multiple professional-grade momentum and trend filters into a single framework:
ADX (Average Directional Index) – Measures trend strength, filters out choppy conditions.
Directional Indicators (+DI / –DI) – Confirms whether bulls or bears are in control.
ROC (Rate of Change) – Quantifies momentum speed and direction.
MACD (optional) – Adds confirmation by checking multi-timeframe momentum alignment.
EMA Filters (optional) – Ensures price is in alignment with long-term trend bias.
Supertrend (optional) – Can be enabled for additional trend confirmation.
How it works:
Bullish Zone (Green) → Strong trend (ADX > threshold) + upward momentum (ROC > 0, +DI > –DI) + optional EMA/MACD/Supertrend confirmation.
Bearish Zone (Red) → Strong trend (ADX > threshold) + downward momentum (ROC < 0, –DI > +DI) + optional EMA/MACD/Supertrend confirmation.
Neutral Zone (Yellow) → Low trend strength (ADX < threshold) or mixed momentum signals.
Features:
Automatic background coloring for zone detection.
On-chart labels marking new zone changes.
EMA50 / EMA200 and Supertrend overlay options.
Signal markers for bullish/bearish entries.
Info panel with live ADX, ROC, DI values, and MACD histogram.
Alert conditions for zone changes (Bull, Bear, Neutral).
Best used for:
Index momentum tracking (e.g., Nifty, Bank Nifty, Dow, S&P500)
Swing trading & positional trading strategies
Filtering trades to avoid entering during low-momentum chop
Tip: For Nifty positional trading, use Daily or 4H charts with EMA & MACD filters enabled for cleaner, high-confidence signals.

AshishBediSPLAshishBediSPL: Dynamic Premium Analysis with Integrated Signals
This indicator provides a comprehensive view of combined options premiums by aggregating data from Call and Put contracts for a selected index and expiry. It integrates multiple popular technical indicators like EMA Crossover, Supertrend, VWAP, RSI, and SMA, allowing users to select their preferred tools for generating dynamic buy and sell signals directly on the premium chart.
AshishBediSPL" is a powerful TradingView indicator designed to analyze options premiums. It calculates a real-time combined premium for a chosen index (NIFTY, BANKNIFTY, FINNIFTY, etc.) and specific expiry date. You have the flexibility to visualize the premium of Call options, Put options, or a combined premium of both.
The indicator then overlays several popular technical analysis tools, which you can selectively enable:
EMA Crossover: Identify trend changes with configurable fast and slow Exponential Moving Averages.
Supertrend: Detect trend direction and potential reversal points.
VWAP (Volume Weighted Average Price): Understand the average price of the premium considering trading volume.
RSI (Relative Strength Index): Gauge momentum and identify overbought/oversold conditions.
SMA (Simple Moving Average): Analyze price smoothing and trend identification.
Based on your selected indicators, the tool generates clear "Buy" and "Sell" signals directly on the chart, helping you identify potential entry and exit points. Customizable alerts are also available to keep you informed.
Unlock a new perspective on options trading with "AshishBediSPL." This indicator focuses on the combined value of options premiums, giving you a consolidated view of market sentiment for a chosen index and expiry.
Instead of just looking at individual option prices, "AshishBediSPL" blends the Call and Put premiums (or focuses on one, based on your preference) and empowers you with a suite of built-in technical indicators: EMA, Supertrend, VWAP, RSI, and SMA. Pick the indicators that resonate with your strategy, and let the tool generate actionable buy and sell signals right on your chart. With customizable alerts, you'll never miss a crucial market move. Gain deeper insights and make more informed trading decisions with "AshishBediSPL.
Combined options premium: This accurately describes what your indicator calculates.
Selected index and expiry: Essential inputs for the indicator.
Call/Put options or combined: Explains the flexibility in data display.
Multiple technical indicators (EMA Crossover, Supertrend, VWAP, RSI, SMA): Lists the analysis tools included.
Buy/Sell signals: The primary output of the indicator.
Customizable alerts: A valuable feature for users.

Previous Day Liquidity ZonesThis indicator is designed for intraday liquidity-based trading strategies and helps traders identify high-probability reversal or breakout zones based on smart money concepts.
It automatically plots the:
🟥 Previous Day High Zone – potential buy-side liquidity trap
🟩 Previous Day Low Zone – potential sell-side liquidity trap
🟧 Previous Day Close Zone – potential rebalancing or indecision zone
These levels are critical areas where institutional stop-hunting, reversals, and fake breakouts often occur.
🎯 How to Use
Use this indicator on 1-minute or 5-minute charts for stocks, indices (like NIFTY, BANKNIFTY), or forex.
Watch for price entering these zones during live market hours.
Combine with price action confirmation:
Rejection wicks
Engulfing candles
Change of character (CHoCH) or BOS
Fair Value Gaps (FVG)
First 5-minute candle (9:15 AM in Indian market) is highlighted for breakout setups.
🧠 Smart Money Logic
These zones mimic the logic used by institutions to:
Trigger retail stop-losses
Reverse market direction near liquidity pools
Trap breakout traders around session extremes
⚙️ Features
Configurable zone width (%)
Visual fill zones with subtle shading
Support for all assets and timeframes
Highlights first candle of day to assist with pre-trade bias
✅ Ideal For:
Smart money traders
ICT / Wyckoff / SMC followers
Breakout trap or reversal strategy users
Anyone who trades key session levels
⚠️ Disclaimer
This is an informational tool. Always use confirmation and sound risk management before executing any trade.

RSI + VWAP Strategy by vipindaskr🔍 This script combines RSI and VWAP for intraday trend-based entries.
✅ *Buy Signal:*
- Price above VWAP
- RSI > 60
- Green background + up triangle shown
❌ *Sell Signal:*
- Price below VWAP
- RSI < 40
- Red background + down triangle shown
📈 Ideal for Nifty 50 intraday traders using 5-minute chart.
Developed by vipindaskr 💻
