Harmonic Patterns Library [TradingFinder]🔵 Introduction
Harmonic patterns blend geometric shapes with Fibonacci numbers, making these numbers fundamental to understanding the patterns.
One person who has done a lot of research on harmonic patterns is Scott Carney.Scott Carney's research on harmonic patterns in technical analysis focuses on precise price structures based on Fibonacci ratios to identify market reversals.
Key patterns include the Gartley, Bat, Butterfly, and Crab, each with specific alignment criteria. These patterns help traders anticipate potential market turning points and make informed trading decisions, enhancing the predictability of technical analysis.
🟣 Understanding 5-Point Harmonic Patterns
In the current library version, you can easily draw and customize most XABCD patterns. These patterns often form M or W shapes, or a combination of both. By calculating the Fibonacci ratios between key points, you can estimate potential price movements.
All five-point patterns share a similar structure, differing only in line lengths and Fibonacci ratios. Learning one pattern simplifies understanding others.
🟣 Exploring the Gartley Pattern
The Gartley pattern appears in both bullish (M shape) and bearish (W shape) forms. In the bullish Gartley, point X is below point D, and point A surpasses point C. Point D marks the start of a strong upward trend, making it an optimal point to place a buy order.
The bearish Gartley mirrors the bullish pattern with inverted Fibonacci ratios. In this scenario, point D indicates the start of a significant price drop. Traders can place sell orders at this point and buy at lower prices for profit in two-way markets.
🟣 Analyzing the Butterfly Pattern
The Butterfly pattern also manifests in bullish (M shape) and bearish (W shape) forms. It resembles the Gartley pattern but with point D lower than point X in the bullish version.
The Butterfly pattern involves deeper price corrections than the Gartley, leading to more significant price fluctuations. Point D in the bullish Butterfly indicates the beginning of a sharp price rise, making it an entry point for buy orders.
The bearish Butterfly has inverted Fibonacci ratios, with point D marking the start of a sharp price decline, ideal for sell orders followed by buying at lower prices in two-way markets.
🟣 Insights into the Bat Pattern
The Bat pattern, appearing in bullish (M shape) and bearish (W shape) forms, is one of the most precise harmonic patterns. It closely resembles the Butterfly and Gartley patterns, differing mainly in Fibonacci levels.
The bearish Bat pattern shares the Fibonacci ratios with the bullish Bat, with an inverted structure. Point D in the bearish Bat marks the start of a significant price drop, suitable for sell orders followed by buying at lower prices for profit.
🟣 The Crab Pattern Explained
The Crab pattern, found in both bullish (M shape) and bearish (W shape) forms, is highly favored by analysts. Discovered in 2000, the Crab pattern features a larger final wave correction compared to other harmonic patterns.
The bearish Crab shares Fibonacci ratios with the bullish version but in an inverted form. Point D in the bearish Crab signifies the start of a sharp price decline, making it an ideal point for sell orders followed by buying at lower prices for profitable trades.
🟣 Understanding the Shark Pattern
The Shark pattern appears in bullish (M shape) and bearish (W shape) forms. It differs from previous patterns as point C in the bullish Shark surpasses point A, with unique level measurements.
The bearish Shark pattern mirrors the Fibonacci ratios of the bullish Shark but is inverted. Point D in the bearish Shark indicates the start of a sharp price drop, ideal for placing sell orders and buying at lower prices to capitalize on the pattern.
🟣 The Cypher Pattern Overview
The Cypher pattern is another that appears in both bullish (M shape) and bearish (W shape) forms. It resembles the Shark pattern, with point C in the bullish Cypher extending beyond point A, and point D forming within the XA line.
The bearish Cypher shares the Fibonacci ratios with the bullish Cypher but in an inverted structure. Point D in the bearish Cypher marks the start of a significant price drop, perfect for sell orders followed by buying at lower prices.
🟣 Introducing the Nen-Star Pattern
The Nen-Star pattern appears in both bullish (M shape) and bearish (W shape) forms. In the bullish Nen-Star, point C extends beyond point A, and point D, the final point, forms outside the XA line, making CD the longest wave.
The bearish Nen-Star has inverted Fibonacci ratios, with point D indicating the start of a significant price drop. Traders can place sell orders at point D and buy at lower prices to profit from this pattern in two-way markets.
The 5-point harmonic patterns, commonly referred to as XABCD patterns, are specific geometric price structures identified in financial markets. These patterns are used by traders to predict potential price movements based on historical price data and Fibonacci retracement levels.
Here are the main 5-point harmonic patterns :
Gartley Pattern
Anti-Gartley Pattern
Bat Pattern
Anti-Bat Pattern
Alternate Bat Pattern
Butterfly Pattern
Anti-Butterfly Pattern
Crab Pattern
Anti-Crab Pattern
Deep Crab Pattern
Shark Pattern
Anti- Shark Pattern
Anti Alternate Shark Pattern
Cypher Pattern
Anti-Cypher Pattern
🔵 How to Use
To add "Order Block Refiner Library", you must first add the following code to your script.
import TFlab/Harmonic_Chart_Pattern_Library_TradingFinder/1 as HP
🟣 Parameters
XABCD(Name, Type, Show, Color, LineWidth, LabelSize, ShVF, FLPC, FLPCPeriod, Pivot, ABXAmin, ABXAmax, BCABmin, BCABmax, CDBCmin, CDBCmax, CDXAmin, CDXAmax) =>
Parameters:
Name (string)
Type (string)
Show (bool)
Color (color)
LineWidth (int)
LabelSize (string)
ShVF (bool)
FLPC (bool)
FLPCPeriod (int)
Pivot (int)
ABXAmin (float)
ABXAmax (float)
BCABmin (float)
BCABmax (float)
CDBCmin (float)
CDBCmax (float)
CDXAmin (float)
CDXAmax (float)
🟣 Genaral Parameters
Name : The name of the pattern.
Type: Enter "Bullish" to draw a Bullish pattern and "Bearish" to draw an Bearish pattern.
Show : Enter "true" to display the template and "false" to not display the template.
Color : Enter the desired color to draw the pattern in this parameter.
LineWidth : You can enter the number 1 or numbers higher than one to adjust the thickness of the drawing lines. This number must be an integer and increases with increasing thickness.
LabelSize : You can adjust the size of the labels by using the "size.auto", "size.tiny", "size.smal", "size.normal", "size.large" or "size.huge" entries.
🟣 Logical Parameters
ShVF : If this parameter is on "true" mode, only patterns will be displayed that they have exact format and no noise can be seen in them. If "false" is, the patterns displayed that maybe are noisy and do not exactly correspond to the original pattern.
FLPC : if Turned on, you can see this ability of patterns when their last pivot is formed. If this feature is off, it will see the patterns as soon as they are formed. The advantage of this option being clear is less formation of fielded patterns, and it is accompanied by the lateest pattern seeing and a sharp reduction in reward to risk.
FLPCPeriod : Using this parameter you can determine that the last pivot is based on Pivot period.
Pivot : You need to determine the period of the zigzag indicator. This factor is the most important parameter in pattern recognition.
ABXAmin : Minimum retracement of "AB" line compared to "XA" line.
ABXAmax : Maximum retracement of "AB" line compared to "XA" line.
BCABmin : Minimum retracement of "BC" line compared to "AB" line.
BCABmax : Maximum retracement of "BC" line compared to "AB" line.
CDBCmin : Minimum retracement of "CD" line compared to "BC" line.
CDBCmax : Maximum retracement of "CD" line compared to "BC" line.
CDXAmin : Minimum retracement of "CD" line compared to "XA" line.
CDXAmax : Maximum retracement of "CD" line compared to "XA" line.
🟣 Function Outputs
This library has two outputs. The first output is related to the alert of the formation of a new pattern. And the second output is related to the formation of the candlestick pattern and you can draw it using the "plotshape" tool.
Candle Confirmation Logic :
Example :
import TFlab/Harmonic_Chart_Pattern_Library_TradingFinder/1 as HP
PP = input.int(3, 'ZigZag Pivot Period')
ShowBull = input.bool(true, 'Show Bullish Pattern')
ShowBear = input.bool(true, 'Show Bearish Pattern')
ColorBull = input.color(#0609bb, 'Color Bullish Pattern')
ColorBear = input.color(#0609bb, 'Color Bearish Pattern')
LineWidth = input.int(1 , 'Width Line')
LabelSize = input.string(size.small , 'Label size' , options = )
ShVF = input.bool(false , 'Show Valid Format')
FLPC = input.bool(false , 'Show Formation Last Pivot Confirm')
FLPCPeriod =input.int(2, 'Period of Formation Last Pivot')
//Call function
= HP.XABCD('Bullish Bat', 'Bullish', ShowBull, ColorBull , LineWidth, LabelSize ,ShVF, FLPC, FLPCPeriod, PP, 0.382, 0.50, 0.382, 0.886, 1.618, 2.618, 0.85, 0.9)
= HP.XABCD('Bearish Bat', 'Bearish', ShowBear, ColorBear , LineWidth, LabelSize ,ShVF, FLPC, FLPCPeriod, PP, 0.382, 0.50, 0.382, 0.886, 1.618, 2.618, 0.85, 0.9)
//Alert
if BearAlert
alert('Bearish Harmonic')
if BullAlert
alert('Bulish Harmonic')
//CandleStick Confirm
plotshape(BearCandleConfirm, style = shape.arrowdown, color = color.red)
plotshape(BullCandleConfirm, style = shape.arrowup, color = color.green, location = location.belowbar )
Tìm kiếm tập lệnh với "order"

3Commas BotBjorgum 3Commas Bot
A strategy in a box to get you started today
With 3rd party API providers growing in popularity, many are turning to automating their strategies on their favorite assets. With so many options and layers of customization possible, TradingView offers a place no better for young or even experienced coders to build a platform from to meet these needs. 3Commas has offered easy access with straight forward TradingView compatibility. Before long many have their brokers hooked up and are ready to send their alerts (or perhaps they have been trying with mixed success for some time now) only they realize there might just be a little bit more to building a strategy that they are comfortable letting out of their sight to trade their money while they eat, sleep, etc. Many may have ideas for entry criteria they are excited to try, but further questions arise... "What about risk mitigation?" "How can I set stop or limit orders?" "Is there not some basic shell of a strategy that has laid some of this out for me to get me going?"
Well now there is just that. This strategy is meant for those that have begun to delve into the world of algorithmic trading providing a template that offers risk defined positions complete with stops, limit orders, and even trailing stops should one so choose to employ any of these criteria. It provides a framework that is easily manipulated (with some basic working knowledge of pine coding) to encompass ones own ideas and entry criteria, while also providing an already functioning strategy.
The default settings have a basic 1:1 risk to reward ratio, which sets a limit and a stop equal distance from the entry. The entry is a simple MA cross (up for long, down for short). There a variety of MA's to choose from and the user can define the lengths of the averages. The ratio can be adjusted from the menu along with a volatility based adder (ATR) that helps to distance a stop from support or resistance. These values are calculated off the swing low/high of the user defined lookback period. Risk is calculated from position entry to stop, and projected upwards to the limit as a function of the desired risk to reward ratio. Of note: the default settings include 0.05% commissions. Competitive commissions of the leading cryptocurrency exchanges are .1% round trip (one buy and one sell) for market orders. There is also some slippage to allow time for alerts to be sent and orders to fill giving the back test results a more accurate representation of real time conditions. Its recommended to research the going rates for your exchange and set them to default for the strategy you use or build.
To get started a user would:
1) Make a copy of the code and paste in their bot keys in the area provided under the "3Comma Keys" section
- eg. Long bot "start deal" copied from 3commas in to define "Long" etc. (code is commented)
2) Place alert on desired asset with desired settings ensuring to select "Order fills and alert() function calls"
3) Paste webhook into the webhook box and select webhook URL alerts (3rd party provided webhook)
3) Delete contents of alert message box and replace with {{strategy.order.alert_message}} and nothing else
- the codes will be sent to the webhook appropriately as the strategy enters and exits positions. Only 1 alert is needed
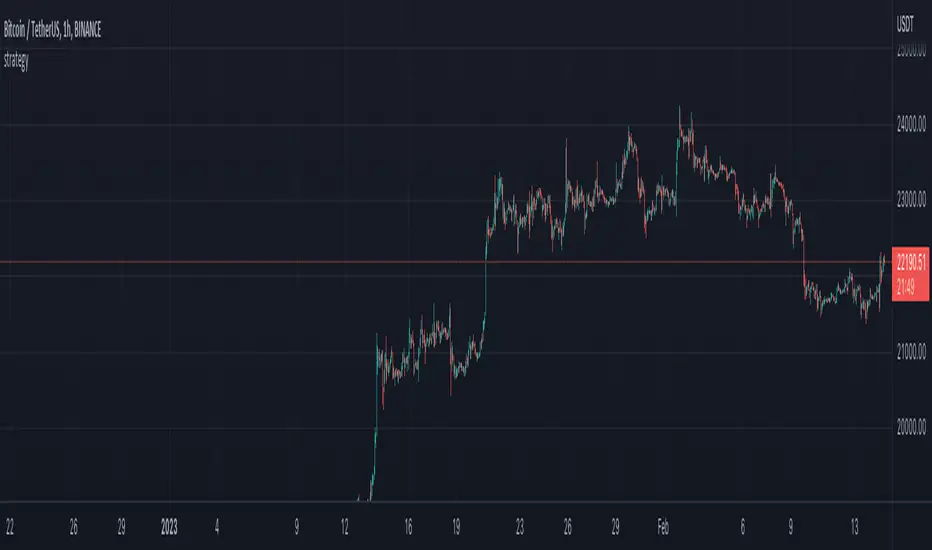
settings used for the display image:
1hr chart on BTCUSD
-ATR stop
-Risk adjustment 1.2
-ATR multiplier 1.3
-RnR 0.6
-MAs HEMA/SMA
-MA Length 50/100
-Order size percent of equity
-Trail trigger 60% of target
Experiment with your own settings on your crypto of choice or implement your own code!
Implementing your trailing stop (optional)
Among the options for possible settings is a trailing stop. This stop will ratchet higher once triggered as a function of the Average True Range (ATR). There is a variable level to choose where the user would like to begin trailing the stop during the trade. The level can be assigned with a decimal between 0 and 1 (eg. 0.5 = 50% of the distance between entry and the target which must be exceeded before the trail triggers to begin). This can allow for some dips to occur during the trade possibly keeping you in the trade for longer, while potentially reducing risk of drawdown over time. The default for this setting is 0 meaning unless adjusted, the trail will trigger on entry if the trailing stop exit method is selected. An example can be seen below:
Again, optional as well is the choice to implement a limit order. If one were to select a trailing stop they could choose not to set a limit, which could allow a trail to run further until hit. Drawdowns of this strategy would be foregoing locking gains at highs on target on other trades. This is a trade-off the user can decide on and test. An example of this working in favor can be observed below:
Conclusion
Although a simple strategy is implemented here, the benefits of this script allow a user a starting platform to build their strategies from with built in risk mitigation. This allows the user to sidestep some of the potential difficulties' that can arise while learning Pine and taking on the endeavor of automating their trading strategies. It is meant as an aid, a structure, and an educational piece that can be seen as a "pick-up-and-go" strategy with easy 3Commas compatibility. Additionally, this can help users become more comfortable with strategy alert messages and sending strings in the form of alerts from Pine. As well, FAQs are often littered with questions regarding "strategy.exit" calls, how to implement stops. how to properly set a trailing stop based on ATR, and more. The time this can save an individual to get started is likely of the best "take-aways" here.
Happy trading

scaled.orders [highwater]FOR EDUCATIONAL PURPOSES
There are multiple tools that allow you to place "scaled orders" on your exchange, namely Alertatron and Bybit Tools. This script is based on some Alertatron features, but you can use it for any grid like order placing strategy. Even if thats not your thing it's an example of how to use arrays in pinescript.
FROM PRICE - is the price to start your orders.
TO PRICE - is the price your orders will end.
SCALED TYPES :
LINEAR - will distribute orders evenly between from and to price.
EASE IN - will cluster orders closer to from price, then start to widen the gaps as you move closer to to price.
EASE OUT - will have wider gaps near from price, and start to cluster near to price.
EASE IN OUT - will cluster orders near both from price and to price.
COUNT - number of orders in each scaled order.

Pivot Candles with MFI Opacity (No Plot)How to Use the Pivot Candles with MFI Opacity Indicator for Trade Entries and Position Management
Overview
This indicator is designed not only to display key pivot levels (support and resistance) and Money Flow Index (MFI) signals on your chart, but also to help you structure systematic order entries and position management. By combining pivot levels with dynamic MFI-based candle opacity, the indicator provides a visual framework that technical analysts and quants can use to time buy and sell stop orders as well as to pyramid positions or take profits.
Trade Entry with Pivot Levels
Buy Stop Orders Above R1:
Concept: In many technical setups, resistance levels such as R1 are viewed as potential breakout points. A buy stop order placed just above R1 allows you to enter a long position only when price decisively breaks the prior resistance, confirming bullish momentum.
How It Works:
The indicator calculates pivot levels based on the previous higher‑timeframe bar, so R1 is “locked in” for the current period.
When the current candle closes above R1, it may signal a breakout.
Technical analysts often place a buy stop order slightly above R1 (for example, a few ticks or pips above the level) to confirm the move.
Practical Application:
Quants and systematic traders can program their models to monitor when the current close exceeds R1.
Once this condition is met, a buy stop order is triggered to capture the breakout move, ensuring that you only participate if the price decisively moves upward.
Sell Stop Orders Below S1:
Concept: Conversely, S1 acts as a support level. A sell stop order placed just below S1 is designed to capture a breakdown. This order is activated when price closes below S1, indicating that selling pressure may be overwhelming.
How It Works:
With pivot levels fixed from the previous higher‑timeframe bar, S1 provides a reference for potential support.
A close below S1 can be interpreted as a sign of a bearish reversal or a continuation of a downtrend.
Practical Application:
Quants set up their systems to watch for a break below S1.
A sell stop order is positioned just below S1 to ensure that if the support level fails, the system can quickly initiate a short position to capture the downward move.
Using MFI for Position Management
Pyramiding and Profit Taking:
Dynamic Candle Opacity:
The Money Flow Index (MFI) in this indicator not only provides overbought/oversold alerts but also controls the opacity of your candlesticks. When MFI readings are high, the candles become more opaque, indicating strong buying pressure. Conversely, lower MFI values lead to more transparent candles, suggesting reduced momentum.
Pyramiding Long Positions:
Strategy:
In a strong trend, technical analysts might choose to add to a winning position gradually—a process known as pyramiding.
Implementation:
As long as the price remains above R1 and MFI readings are supportive (high and consistent), you may consider adding to your long position incrementally.
Each new buy stop order can be set above R1 with slightly adjusted trigger levels to capture further breakout strength.
Risk Management:
Quants use the MFI reading as a risk filter; if MFI begins to drop or the candles become significantly more transparent, it may be a cue to stop pyramiding or even begin taking profits.
Taking Profit Using MFI and Pivot Reversals:
Profit Targeting:
When price reaches higher resistance levels (e.g., R2 or R3) or shows signs of overextension in conjunction with extreme MFI levels (for instance, a sudden drop in MFI after a strong rally), you can begin taking partial profits.
Systematic Exit:
A systematic strategy might include scaling out of the position as the price approaches the next resistance level or when the MFI indicates that buying momentum is waning.
Similarly, for short positions entered below S1, profit targets might be set near subsequent support levels, with exits triggered if MFI suggests a reversal.
Summary
Entry Orders:
Place buy stop orders just above R1 to capture breakouts.
Place sell stop orders just below S1 to capture breakdowns.
Position Management with MFI:
Use MFI-based candle opacity as a visual indicator of momentum.
Pyramid positions in the direction of the trend when MFI confirms strength.
Consider partial exits if MFI readings start to reverse or if the price nears the next pivot level.
By following this systematic approach, technical analysts and quants can use the indicator not only as a visual tool but as an integral part of an automated or semi-automated trading system that emphasizes disciplined entries, pyramiding, and profit-taking.

BBSS+This Pine Script implements a custom indicator overlaying Bollinger Bands with additional features for trend analysis using Exponential Moving Averages (EMAs). Here's a breakdown of its functionality:
Bollinger Bands:
The script calculates the Bollinger Bands using a 20-period Simple Moving Average (SMA) as the basis and a multiplier of 2 for the standard deviation.
It plots the Upper Band and Lower Band in red.
EMA Calculations:
Three EMAs are calculated for the close price with periods of 5, 10, and 40.
The EMAs are plotted in green (5-period), cyan (10-period), and orange (40-period) to distinguish between them.
Trend Detection:
The script determines bullish or bearish EMA alignments:
Bullish Order: EMA 5 > EMA 10 > EMA 40.
Bearish Order: EMA 5 < EMA 10 < EMA 40.
Entry Signals:
Long Entry: Triggered when:
The close price crosses above the Upper Bollinger Band.
The Upper Band is above its 5-period SMA (indicating momentum).
The EMAs are in a bullish order.
Short Entry: Triggered when:
The close price crosses below the Lower Bollinger Band.
The Lower Band is below its 5-period SMA.
The EMAs are in a bearish order.
Trend State Tracking:
A variable tracks whether the market is in a Long or Short trend based on conditions:
A Long trend continues unless conditions for a Short Entry are met or the Upper Band dips below its average.
A Short trend continues unless conditions for a Long Entry are met or the Lower Band rises above its average.
Visual Aids:
Signal Shapes:
Triangle-up shapes indicate Long Entry points below the bar.
Triangle-down shapes indicate Short Entry points above the bar.
Bar Colors:
Green bars indicate a Long trend.
Red bars indicate a Short trend.
This script combines Bollinger Bands with EMA crossovers to generate entry signals and visualize market trends, making it a versatile tool for identifying momentum and trend reversals.

Bondar Drive v2.1Title: Bondar Drive v2.1 — Real-time print and delta tick volume visualization
Description:
Bondar Drive v2.1 is a tool for visualizing real-time order flow data. It highlights price movements and volume deltas in an intuitive, easy-to-read format. Indicator can be used in conjunction with the Anchored Volume Profile and Volume Footprint (Type: Total).
Features:
Real-Time Print Visualization:
Displays order flow prints with delta colors for buy/sell dominance.
Adjustable size and transparency for varying order thresholds.
Volume Delta Analysis:
Categorizes orders into Tiny, Small, Session, Large, and Huge based on user-defined thresholds.
Provides a tooltip showing order time and price.
Customizable Time Range:
Keeps prints visible for a specified duration (in seconds).
Flexible User Inputs:
Adjustable time zones, print sizes, starting bar index, and volume thresholds.
Visual Enhancements:
Line connections between prints show progression of orders and market direction.
How It Works:
The indicator gathers volume delta and price data in real time.
It dynamically displays circular labels with varying sizes and colors, reflecting the size and type of orders. Labels and lines are automatically removed after the specified time range, ensuring a clean and uncluttered chart.
Customization Options:
Number of Prints: Control how many prints are displayed.
Order Size Filters: Exclude small trades to highlight significant orders.
Color Options: Customize print colors, text, and connecting lines.
Time Offset: Adjust for your local time zone.
Use Cases:
Identify order flow imbalances and price levels dominated by buyers or sellers.
Track the progression of large orders for better trade execution.
Spot market reversals and momentum shifts using real-time prints and delta.

[SGM Ordinal Patterns]An ordinal pattern is a concept used in mathematics and time series analysis. It is a way of describing the relative order of values in a sequence. Rather than focusing on the exact values, we are interested in how they compare to each other.
An ordinal pattern will tell you how these values are positioned relative to each other.
We do not look at the exact values, but only their order.
Concrete Example
• 4 (position 1 in the original sequence) is in position 2 in the ordered sequence.
• 7 (position 2 in the original sequence) is in position 3 in the ordered sequence.
• 2 (position 3 in the original sequence) is in position 1 in the ordered sequence.
The ordinal pattern for this sequence is then (2,3,1)(2, 3, 1)(2,3,1).
Script Explanation
This script analyzes ordinal patterns based on the closing prices of the last three bars and calculates the future gains associated with each ordinal pattern.
The main elements of the script are:
1. ordinal_pattern Function:
o Determines the ordinal pattern based on three past closing values.
o Returns an index (from 0 to 5) corresponding to one of the six possible ordinal patterns.
2. Calculations and Storage:
o For each new bar, the last three closes are used to identify the ordinal pattern.
o Future gains are calculated and associated with the previous ordinal pattern.
o Return statistics (mean, standard deviation and Sharpe ratio) are calculated for each pattern.
3. Visualization:
o Draws lines connecting the last three closes.
o Tables displaying the number of occurrences, distributions, and return statistics for each ordinal pattern.
What the Script Shows:
• Table motifs_table : Number of occurrences and distribution of each ordinal pattern. An uneven distribution between patterns (different by one sixth for each pattern) can indicate market inefficiency.
• Table pattern_analysis : Analysis of returns (mean, standard deviation, Sharpe ratio) for each ordinal pattern.
• Table current_motif_table : Ordinal pattern of the last bar.
This script helps to understand and visualize how ordinal patterns influence future returns of financial asset prices. An uneven distribution of patterns can indicate market inefficiencies.

CNTLibraryLibrary "CNTLibrary"
Custom Functions To Help Code In Pinescript V5
Coded By Christian Nataliano
First Coded In 10/06/2023
Last Edited In 22/06/2023
Huge Shout Out To © ZenAndTheArtOfTrading and his ZenLibrary V5, Some Of The Custom Functions Were Heavily Inspired By Matt's Work & His Pine Script Mastery Course
Another Shout Out To The TradingView's Team Library ta V5
//====================================================================================================================================================
// Custom Indicator Functions
//====================================================================================================================================================
GetKAMA(KAMA_lenght, Fast_KAMA, Slow_KAMA)
Calculates An Adaptive Moving Average Based On Perry J Kaufman's Calculations
Parameters:
KAMA_lenght (int) : Is The KAMA Lenght
Fast_KAMA (int) : Is The KAMA's Fastes Moving Average
Slow_KAMA (int) : Is The KAMA's Slowest Moving Average
Returns: Float Of The KAMA's Current Calculations
GetMovingAverage(Source, Lenght, Type)
Get Custom Moving Averages Values
Parameters:
Source (float) : Of The Moving Average, Defval = close
Lenght (simple int) : Of The Moving Average, Defval = 50
Type (string) : Of The Moving Average, Defval = Exponential Moving Average
Returns: The Moving Average Calculation Based On Its Given Source, Lenght & Calculation Type (Please Call Function On Global Scope)
GetDecimals()
Calculates how many decimals are on the quote price of the current market © ZenAndTheArtOfTrading
Returns: The current decimal places on the market quote price
Truncate(number, decimalPlaces)
Truncates (cuts) excess decimal places © ZenAndTheArtOfTrading
Parameters:
number (float)
decimalPlaces (simple float)
Returns: The given number truncated to the given decimalPlaces
ToWhole(number)
Converts pips into whole numbers © ZenAndTheArtOfTrading
Parameters:
number (float)
Returns: The converted number
ToPips(number)
Converts whole numbers back into pips © ZenAndTheArtOfTrading
Parameters:
number (float)
Returns: The converted number
GetPctChange(value1, value2, lookback)
Gets the percentage change between 2 float values over a given lookback period © ZenAndTheArtOfTrading
Parameters:
value1 (float)
value2 (float)
lookback (int)
BarsAboveMA(lookback, ma)
Counts how many candles are above the MA © ZenAndTheArtOfTrading
Parameters:
lookback (int)
ma (float)
Returns: The bar count of how many recent bars are above the MA
BarsBelowMA(lookback, ma)
Counts how many candles are below the MA © ZenAndTheArtOfTrading
Parameters:
lookback (int)
ma (float)
Returns: The bar count of how many recent bars are below the EMA
BarsCrossedMA(lookback, ma)
Counts how many times the EMA was crossed recently © ZenAndTheArtOfTrading
Parameters:
lookback (int)
ma (float)
Returns: The bar count of how many times price recently crossed the EMA
GetPullbackBarCount(lookback, direction)
Counts how many green & red bars have printed recently (ie. pullback count) © ZenAndTheArtOfTrading
Parameters:
lookback (int)
direction (int)
Returns: The bar count of how many candles have retraced over the given lookback & direction
GetSwingHigh(Lookback, SwingType)
Check If Price Has Made A Recent Swing High
Parameters:
Lookback (int) : Is For The Swing High Lookback Period, Defval = 7
SwingType (int) : Is For The Swing High Type Of Identification, Defval = 1
Returns: A Bool - True If Price Has Made A Recent Swing High
GetSwingLow(Lookback, SwingType)
Check If Price Has Made A Recent Swing Low
Parameters:
Lookback (int) : Is For The Swing Low Lookback Period, Defval = 7
SwingType (int) : Is For The Swing Low Type Of Identification, Defval = 1
Returns: A Bool - True If Price Has Made A Recent Swing Low
//====================================================================================================================================================
// Custom Risk Management Functions
//====================================================================================================================================================
CalculateStopLossLevel(OrderType, Entry, StopLoss)
Calculate StopLoss Level
Parameters:
OrderType (int) : Is To Determine A Long / Short Position, Defval = 1
Entry (float) : Is The Entry Level Of The Order, Defval = na
StopLoss (float) : Is The Custom StopLoss Distance, Defval = 2x ATR Below Close
Returns: Float - The StopLoss Level In Actual Price As A
CalculateStopLossDistance(OrderType, Entry, StopLoss)
Calculate StopLoss Distance In Pips
Parameters:
OrderType (int) : Is To Determine A Long / Short Position, Defval = 1
Entry (float) : Is The Entry Level Of The Order, NEED TO INPUT PARAM
StopLoss (float) : Level Based On Previous Calculation, NEED TO INPUT PARAM
Returns: Float - The StopLoss Value In Pips
CalculateTakeProfitLevel(OrderType, Entry, StopLossDistance, RiskReward)
Calculate TakeProfit Level
Parameters:
OrderType (int) : Is To Determine A Long / Short Position, Defval = 1
Entry (float) : Is The Entry Level Of The Order, Defval = na
StopLossDistance (float)
RiskReward (float)
Returns: Float - The TakeProfit Level In Actual Price
CalculateTakeProfitDistance(OrderType, Entry, TakeProfit)
Get TakeProfit Distance In Pips
Parameters:
OrderType (int) : Is To Determine A Long / Short Position, Defval = 1
Entry (float) : Is The Entry Level Of The Order, NEED TO INPUT PARAM
TakeProfit (float) : Level Based On Previous Calculation, NEED TO INPUT PARAM
Returns: Float - The TakeProfit Value In Pips
CalculateConversionCurrency(AccountCurrency, SymbolCurrency, BaseCurrency)
Get The Conversion Currecny Between Current Account Currency & Current Pair's Quoted Currency (FOR FOREX ONLY)
Parameters:
AccountCurrency (simple string) : Is For The Account Currency Used
SymbolCurrency (simple string) : Is For The Current Symbol Currency (Front Symbol)
BaseCurrency (simple string) : Is For The Current Symbol Base Currency (Back Symbol)
Returns: Tuple Of A Bollean (Convert The Currency ?) And A String (Converted Currency)
CalculateConversionRate(ConvertCurrency, ConversionRate)
Get The Conversion Rate Between Current Account Currency & Current Pair's Quoted Currency (FOR FOREX ONLY)
Parameters:
ConvertCurrency (bool) : Is To Check If The Current Symbol Needs To Be Converted Or Not
ConversionRate (float) : Is The Quoted Price Of The Conversion Currency (Input The request.security Function Here)
Returns: Float Price Of Conversion Rate (If In The Same Currency Than Return Value Will Be 1.0)
LotSize(LotSizeSimple, Balance, Risk, SLDistance, ConversionRate)
Get Current Lot Size
Parameters:
LotSizeSimple (bool) : Is To Toggle Lot Sizing Calculation (Simple Is Good Enough For Stocks & Crypto, Whilst Complex Is For Forex)
Balance (float) : Is For The Current Account Balance To Calculate The Lot Sizing Based Off
Risk (float) : Is For The Current Risk Per Trade To Calculate The Lot Sizing Based Off
SLDistance (float) : Is The Current Position StopLoss Distance From Its Entry Price
ConversionRate (float) : Is The Currency Conversion Rate (Used For Complex Lot Sizing Only)
Returns: Float - Position Size In Units
ToLots(Units)
Converts Units To Lots
Parameters:
Units (float) : Is For How Many Units Need To Be Converted Into Lots (Minimun 1000 Units)
Returns: Float - Position Size In Lots
ToUnits(Lots)
Converts Lots To Units
Parameters:
Lots (float) : Is For How Many Lots Need To Be Converted Into Units (Minimun 0.01 Units)
Returns: Int - Position Size In Units
ToLotsInUnits(Units)
Converts Units To Lots Than Back To Units
Parameters:
Units (float) : Is For How Many Units Need To Be Converted Into Lots (Minimun 1000 Units)
Returns: Float - Position Size In Lots That Were Rounded To Units
ATRTrail(OrderType, SourceType, ATRPeriod, ATRMultiplyer, SwingLookback)
Calculate ATR Trailing Stop
Parameters:
OrderType (int) : Is To Determine A Long / Short Position, Defval = 1
SourceType (int) : Is To Determine Where To Calculate The ATR Trailing From, Defval = close
ATRPeriod (simple int) : Is To Change Its ATR Period, Defval = 20
ATRMultiplyer (float) : Is To Change Its ATR Trailing Distance, Defval = 1
SwingLookback (int) : Is To Change Its Swing HiLo Lookback (Only From Source Type 5), Defval = 7
Returns: Float - Number Of The Current ATR Trailing
DangerZone(WinRate, AvgRRR, Filter)
Calculate Danger Zone Of A Given Strategy
Parameters:
WinRate (float) : Is The Strategy WinRate
AvgRRR (float) : Is The Strategy Avg RRR
Filter (float) : Is The Minimum Profit It Needs To Be Out Of BE Zone, Defval = 3
Returns: Int - Value, 1 If Out Of Danger Zone, 0 If BE, -1 If In Danger Zone
IsQuestionableTrades(TradeTP, TradeSL)
Checks For Questionable Trades (Which Are Trades That Its TP & SL Level Got Hit At The Same Candle)
Parameters:
TradeTP (float) : Is The Trade In Question Take Profit Level
TradeSL (float) : Is The Trade In Question Stop Loss Level
Returns: Bool - True If The Last Trade Was A "Questionable Trade"
//====================================================================================================================================================
// Custom Strategy Functions
//====================================================================================================================================================
OpenLong(EntryID, LotSize, LimitPrice, StopPrice, Comment, CommentValue)
Open A Long Order Based On The Given Params
Parameters:
EntryID (string) : Is The Trade Entry ID, Defval = "Long"
LotSize (float) : Is The Lot Size Of The Trade, Defval = 1
LimitPrice (float) : Is The Limit Order Price To Set The Order At, Defval = Na / Market Order Execution
StopPrice (float) : Is The Stop Order Price To Set The Order At, Defval = Na / Market Order Execution
Comment (string) : Is The Order Comment, Defval = Long Entry Order
CommentValue (string) : Is For Custom Values In The Order Comment, Defval = Na
Returns: Void
OpenShort(EntryID, LotSize, LimitPrice, StopPrice, Comment, CommentValue)
Open A Short Order Based On The Given Params
Parameters:
EntryID (string) : Is The Trade Entry ID, Defval = "Short"
LotSize (float) : Is The Lot Size Of The Trade, Defval = 1
LimitPrice (float) : Is The Limit Order Price To Set The Order At, Defval = Na / Market Order Execution
StopPrice (float) : Is The Stop Order Price To Set The Order At, Defval = Na / Market Order Execution
Comment (string) : Is The Order Comment, Defval = Short Entry Order
CommentValue (string) : Is For Custom Values In The Order Comment, Defval = Na
Returns: Void
TP_SLExit(FromID, TPLevel, SLLevel, PercentageClose, Comment, CommentValue)
Exits Based On Predetermined TP & SL Levels
Parameters:
FromID (string) : Is The Trade ID That The TP & SL Levels Be Palced
TPLevel (float) : Is The Take Profit Level
SLLevel (float) : Is The StopLoss Level
PercentageClose (float) : Is The Amount To Close The Order At (In Percentage) Defval = 100
Comment (string) : Is The Order Comment, Defval = Exit Order
CommentValue (string) : Is For Custom Values In The Order Comment, Defval = Na
Returns: Void
CloseLong(ExitID, PercentageClose, Comment, CommentValue, Instant)
Exits A Long Order Based On A Specified Condition
Parameters:
ExitID (string) : Is The Trade ID That Will Be Closed, Defval = "Long"
PercentageClose (float) : Is The Amount To Close The Order At (In Percentage) Defval = 100
Comment (string) : Is The Order Comment, Defval = Exit Order
CommentValue (string) : Is For Custom Values In The Order Comment, Defval = Na
Instant (bool) : Is For Exit Execution Type, Defval = false
Returns: Void
CloseShort(ExitID, PercentageClose, Comment, CommentValue, Instant)
Exits A Short Order Based On A Specified Condition
Parameters:
ExitID (string) : Is The Trade ID That Will Be Closed, Defval = "Short"
PercentageClose (float) : Is The Amount To Close The Order At (In Percentage) Defval = 100
Comment (string) : Is The Order Comment, Defval = Exit Order
CommentValue (string) : Is For Custom Values In The Order Comment, Defval = Na
Instant (bool) : Is For Exit Execution Type, Defval = false
Returns: Void
BrokerCheck(Broker)
Checks Traded Broker With Current Loaded Chart Broker
Parameters:
Broker (string) : Is The Current Broker That Is Traded
Returns: Bool - True If Current Traded Broker Is Same As Loaded Chart Broker
OpenPC(LicenseID, OrderType, UseLimit, LimitPrice, SymbolPrefix, Symbol, SymbolSuffix, Risk, SL, TP, OrderComment, Spread)
Compiles Given Parameters Into An Alert String Format To Open Trades Using Pine Connector
Parameters:
LicenseID (string) : Is The Users PineConnector LicenseID
OrderType (int) : Is The Desired OrderType To Open
UseLimit (bool) : Is If We Want To Enter The Position At Exactly The Previous Closing Price
LimitPrice (float) : Is The Limit Price Of The Trade (Only For Pending Orders)
SymbolPrefix (string) : Is The Current Symbol Prefix (If Any)
Symbol (string) : Is The Traded Symbol
SymbolSuffix (string) : Is The Current Symbol Suffix (If Any)
Risk (float) : Is The Trade Risk Per Trade / Fixed Lot Sizing
SL (float) : Is The Trade SL In Price / In Pips
TP (float) : Is The Trade TP In Price / In Pips
OrderComment (string) : Is The Executed Trade Comment
Spread (float) : is The Maximum Spread For Execution
Returns: String - Pine Connector Order Syntax Alert Message
ClosePC(LicenseID, OrderType, SymbolPrefix, Symbol, SymbolSuffix)
Compiles Given Parameters Into An Alert String Format To Close Trades Using Pine Connector
Parameters:
LicenseID (string) : Is The Users PineConnector LicenseID
OrderType (int) : Is The Desired OrderType To Close
SymbolPrefix (string) : Is The Current Symbol Prefix (If Any)
Symbol (string) : Is The Traded Symbol
SymbolSuffix (string) : Is The Current Symbol Suffix (If Any)
Returns: String - Pine Connector Order Syntax Alert Message
//====================================================================================================================================================
// Custom Backtesting Calculation Functions
//====================================================================================================================================================
CalculatePNL(EntryPrice, ExitPrice, LotSize, ConversionRate)
Calculates Trade PNL Based On Entry, Eixt & Lot Size
Parameters:
EntryPrice (float) : Is The Trade Entry
ExitPrice (float) : Is The Trade Exit
LotSize (float) : Is The Trade Sizing
ConversionRate (float) : Is The Currency Conversion Rate (Used For Complex Lot Sizing Only)
Returns: Float - The Current Trade PNL
UpdateBalance(PrevBalance, PNL)
Updates The Previous Ginve Balance To The Next PNL
Parameters:
PrevBalance (float) : Is The Previous Balance To Be Updated
PNL (float) : Is The Current Trade PNL To Be Added
Returns: Float - The Current Updated PNL
CalculateSlpComm(PNL, MaxRate)
Calculates Random Slippage & Commisions Fees Based On The Parameters
Parameters:
PNL (float) : Is The Current Trade PNL
MaxRate (float) : Is The Upper Limit (In Percentage) Of The Randomized Fee
Returns: Float - A Percentage Fee Of The Current Trade PNL
UpdateDD(MaxBalance, Balance)
Calculates & Updates The DD Based On Its Given Parameters
Parameters:
MaxBalance (float) : Is The Maximum Balance Ever Recorded
Balance (float) : Is The Current Account Balance
Returns: Float - The Current Strategy DD
CalculateWR(TotalTrades, LongID, ShortID)
Calculate The Total, Long & Short Trades Win Rate
Parameters:
TotalTrades (int) : Are The Current Total Trades That The Strategy Has Taken
LongID (string) : Is The Order ID Of The Long Trades Of The Strategy
ShortID (string) : Is The Order ID Of The Short Trades Of The Strategy
Returns: Tuple Of Long WR%, Short WR%, Total WR%, Total Winning Trades, Total Losing Trades, Total Long Trades & Total Short Trades
CalculateAvgRRR(WinTrades, LossTrades)
Calculates The Overall Strategy Avg Risk Reward Ratio
Parameters:
WinTrades (int) : Are The Strategy Winning Trades
LossTrades (int) : Are The Strategy Losing Trades
Returns: Float - The Average RRR Values
CAGR(StartTime, StartPrice, EndTime, EndPrice)
Calculates The CAGR Over The Given Time Period © TradingView
Parameters:
StartTime (int) : Is The Starting Time Of The Calculation
StartPrice (float) : Is The Starting Price Of The Calculation
EndTime (int) : Is The Ending Time Of The Calculation
EndPrice (float) : Is The Ending Price Of The Calculation
Returns: Float - The CAGR Values
//====================================================================================================================================================
// Custom Plot Functions
//====================================================================================================================================================
EditLabels(LabelID, X1, Y1, Text, Color, TextColor, EditCondition, DeleteCondition)
Edit / Delete Labels
Parameters:
LabelID (label) : Is The ID Of The Selected Label
X1 (int) : Is The X1 Coordinate IN BARINDEX Xloc
Y1 (float) : Is The Y1 Coordinate IN PRICE Yloc
Text (string) : Is The Text Than Wants To Be Written In The Label
Color (color) : Is The Color Value Change Of The Label Text
TextColor (color)
EditCondition (int) : Is The Edit Condition of The Line (Setting Location / Color)
DeleteCondition (bool) : Is The Delete Condition Of The Line If Ture Deletes The Prev Itteration Of The Line
Returns: Void
EditLine(LineID, X1, Y1, X2, Y2, Color, EditCondition, DeleteCondition)
Edit / Delete Lines
Parameters:
LineID (line) : Is The ID Of The Selected Line
X1 (int) : Is The X1 Coordinate IN BARINDEX Xloc
Y1 (float) : Is The Y1 Coordinate IN PRICE Yloc
X2 (int) : Is The X2 Coordinate IN BARINDEX Xloc
Y2 (float) : Is The Y2 Coordinate IN PRICE Yloc
Color (color) : Is The Color Value Change Of The Line
EditCondition (int) : Is The Edit Condition of The Line (Setting Location / Color)
DeleteCondition (bool) : Is The Delete Condition Of The Line If Ture Deletes The Prev Itteration Of The Line
Returns: Void
//====================================================================================================================================================
// Custom Display Functions (Using Tables)
//====================================================================================================================================================
FillTable(TableID, Column, Row, Title, Value, BgColor, TextColor, ToolTip)
Filling The Selected Table With The Inputed Information
Parameters:
TableID (table) : Is The Table ID That Wants To Be Edited
Column (int) : Is The Current Column Of The Table That Wants To Be Edited
Row (int) : Is The Current Row Of The Table That Wants To Be Edited
Title (string) : Is The String Title Of The Current Cell Table
Value (string) : Is The String Value Of The Current Cell Table
BgColor (color) : Is The Selected Color For The Current Table
TextColor (color) : Is The Selected Color For The Current Table
ToolTip (string) : Is The ToolTip Of The Current Cell In The Table
Returns: Void
DisplayBTResults(TableID, BgColor, TextColor, StartingBalance, Balance, DollarReturn, TotalPips, MaxDD)
Filling The Selected Table With The Inputed Information
Parameters:
TableID (table) : Is The Table ID That Wants To Be Edited
BgColor (color) : Is The Selected Color For The Current Table
TextColor (color) : Is The Selected Color For The Current Table
StartingBalance (float) : Is The Account Starting Balance
Balance (float)
DollarReturn (float) : Is The Account Dollar Reture
TotalPips (float) : Is The Total Pips Gained / loss
MaxDD (float) : Is The Maximum Drawdown Over The Backtesting Period
Returns: Void
DisplayBTResultsV2(TableID, BgColor, TextColor, TotalWR, QTCount, LongWR, ShortWR, InitialCapital, CumProfit, CumFee, AvgRRR, MaxDD, CAGR, MeanDD)
Filling The Selected Table With The Inputed Information
Parameters:
TableID (table) : Is The Table ID That Wants To Be Edited
BgColor (color) : Is The Selected Color For The Current Table
TextColor (color) : Is The Selected Color For The Current Table
TotalWR (float) : Is The Strategy Total WR In %
QTCount (int) : Is The Strategy Questionable Trades Count
LongWR (float) : Is The Strategy Total WR In %
ShortWR (float) : Is The Strategy Total WR In %
InitialCapital (float) : Is The Strategy Initial Starting Capital
CumProfit (float) : Is The Strategy Ending Cumulative Profit
CumFee (float) : Is The Strategy Ending Cumulative Fee (Based On Randomized Fee Assumptions)
AvgRRR (float) : Is The Strategy Average Risk Reward Ratio
MaxDD (float) : Is The Strategy Maximum DrawDown In Its Backtesting Period
CAGR (float) : Is The Strategy Compounded Average GRowth In %
MeanDD (float) : Is The Strategy Mean / Average Drawdown In The Backtesting Period
Returns: Void
//====================================================================================================================================================
// Custom Pattern Detection Functions
//====================================================================================================================================================
BullFib(priceLow, priceHigh, fibRatio)
Calculates A Bullish Fibonacci Value (From Swing Low To High) © ZenAndTheArtOfTrading
Parameters:
priceLow (float)
priceHigh (float)
fibRatio (float)
Returns: The Fibonacci Value Of The Given Ratio Between The Two Price Points
BearFib(priceLow, priceHigh, fibRatio)
Calculates A Bearish Fibonacci Value (From Swing High To Low) © ZenAndTheArtOfTrading
Parameters:
priceLow (float)
priceHigh (float)
fibRatio (float)
Returns: The Fibonacci Value Of The Given Ratio Between The Two Price Points
GetBodySize()
Gets The Current Candle Body Size IN POINTS © ZenAndTheArtOfTrading
Returns: The Current Candle Body Size IN POINTS
GetTopWickSize()
Gets The Current Candle Top Wick Size IN POINTS © ZenAndTheArtOfTrading
Returns: The Current Candle Top Wick Size IN POINTS
GetBottomWickSize()
Gets The Current Candle Bottom Wick Size IN POINTS © ZenAndTheArtOfTrading
Returns: The Current Candle Bottom Wick Size IN POINTS
GetBodyPercent()
Gets The Current Candle Body Size As A Percentage Of Its Entire Size Including Its Wicks © ZenAndTheArtOfTrading
Returns: The Current Candle Body Size IN PERCENTAGE
GetTopWickPercent()
Gets The Current Top Wick Size As A Percentage Of Its Entire Body Size
Returns: Float - The Current Candle Top Wick Size IN PERCENTAGE
GetBottomWickPercent()
Gets The Current Bottom Wick Size As A Percentage Of Its Entire Bodu Size
Returns: Float - The Current Candle Bottom Size IN PERCENTAGE
BullishEC(Allowance, RejectionWickSize, EngulfWick, NearSwings, SwingLookBack)
Checks If The Current Bar Is A Bullish Engulfing Candle
Parameters:
Allowance (int) : To Give Flexibility Of Engulfing Pattern Detection In Markets That Have Micro Gaps, Defval = 0
RejectionWickSize (float) : To Filter Out long (Upper And Lower) Wick From The Bullsih Engulfing Pattern, Defval = na
EngulfWick (bool) : To Specify If We Want The Pattern To Also Engulf Its Upper & Lower Previous Wicks, Defval = false
NearSwings (bool) : To Specify If We Want The Pattern To Be Near A Recent Swing Low, Defval = true
SwingLookBack (int) : To Specify How Many Bars Back To Detect A Recent Swing Low, Defval = 10
Returns: Bool - True If The Current Bar Matches The Requirements of a Bullish Engulfing Candle
BearishEC(Allowance, RejectionWickSize, EngulfWick, NearSwings, SwingLookBack)
Checks If The Current Bar Is A Bearish Engulfing Candle
Parameters:
Allowance (int) : To Give Flexibility Of Engulfing Pattern Detection In Markets That Have Micro Gaps, Defval = 0
RejectionWickSize (float) : To Filter Out long (Upper And Lower) Wick From The Bearish Engulfing Pattern, Defval = na
EngulfWick (bool) : To Specify If We Want The Pattern To Also Engulf Its Upper & Lower Previous Wicks, Defval = false
NearSwings (bool) : To Specify If We Want The Pattern To Be Near A Recent Swing High, Defval = true
SwingLookBack (int) : To Specify How Many Bars Back To Detect A Recent Swing High, Defval = 10
Returns: Bool - True If The Current Bar Matches The Requirements of a Bearish Engulfing Candle
Hammer(Fib, ColorMatch, NearSwings, SwingLookBack, ATRFilterCheck, ATRPeriod)
Checks If The Current Bar Is A Hammer Candle
Parameters:
Fib (float) : To Specify Which Fibonacci Ratio To Use When Determining The Hammer Candle, Defval = 0.382 Ratio
ColorMatch (bool) : To Filter Only Bullish Closed Hammer Candle Pattern, Defval = false
NearSwings (bool) : To Specify If We Want The Doji To Be Near A Recent Swing Low, Defval = true
SwingLookBack (int) : To Specify How Many Bars Back To Detect A Recent Swing Low, Defval = 10
ATRFilterCheck (float) : To Filter Smaller Hammer Candles That Might Be Better Classified As A Doji Candle, Defval = 1
ATRPeriod (simple int) : To Change ATR Period Of The ATR Filter, Defval = 20
Returns: Bool - True If The Current Bar Matches The Requirements of a Hammer Candle
Star(Fib, ColorMatch, NearSwings, SwingLookBack, ATRFilterCheck, ATRPeriod)
Checks If The Current Bar Is A Hammer Candle
Parameters:
Fib (float) : To Specify Which Fibonacci Ratio To Use When Determining The Hammer Candle, Defval = 0.382 Ratio
ColorMatch (bool) : To Filter Only Bullish Closed Hammer Candle Pattern, Defval = false
NearSwings (bool) : To Specify If We Want The Doji To Be Near A Recent Swing Low, Defval = true
SwingLookBack (int) : To Specify How Many Bars Back To Detect A Recent Swing Low, Defval = 10
ATRFilterCheck (float) : To Filter Smaller Hammer Candles That Might Be Better Classified As A Doji Candle, Defval = 1
ATRPeriod (simple int) : To Change ATR Period Of The ATR Filter, Defval = 20
Returns: Bool - True If The Current Bar Matches The Requirements of a Hammer Candle
Doji(MaxWickSize, MaxBodySize, DojiType, NearSwings, SwingLookBack)
Checks If The Current Bar Is A Doji Candle
Parameters:
MaxWickSize (float) : To Specify The Maximum Lenght Of Its Upper & Lower Wick, Defval = 2
MaxBodySize (float) : To Specify The Maximum Lenght Of Its Candle Body IN PERCENT, Defval = 0.05
DojiType (int)
NearSwings (bool) : To Specify If We Want The Doji To Be Near A Recent Swing High / Low (Only In Dragonlyf / Gravestone Mode), Defval = true
SwingLookBack (int) : To Specify How Many Bars Back To Detect A Recent Swing High / Low (Only In Dragonlyf / Gravestone Mode), Defval = 10
Returns: Bool - True If The Current Bar Matches The Requirements of a Doji Candle
BullishIB(Allowance, RejectionWickSize, EngulfWick, NearSwings, SwingLookBack)
Checks If The Current Bar Is A Bullish Harami Candle
Parameters:
Allowance (int) : To Give Flexibility Of Harami Pattern Detection In Markets That Have Micro Gaps, Defval = 0
RejectionWickSize (float) : To Filter Out long (Upper And Lower) Wick From The Bullsih Harami Pattern, Defval = na
EngulfWick (bool) : To Specify If We Want The Pattern To Also Engulf Its Upper & Lower Previous Wicks, Defval = false
NearSwings (bool) : To Specify If We Want The Pattern To Be Near A Recent Swing Low, Defval = true
SwingLookBack (int) : To Specify How Many Bars Back To Detect A Recent Swing Low, Defval = 10
Returns: Bool - True If The Current Bar Matches The Requirements of a Bullish Harami Candle
BearishIB(Allowance, RejectionWickSize, EngulfWick, NearSwings, SwingLookBack)
Checks If The Current Bar Is A Bullish Harami Candle
Parameters:
Allowance (int) : To Give Flexibility Of Harami Pattern Detection In Markets That Have Micro Gaps, Defval = 0
RejectionWickSize (float) : To Filter Out long (Upper And Lower) Wick From The Bearish Harami Pattern, Defval = na
EngulfWick (bool) : To Specify If We Want The Pattern To Also Engulf Its Upper & Lower Previous Wicks, Defval = false
NearSwings (bool) : To Specify If We Want The Pattern To Be Near A Recent Swing High, Defval = true
SwingLookBack (int) : To Specify How Many Bars Back To Detect A Recent Swing High, Defval = 10
Returns: Bool - True If The Current Bar Matches The Requirements of a Bearish Harami Candle
//====================================================================================================================================================
// Custom Time Functions
//====================================================================================================================================================
BarInSession(sess, useFilter)
Determines if the current price bar falls inside the specified session © ZenAndTheArtOfTrading
Parameters:
sess (simple string)
useFilter (bool)
Returns: A boolean - true if the current bar falls within the given time session
BarOutSession(sess, useFilter)
Determines if the current price bar falls outside the specified session © ZenAndTheArtOfTrading
Parameters:
sess (simple string)
useFilter (bool)
Returns: A boolean - true if the current bar falls outside the given time session
DateFilter(startTime, endTime)
Determines if this bar's time falls within date filter range © ZenAndTheArtOfTrading
Parameters:
startTime (int)
endTime (int)
Returns: A boolean - true if the current bar falls within the given dates
DayFilter(monday, tuesday, wednesday, thursday, friday, saturday, sunday)
Checks if the current bar's day is in the list of given days to analyze © ZenAndTheArtOfTrading
Parameters:
monday (bool)
tuesday (bool)
wednesday (bool)
thursday (bool)
friday (bool)
saturday (bool)
sunday (bool)
Returns: A boolean - true if the current bar's day is one of the given days
AUSSess()
Checks If The Current Australian Forex Session In Running
Returns: Bool - True If Currently The Australian Session Is Running
ASIASess()
Checks If The Current Asian Forex Session In Running
Returns: Bool - True If Currently The Asian Session Is Running
EURSess()
Checks If The Current European Forex Session In Running
Returns: Bool - True If Currently The European Session Is Running
USSess()
Checks If The Current US Forex Session In Running
Returns: Bool - True If Currently The US Session Is Running
UNIXToDate(Time, ConversionType, TimeZone)
Converts UNIX Time To Datetime
Parameters:
Time (int) : Is The UNIX Time Input
ConversionType (int) : Is The Datetime Output Format, Defval = DD-MM-YYYY
TimeZone (string) : Is To Convert The Outputed Datetime Into The Specified Time Zone, Defval = Exchange Time Zone
Returns: String - String Of Datetime

Dominance Signal Apex [CHE]]Dominance Signal Apex — Triple-confirmed entry markers with stateful guardrails
Summary
This indicator focuses on entry timing by plotting markers only when three conditions align: a closed-bar Heikin-Ashi bias, a monotonic stack of super-smoother filters, and the current HMA slope. A compact state machine provides guardrails: it starts a directional state on closed-bar Heikin-Ashi bias, maintains it only while the smoother stack remains ordered, and renders a marker only if HMA slope agrees. This design aims for selective signals and reduces isolated prints during mixed conditions. Markers fade over time to visualize the age and persistence of the current state.
Motivation: Why this design?
Common triggers flip frequently in noise or react late when regimes shift. The core idea is to gate entry markers through a closed-bar state plus independent filter alignment. The state machine limits premature prints, removes markers when alignment breaks, and uses the HMA as a final directional gate. The result is fewer mixed-context entries and clearer clusters during sustained trends.
What’s different vs. standard approaches?
Reference baseline: Single moving-average slope or classic MA cross signals.
Architecture differences:
Multi-length two-pole super-smoother stack with strict ordering checks.
Closed-bar Heikin-Ashi bias to start a directional state.
HMA slope as a final gate for rendering markers.
Time-based alpha fade to surface state age.
Practical effect: Entry markers appear in clusters during aligned regimes and are suppressed when conditions diverge, improving selectivity.
How it works (technical)
Measurements: Four recursive super-smoother series on price at short to medium horizons. Up regime means each shorter smoother sits below the next longer one; down regime is the inverse.
State machine: On bar close, positive Heikin-Ashi bias starts a bull state and negative bias starts a bear state. The state terminates the moment the smoother ordering breaks relative to the prior bar.
Rendering gate: A marker prints only if the active state agrees with the current HMA slope. The HMA is plotted and colored by slope for context.
Normalization and clamping: Marker transparency transitions from a starting to an ending alpha across a fixed number of bars, clamped within the allowed range.
Initialization: Persistent variables track state and bar-count since state start; Heikin-Ashi open is seeded on the first valid bar.
HTF/security: None used. State updates are closed-bar, which reduces repaint paths.
Bands: Smoothed high, low, centerline, and offset bands are computed but not rendered.
Parameter Guide
Show Markers — Toggle rendering — Default: true — Hides markers without changing logic.
Bull Color / Bear Color — Visual colors — Defaults: bright green / red — Aesthetic only.
Start Alpha / End Alpha — Transparency range — Defaults: one hundred / fifty, within zero to one hundred — Controls initial visibility and fade endpoint.
Steps — Fade length in bars — Default: eight, minimum one — Longer values extend the visual memory of a state.
Smoother Length — Internal band smoothing — Default: twenty-one, minimum two — Affects computed bands only; not drawn.
Band Multiplier — Internal band offset — Default: one point zero — No impact on markers.
Source — Input for HMA — Default: close — Align with your workflow.
Length — HMA length — Default: fifty, minimum one — Larger values reduce flips; smaller values react faster.
Reading & Interpretation
Entry markers:
Bull marker (below bar): Closed-bar Heikin-Ashi bias is positive, smoother stack remains aligned for up regime, and HMA slope is rising.
Bear marker (above bar): Closed-bar Heikin-Ashi bias is negative, smoother stack remains aligned for down regime, and HMA slope is falling.
Fade: Transparency progresses over the configured steps, indicating how long the current state has persisted.
Practical Workflows & Combinations
Trend following: Focus on marker clusters aligned with HMA color. Add structure filters such as higher highs and higher lows or lower highs and lower lows to avoid counter-trend entries.
Exits/Stops: Consider exiting or reducing risk when smoother ordering breaks, when HMA color flips, or when marker cadence thins out.
Multi-asset/Multi-TF: Suitable for liquid crypto, FX, indices, and equities. On lower timeframes, shorten HMA length and fade steps for faster response.
Behavior, Constraints & Performance
Repaint/confirmation: State transitions and marker eligibility are decided on closed bars; live bars do not commit state changes until close.
security()/HTF: Not used.
Resources: Declared max bars back of one thousand five hundred; recursive filters and persistent states; no explicit loops.
Known limits: Some delay around sharp turns; brief states may start in noisy phases but are quickly revoked when alignment fails; HMA gating can miss very early reversals.
Sensible Defaults & Quick Tuning
Start here: Keep defaults.
Too many flips: Increase HMA length and raise fade steps.
Too sluggish: Decrease HMA length and reduce fade steps.
Markers too faint/bold: Adjust start and end alpha toward lower or higher opacity.
What this indicator is—and isn’t
A selective entry-marker layer that prints only under triple confirmation with stateful guardrails. It is not a full system, not predictive, and does not handle risk. Combine with market structure, risk controls, and position management.
Disclaimer
The content provided, including all code and materials, is strictly for educational and informational purposes only. It is not intended as, and should not be interpreted as, financial advice, a recommendation to buy or sell any financial instrument, or an offer of any financial product or service. All strategies, tools, and examples discussed are provided for illustrative purposes to demonstrate coding techniques and the functionality of Pine Script within a trading context.
Any results from strategies or tools provided are hypothetical, and past performance is not indicative of future results. Trading and investing involve high risk, including the potential loss of principal, and may not be suitable for all individuals. Before making any trading decisions, please consult with a qualified financial professional to understand the risks involved.
By using this script, you acknowledge and agree that any trading decisions are made solely at your discretion and risk.
Best regards and happy trading
Chervolino

Varanormal Mac N Cheez Strategy v1Mac N Cheez Strategy (Set a $200 Take profit Manually)
It's super cheesy. Strategy does the following:
Here's a detailed explanation of what the entire script does, including its key components, functionality, and purpose.
1. Strategy Setup and Input Parameters:
Strategy Name: The script is named "NQ Futures $200/day Strategy" and is set as an overlay, meaning all elements (like moving averages and signals) are plotted on the price chart.
Input Parameters:
fastLength: This sets the length of the fast moving average. The user can adjust this value, and it defaults to 9.
slowLength: This sets the length of the slow moving average. The user can adjust this value, and it defaults to 21.
dailyTarget: The daily profit target, which defaults to $200. If set to 0, this disables the daily profit target.
stopLossAmount: The fixed stop-loss amount per trade, defaulting to $100. This value is used to calculate how much you're willing to lose on a single trade.
trailOffset: This value sets the distance for a trailing stop. It helps protect profits by automatically adjusting the stop-loss as the price moves in your favor.
2. Calculating the Moving Averages:
fastMA: The fast moving average is calculated using the ta.sma() function on the close price with a period length of fastLength. The ta.sma() function calculates the simple moving average.
slowMA: The slow moving average is also calculated using ta.sma() but with the slowLength period.
These moving averages are used to determine trend direction and identify entry points.
3. Buy and Sell Signal Conditions:
longCondition: This is the buy condition. It occurs when the fast moving average crosses above the slow moving average. The script uses ta.crossover() to detect this crossover event.
shortCondition: This is the sell condition. It occurs when the fast moving average crosses below the slow moving average. The script uses ta.crossunder() to detect this crossunder event.
4. Executing Buy and Sell Orders:
Buy Orders: When the longCondition is true (i.e., fast MA crosses above slow MA), the script enters a long position using strategy.entry("Buy", strategy.long).
Sell Orders: When the shortCondition is true (i.e., fast MA crosses below slow MA), the script enters a short position using strategy.entry("Sell", strategy.short).
5. Setting Stop Loss and Trailing Stop:
Stop-Loss for Long Positions: The stop-loss is calculated as the entry price minus the stopLossAmount. If the price falls below this level, the trade is exited automatically.
Stop-Loss for Short Positions: The stop-loss is calculated as the entry price plus the stopLossAmount. If the price rises above this level, the short trade is exited.
Trailing Stop: The trail_offset dynamically adjusts the stop-loss as the price moves in favor of the trade, locking in profits while still allowing room for market fluctuations.
6. Conditional Daily Profit Target:
The script includes a daily profit target that automatically closes all trades once the total profit for the day reaches or exceeds the dailyTarget.
Conditional Logic:
If the dailyTarget is greater than 0, the strategy checks whether the strategy.netprofit (total profit for the day) has reached or exceeded the target.
If the strategy.netprofit >= dailyTarget, the script calls strategy.close_all(), closing all open trades for the day and stopping further trading.
If dailyTarget is set to 0, this logic is skipped, and the script continues trading without a daily profit target.
7. Plotting Moving Averages:
plot(fastMA): This plots the fast moving average as a blue line on the price chart.
plot(slowMA): This plots the slow moving average as a red line on the price chart. These help visualize the crossover points and the trend direction on the chart.
8. Plotting Buy and Sell Signals:
plotshape(): The script uses plotshape() to add visual markers when buy or sell conditions are met:
"Long Signal": When a buy condition (longCondition) is met, a green marker is plotted below the price bar with the label "Long".
"Short Signal": When a sell condition (shortCondition) is met, a red marker is plotted above the price bar with the label "Short".
These markers help traders quickly see when buy or sell signals occurred on the chart.
In addition, triangle markers are plotted:
Green Triangle: Indicates where a buy entry occurred.
Red Triangle: Indicates where a sell entry occurred.
Summary of What the Script Does:
Inputs: The script allows the user to adjust moving average lengths, daily profit targets, stop-loss amounts, and trailing stop offsets.
Signals: It generates buy and sell signals based on the crossovers of the fast and slow moving averages.
Order Execution: It executes long positions on buy signals and short positions on sell signals.
Stop-Loss and Trailing Stop: It sets dynamic stop-losses and uses a trailing stop to protect profits.
Daily Profit Target: The strategy stops trading for the day once the net profit reaches the daily target (unless the target is disabled by setting it to 0).
Visual Markers: It plots moving averages and buy/sell signals directly on the main price chart to aid in visual analysis.
This script is designed to trade based on moving average crossovers, with robust risk management features like stop-loss and trailing stops, along with an optional daily profit target to limit daily trading activity. Let me know if you need further clarification or want to adjust any specific part of the script!

strategyLibrary "strategy"
Library containing few key calculations for strategy involving leveraged limit and stop orders
getQty(entry, stop, riskPercentage)
calculate qty and leverage based on entry and stop price for given risk percentage.
Parameters:
entry : Entry Price
stop : Stop Price
riskPercentage : risk percentage per trade
Returns: - Quantity based on the risk and calculated leverage on position including existing positions
bracketOrder(entry, stop, target, maxLeverage, isLimitOrder, riskPercentage)
Calculates position size based on risk and creates bracket orders for given entry/stop/target
Parameters:
entry : Entry Price
stop : Stop Price
target : Target Price
maxLeverage : Maximum leverage allowed
isLimitOrder : if true, places limit order for entry, else places stop order.
riskPercentage : risk percentage per trade
Returns: orderPlaced - true if orders successfully placed, false otherwise.
order(entry, stop, maxLeverage, isLimitOrder, riskPercentage)
Calculates position size based on risk and creates order for given entry/stop
Parameters:
entry : Entry Price
stop : Stop Price
maxLeverage : Maximum leverage allowed
isLimitOrder : if true, places limit order for entry, else places stop order.
riskPercentage : risk percentage per trade
Returns: orderPlaced - true if orders successfully placed, false otherwise.
Veela ADR PublicA simplified down basic Average Daily Range
My own custom indicator uses several other features such as ATR etc to determine best entry but this is a simple Average Daily Range designed to demonstrate how banks and other industry professionals would fill orders.
This is based on my own time working within the industry.
If you imagine we are in an upwards trend and we have an orderbook with a lot of Sell Orders. Our customers want the best price for that and the only logical way to fill these orders would be to sell at what we hope is the high of the day. As we do not know that (If we did we would be rich) we have to determine that based on how much the pair has moved recently.
Enter the Average Daily Indicator.
I'll let you do your own thinking/thoughts on it!
Run with the Bulls and Hunt with the Bears!
Veela

Simple DCA Strategy----
### 📌 **Simple DCA Strategy with Backtest Date Filter**
This strategy implements a **Dollar-Cost Averaging (DCA)** approach for long positions, including:
* ✅ **Base Order Entry:** Starts a position with a fixed dollar amount when no position is open.
* 🔁 **Safety Orders:** Buys additional positions when the price drops by a defined percentage, increasing position size with each new entry using a multiplier.
* 🎯 **Take Profit Exit:** Closes all positions when the price reaches a profit target (in % above average entry).
* 🗓️ **Backtest Date Range:** Allows users to specify a custom start and optional end date to run the strategy only within that time window.
* 📊 **Plots:** Visualizes average entry, take profit level, and safety order trigger line.
#### ⚙️ Customizable Inputs:
* Base Order Size (\$)
* Price Deviation for Safety Orders (%)
* Maximum Safety Orders
* Order Size Multiplier
* Take Profit Target (%)
* Start and End Dates for Backtesting
This is a **long-only strategy** and is best used for backtesting performance of DCA-style accumulation under different market conditions.
----

Silver Bullet ICT Strategy [TradingFinder] 10-11 AM NY Time +FVG🔵 Introduction
The ICT Silver Bullet trading strategy is a precise, time-based algorithmic approach that relies on Fair Value Gaps and Liquidity to identify high-probability trade setups. The strategy primarily focuses on the New York AM Session from 10:00 AM to 11:00 AM, leveraging heightened market activity within this critical window to capture short-term trading opportunities.
As an intraday strategy, it is most effective on lower timeframes, with ICT recommending a 15-minute chart or lower. While experienced traders often utilize 1-minute to 5-minute charts, beginners may find the 1-minute timeframe more manageable for applying this strategy.
This approach specifically targets quick trades, designed to take advantage of market movements within tight one-hour windows. By narrowing its focus, the Silver Bullet offers a streamlined and efficient method for traders to capitalize on liquidity shifts and price imbalances with precision.
In the fast-paced world of forex trading, the ability to identify market manipulation and false price movements is crucial for traders aiming to stay ahead of the curve. The Silver Bullet Indicator simplifies this process by integrating ICT principles such as liquidity traps, Order Blocks, and Fair Value Gaps (FVG).
These concepts form the foundation of a tool designed to mimic the strategies of institutional players, empowering traders to align their trades with the "smart money." By transforming complex market dynamics into actionable insights, the Silver Bullet Indicator provides a powerful framework for short-term trading success
Silver Bullet Bullish Setup :
Silver Bullet Bearish Setup :
🔵 How to Use
The Silver Bullet Indicator is a specialized tool that operates within the critical time windows of 9:00-10:00 and 10:00-11:00 in the forex market. Its design incorporates key principles from ICT (Inner Circle Trader) methodology, focusing on concepts such as liquidity traps, CISD Levels, Order Blocks, and Fair Value Gaps (FVG) to provide precise and actionable trade setups.
🟣 Bullish Setup
In a bullish setup, the indicator starts by marking the high and low of the session, serving as critical reference points for liquidity. A typical sequence involves a liquidity grab below the low, where the price manipulates retail traders into selling positions by breaching a key support level.
This movement is often orchestrated by smart money to accumulate buy orders. Following this liquidity grab, a market structure shift (MSS) occurs, signaled by the price breaking the CISD Level—a confirmation of bullish intent. The indicator then highlights an Order Block near the CISD Level, representing the zone where institutional buying is concentrated.
Additionally, it identifies a Fair Value Gap, which acts as a high-probability area for price retracement and trade entry. Traders can confidently take long positions when the price revisits these zones, targeting the next significant liquidity pool or resistance level.
Bullish Setup in CAPITALCOM:US100 :
🟣 Bearish Setup
Conversely, in a bearish setup, the price manipulates liquidity by creating a false breakout above the high of the session. This move entices retail traders into long positions, allowing institutional players to enter sell orders.
Once the price reverses direction and breaches the CISD Level to the downside, a change of character (CHOCH) becomes evident, confirming a bearish market structure. The indicator highlights an Order Block near this level, indicating the origin of the institutional sell orders, along with an associated FVG, which represents an imbalance zone likely to be revisited before the price continues downward.
By entering short positions when the price retraces to these levels, traders align their strategies with the anticipated continuation of bearish momentum, targeting nearby liquidity voids or support zones.
Bearish Setup in OANDA:XAUUSD :
🔵 Settings
Refine Order Block : Enables finer adjustments to Order Block levels for more accurate price responses.
Mitigation Level OB : Allows users to set specific reaction points within an Order Block, including: Proximal: Closest level to the current price. 50% OB: Midpoint of the Order Block. Distal: Farthest level from the current price.
FVG Filter : The Judas Swing indicator includes a filter for Fair Value Gap (FVG), allowing different filtering based on FVG width: FVG Filter Type: Can be set to "Very Aggressive," "Aggressive," "Defensive," or "Very Defensive." Higher defensiveness narrows the FVG width, focusing on narrower gaps.
Mitigation Level FVG : Like the Order Block, you can set price reaction levels for FVG with options such as Proximal, 50% OB, and Distal.
CISD : The Bar Back Check option enables traders to specify the number of past candles checked for identifying the CISD Level, enhancing CISD Level accuracy on the chart.
🔵 Conclusion
The Silver Bullet Indicator is a cutting-edge tool designed specifically for forex traders who aim to leverage market dynamics during critical liquidity windows. By focusing on the highly active 9:00-10:00 and 10:00-11:00 timeframes, the indicator simplifies complex market concepts such as liquidity traps, Order Blocks, Fair Value Gaps (FVG), and CISD Levels, transforming them into actionable insights.
What sets the Silver Bullet Indicator apart is its precision in detecting false breakouts and market structure shifts (MSS), enabling traders to align their strategies with institutional activity. The visual clarity of its signals, including color-coded zones and directional arrows, ensures that both novice and experienced traders can easily interpret and apply its findings in real-time.
By integrating ICT principles, the indicator empowers traders to identify high-probability entry and exit points, minimize risk, and optimize trade execution. Whether you are capturing short-term price movements or navigating complex market conditions, the Silver Bullet Indicator offers a robust framework to enhance your trading performance.
Ultimately, this tool is more than just an indicator; it is a strategic ally for traders who seek to decode the movements of smart money and capitalize on institutional strategies. With the Silver Bullet Indicator, traders can approach the market with greater confidence, precision, and profitability.

ICT KillZones Hunt [TradingFinder] 4 Sessions + OB + FVG + Alert🔵 Introduction
🟣 ICT
The "ICT" style is a subset of "Price Action" technical analysis. The primary goal of the ICT trading strategy is to merge "Price Action" with the "Smart Money" concept to pinpoint optimal trade entry points.
However, this approach's strength extends beyond merely finding entry points. It also helps traders gain a deeper understanding of price behavior and adapt their trading strategies to the market structure.
The most important concepts of "ICT" :
Order Block
Fair Value Gap(FVG)
Liquidity
🟣 Session
Financial markets are divided into several time periods, each featuring distinct characteristics and levels of activity. These periods, known as sessions, are active at different times during the day.
The primary active sessions in financial markets include :
Asian Session
European Session
New York Session
Based on the UTC time zone, the schedule for these key sessions is :
Asian Session: 23:00 to 06:00
European Session: 07:00 to 16:30
New York Session: 13:00 to 22:00
Note
To avoid session overlap and minimize interference during kill zones, the session times have been modified as follows :
Asian Session: 23:00 to 06:00
European Session: 07:00 to 14:25
New York Session: 14:30 to 22:55
🟣 KillZone
Kill zones are periods within a session where trader activity spikes. During these times, trading volume surges, and price movements become more pronounced.
The major kill zones, according to the UTC time zone, are as follows :
Asian Kill Zone: 23:00 to 03:55
European Kill Zone: 07:00 to 09:55
New York Morning Kill Zone: 14:30 to 16:55
New York Evening Kill Zone: 19:30 to 20:55
🔵 How to Use
🟣 Order Block
Order blocks are a distinct category of "Supply and Demand" zones, formed when a series of orders are grouped together. These blocks are often created by banks or other significant market participants.
Banks typically execute large orders in blocks during their trading sessions. If they were to enter the market with small quantities, substantial price movements would occur before the orders were fully executed, reducing potential profit.
To mitigate this, they divide their orders into smaller, more manageable positions. Traders should seek "buy" opportunities in "demand order blocks" and "sell" opportunities in "supply order blocks."
🟣 Fair Value Gap (FVG)
To pinpoint the "Fair Value Gap" on the chart, meticulous candle-by-candle analysis is essential. Pay close attention to candles with significant bodies, examining each candle alongside the one preceding it.
The candles flanking this central candle should exhibit elongated shadows, with bodies that do not intersect the body of the central candle. The span between the shadows of the first and third candles is referred to as the FVG range.
Note :
The origin of all Order Blocks and FVGs starts from inside a kill zone and extends up to the end of the same session.
🟣 Kill Zone Hunt
Following this strategy, after the conclusion of the kill zone and the stabilization of its high and low lines, if the price touches either of these lines within the same session and encounters a robust rejection, it presents an opportunity to enter a trade.
🔵 Setting
🟣 Global Setting
Show All Order Block :
If it is turned off, only the last Order Block will be displayed.
Show All FVG :
If it is turned off, only the last FVG will be displayed.
Show More Info Session :
If it is turned on, more information about kill zones (Trade Volume, Time, Number of Candles) will be displayed.
🟣 Logic Parameter
Pivot Period of Order Blocks Detector :
Enter the desired pivot period to identify the Order Block.
Order Block Validity Period (Bar) :
You can specify the maximum time the Order Block remains valid based on the number of candles from the origin.
Mitigation Level Order Block :
Determining the basic level of a block order. When the price hits the basic level, the order block due to mitigation.
🟣 Order Blocks Display
Demand Order Block :
Show or not show and specify color.
Supply order Block :
Show or not show and specify color.
🟣 Order Block Refinement
Refine Demand OB :
Enable or disable the refinement feature. Mode selection.
Refine Supply OB :
Enable or disable the refinement feature. Mode selection.
🟣 FVG
FVG Validity Period (Bar) :
You can specify the maximum time the FVG remains valid based on the number of candles from the origin.
Mitigation Level FVG :
Determining the basic level of a FVG. When the price hits the basic level, the FVG due to mitigation.
Show Demand FVG :
Show or not show and specify color.
Show Supply FVG :
Show or not show and specify color.
FVG Filter :
Enable or disable filtering of FVGs. Select filter mode.
🟣 Session
Show More Info Session Color
Asia Session, London Sesseion, New York am Session & New York pm Session :
Show or not show session and kill zones. Change the display color.
🟣 Alert
Send Alert When Touched Session high & Low :
On / Off
Alert Demand OB Mitigation :
On / Off
Alert Supply OB Mitigation :
On / Off
Alert Demand FVG Mitigation :
On / Off
Alert Supply FVG Mitigation :
On / Off
Message Frequency :
This string parameter defines the announcement frequency. Choices include: "All" (activates the alert every time the function is called), "Once Per Bar" (activates the alert only on the first call within the bar), and "Once Per Bar Close" (the alert is activated only by a call at the last script execution of the real-time bar upon closing). The default setting is "Once per Bar".
Show Alert Time by Time Zone :
The date, hour, and minute you receive in alert messages can be based on any time zone you choose. For example, if you want New York time, you should enter "UTC-4". This input is set to the time zone "UTC" by default.
Display More Info :
Displays information about the price range of the order blocks (Zone Price) and the date, hour, and minute under "Display More Info". If you do not want this information to appear in the received message along with the alert, you should set it to "Off".

Smart Money Concept [TradingFinder] Major OB + FVG + Liquidity🔵 Introduction
"Smart Money" refers to funds under the control of institutional investors, central banks, funds, market makers, and other financial entities. Ordinary people recognize investments made by those who have a deep understanding of market performance and possess information typically inaccessible to regular investors as "Smart Money".
Consequently, when market movements often diverge from expectations, traders identify the footprints of smart money. For example, when a classic pattern forms in the market, traders take short positions. However, the market might move upward instead. They attribute this contradiction to smart money and seek to capitalize on such inconsistencies in their trades.
The "Smart Money Concept" (SMC) is one of the primary styles of technical analysis that falls under the subset of "Price Action". Price action encompasses various subcategories, with one of the most significant being "Supply and Demand", in which SMC is categorized.
The SMC method aims to identify trading opportunities by emphasizing the impact of large traders (Smart Money) on the market, offering specific patterns, techniques, and trading strategies.
🟣 Key Terms of Smart Money Concept (SMC)
• Market Structure (Trend)
• Change of Character (ChoCh)
• Break of Structure (BoS)
• Order Blocks (Supply and Demand)
• Imbalance (IMB)
• Inefficiency (IFC)
• Fair Value Gap (FVG)
• Liquidity
• Premium and Discount
🔵 How Does the "Smart Money Concept Indicator" Work?
🟣 Market Structure
a. Accumulation
b. Market-Up
c. Distribution
d. Market-Down
a) Accumulation Phase : During the accumulation period, typically following a downtrend, smart money enters the market without significantly affecting the pricing trend.
b) Market-Up Phase : In this phase, the price of an asset moves upward from the accumulation range and begins to rise. Usually, the buying by retail investors is the main driver of this trend, and due to positive market sentiment, it continues.
c) Distribution Phase : The distribution phase, unlike the accumulation stage, occurs after an uptrend. In this phase, smart money attempts to exit the market without causing significant price fluctuations.
d) Market-Down Phase : In this stage, the price of an asset moves downward from the distribution phase, initiating a prolonged downtrend. Smart money liquidates all its positions by creating selling pressure, trapping latecomer investors.
The result of these four phases in the market becomes the market trend.
Types of Trends in Financial Markets :
a. Up-Trend
b. Down Trend
c. Range (No Trend)
a) Up-Trend : The market breaks consecutive highs.
b) Down Trend : The market breaks consecutive lows.
c) No Trend or Range : The market oscillates within a range without breaking either highs or lows.
🟣 Change of Character (ChoCh)
The "ChoCh" or "Change of Character" pattern indicates an initial change in order flow in financial markets. This structural change occurs when a major pivot in the opposite direction of the market trend fails. It signals a potential change in the market trend and can serve as a signal for short-term or long-term trend changes in a trading symbol.
🟣 Break of Structure (BoS)
The "BoS" or "Break of Structure" pattern indicates the continuation of the trend in financial markets. This structure forms when, in an uptrend, the price breaks its ceiling or, in a downtrend, the price breaks its floor.
🟣 Order Blocks (Supply and Demand)
Order blocks consist of supply and demand areas where the likelihood of price reversal is higher. There are six order blocks in this indicator, categorized based on their origin and formation reasons.
a. Demand Main Zone, "ChoCh" Origin.
b. Demand Sub Zone, "ChoCh" Origin.
c. Demand All Zone, "BoS" Origin.
d. Supply Main Zone, "ChoCh" Origin.
e. Supply Sub Zone, "ChoCh" Origin.
f. Supply All Zone, "BoS" Origin.
🟣 FVG | Inefficiency | Imbalance
These three terms are almost synonymous. They describe the presence of gaps between consecutive candle shadows. This inefficiency occurs when the market moves rapidly. Primarily, imbalances and these rapid movements stem from the entry of smart money and the imbalance between buyer and seller power. Therefore, identifying these movements is crucial for traders.
These areas are significant because prices often return to fill these gaps or even before they occur to fill price gaps.
🟣 Liquidity
Liquidity zones are areas where there is a likelihood of congestion of stop-loss orders. Liquidity is considered the driving force of the entire market, and market makers may manipulate the market using these zones. However, in many cases, this does not happen because there is insufficient liquidity in some areas.
Types of Liquidity in Financial Markets :
a. Trend Lines
b. Double Tops | Double Bottoms
c. Triple Tops | Triple Bottoms
d. Support Lines | Resistance Lines
All four types of liquidity in this indicator are automatically identified.
🟣 Premium and Discount
Premium and discount zones can assist traders in making better decisions. For instance, they may sell positions in expensive ranges and buy in cheaper ranges. The closer the price is to the major resistance, the more expensive it is, and the closer it is to the major support, the cheaper it is.
🔵 How to Use
🟣 Change of Character (ChoCh) and Break of Structure (BoS)
This indicator detects "ChoCh" and "BoS" in both Minor and Major states. You can turn on the display of these lines by referring to the last part of the settings.
🟣 Order Blocks (Supply and Demand)
Order blocks are Zones where the probability of price reversal is higher. In demand Zones you can buy opportunities and in supply Zones you can check sell opportunities.
The "Refinement" feature allows you to adjust the width of the order block according to your strategy. There are two modes, "Aggressive" and "Defensive," in the "Order Block Refine". The difference between "Aggressive" and "Defensive" lies in the width of the order block.
For risk-averse traders, the "Defensive" mode is suitable as it provides a lower loss limit and a greater reward-to-risk ratio. For risk-taking traders, the "Aggressive" mode is more appropriate. These traders prefer to enter trades at higher prices, and this mode, which has a wider order block width, is more suitable for this group of individuals.
🟣 Fair Value Gap (FVG) | Imbalance (IMB) | Inefficiency (IFC)
In order to identify the "fair value gap" on the chart, it must be analyzed candle by candle. In this process, it is important to pay attention to candles with a large size, and a candle and a candle should be examined before that.
Candles before and after this central candle should have long shadows and their bodies should not overlap with the central candle body. The distance between the shadows of the first and third candles is known as the FVG range.
These areas work in two ways :
• Supply and demand area : In this case, the price reacts to these areas and the trend is reversed.
• Liquidity zone : In this scenario, the price "fills" the zone and then reaches the order block.
Important note : In most cases, the FVG zone of very small width acts as a supply and demand zone, while the zone of significant width acts as a liquidity zone and absorbs price.
When the FVG filter is activated, the FVG regions are filtered based on the specified algorithm.
FVG filter types include the following :
1. Very Aggressive Mode : In addition to the initial condition, an additional condition is considered. For bullish FVG, the maximum price of the last candle must be greater than the maximum price of the middle candle.
Similarly, for a bearish FVG, the minimum price of the last candle must be lower than the minimum price of the middle candle. This mode removes the minimum number of FVGs.
2. Aggressive : In addition to the very aggressive condition, the size of the middle candle is also considered. The size of the center candle should not be small and therefore more FVGs are removed in this case.
3. Defensive : In addition to the conditions of the very aggressive mode, this mode also considers the size of the middle pile, which should be relatively large and make up the majority of the body.
Also, to identify bullish FVGs, the second and third candles must be positive, while for bearish FVGs, the second and third candles must be negative. This mode filters out a significant number of FVGs and keeps only those of good quality.
4. Very Defensive : In addition to the conditions of the defensive mode, in this mode the first and third candles should not be very small-bodied doji candles. This mode filters out most FVGs and only the best quality ones remain.
🟣 Liquidity
These levels are where traders intend to exit their trades. "Market makers" or smart money usually accumulate or distribute their trading positions near these levels, where many retail traders have placed their "stop loss" orders. When liquidity is collected from these losses, the price often reverses.
A "Stop hunt" is a move designed to offset liquidity generated by established stop losses. Banks often use major news events to trigger stop hunts and capture liquidity released into the market. For example, if they intend to execute heavy buy orders, they encourage others to sell through stop-hots.
Consequently, if there is liquidity in the market before reaching the order block area, the validity of that order block is higher. Conversely, if the liquidity is close to the order block, that is, the price reaches the order block before reaching the liquidity limit, the validity of that order block is lower.
🟣 Alert
With the new alert functionality in this indicator, you won't miss any important trading signals. Alerts are activated when the price hits the last order block.
1. It is possible to set alerts for each "symbol" and "time frame". The system will automatically detect both and include them in the warning message.
2. Each alert provides the exact date and time it was triggered. This helps you measure the timeliness of the signal and evaluate its relevance.
3. Alerts include target order block price ranges. The "Proximal" level represents the initial price level strike, while the "Distal" level represents the maximum price gap in the block. These details are included in the warning message.
4. You can customize the alert name through the "Alert Name" entry.
5. Create custom messages for "long" and "short" alerts to be sent with notifications.
🔵 Setting
a. Pivot Period of Order Blocks Detector :
Using this parameter, you can set the zigzag period that is formed based on the pivots.
b. Order Blocks Validity Period (Bar) :
You can set the validity period of each Order Block based on the number of candles that have passed since the origin of the Order Block.
c. Demand Main Zone, "ChoCh" Origin :
You can control the display or not display as well as the color of Demand Main Zone, "ChoCh" Origin.
d. Demand Sub Zone, "ChoCh" Origin :
You can control the display or not display as well as the color of Demand Sub Zone, "ChoCh" Origin.
e. Demand All Zone, "BoS" Origin :
You can control the display or not display as well as the color of Demand All Zone, "BoS" Origin.
f. Supply Main Zone, "ChoCh" Origin :
You can control the display or not display as well as the color of Supply Main Zone, "ChoCh" Origin.
g. Supply Sub Zone, "ChoCh" Origin :
You can control the display or not display as well as the color of Supply Sub Zone, "ChoCh" Origin.
h. Supply All Zone, "BoS" Origin :
You can control the display or not display as well as the color of Supply All Zone, "BoS" Origin.
i. Refine Demand Main : You can choose to be refined or not and also the type of refining.
j. Refine Demand Sub : You can choose to be refined or not and also the type of refining.
k. Refine Demand BoS : You can choose to be refined or not and also the type of refining.
l. Refine Supply Main : You can choose to be refined or not and also the type of refining.
m. Refine Supply Sub : You can choose to be refined or not and also the type of refining.
n. Refine Supply BoS : You can choose to be refined or not and also the type of refining.
o. Show Demand FVG : You can choose to show or not show Demand FVG.
p. Show Supply FVG : You can choose to show or not show Supply FVG
q. FVG Filter : You can choose whether FVG is filtered or not. Also specify the type of filter you want to use.
r. Show Statics High Liquidity Line : Show or not show Statics High Liquidity Line.
s. Show Statics Low Liquidity Line : Show or not show Statics Low Liquidity Line.
t. Show Dynamics High Liquidity Line : Show or not show Dynamics High Liquidity Line.
u. Show Dynamics Low Liquidity Line : Show or not show Dynamics Low Liquidity Line.
v. Statics Period Pivot :
Using this parameter, you can set the Swing period that is formed based on Static Liquidity Lines.
w. Dynamics Period Pivot :
Using this parameter, you can set the Swing period that is formed based Dynamics Liquidity Lines.
x. Statics Liquidity Line Sensitivity :
is a number between 0 and 0.4. Increasing this number decreases the sensitivity of the "Statics Liquidity Line Detection" function and increases the number of lines identified. The default value is 0.3.
y. Dynamics Liquidity Line Sensitivity :
is a number between 0.4 and 1.95. Increasing this number increases the sensitivity of the "Dynamics Liquidity Line Detection" function and decreases the number of lines identified. The default value is 1.
z. Alerts Name : You can customize the alert name using this input and set it to your desired name.
aa. Alert Demand Main Mitigation :
If you want to receive the alert about Demand Main 's mitigation after setting the alerts, leave this tick on. Otherwise, turn it off.
bb. Alert Demand Sub Mitigation :
If you want to receive the alert about Demand Sub's mitigation after setting the alerts, leave this tick on. Otherwise, turn it off.
cc. Alert Demand BoS Mitigation :
If you want to receive the alert about Demand BoS's mitigation after setting the alerts, leave this tick on. Otherwise, turn it off.
dd. Alert Supply Main Mitigation :
If you want to receive the alert about Supply Main's mitigation after setting the alerts, leave this tick on. Otherwise, turn it off.
ee. Alert Supply Sub Mitigation :
If you want to receive the alert about Supply Sub's mitigation after setting the alerts, leave this tick on. Otherwise, turn it off.
ff. Alert Supply BoS Mitigation :
If you want to receive the alert about Supply BoS's mitigation after setting the alerts, leave this tick on. Otherwise, turn it off.
gg. Message Frequency :
This parameter, represented as a string, determines the frequency of announcements. Options include: 'All' (triggers the alert every time the function is called), 'Once Per Bar' (triggers the alert only on the first call within the bar), and 'Once Per Bar Close' (activates the alert only during the final script execution of the real-time bar upon closure). The default setting is 'Once per Bar'.
hh. Show Alert time by Time Zone :
The date, hour, and minute displayed in alert messages can be configured to reflect any chosen time zone. For instance, if you prefer London time, you should input 'UTC+1'. By default, this input is configured to the 'UTC' time zone.
ii. Display More Info : The 'Display More Info' option provides details regarding the price range of the order blocks (Zone Price), along with the date, hour, and minute. If you prefer not to include this information in the alert message, you should set it to 'Off'.
You also have access to display or not to display, choose the Style and Color of all the lines below :
a. Major Bullish "BoS" Lines
b. Major Bearish "BoS" Lines
c. Minor Bullish "BoS" Lines
d. Minor Bearish "BoS" Lines
e. Major Bullish "ChoCh" Lines
f. Major Bearish "ChoCh" Lines
g. Minor Bullish "ChoCh" Lines
h. Minor Bearish "ChoCh" Lines
i. Last Major Support Line
j. Last Major Resistance Line
k. Last Minor Support Line
l. Last Minor Resistance Line

Narrow Range StrategyNarrow Range Strategy :
INTRODUCTION :
This strategy is based on the Narrow Range Day concept, implying that low volatility will generate higher volatility in the days ahead. The strategy sends us buy and sell signals with well-defined profit targets. It's a medium/long-term strategy. There's also a money management method that allows us to reinvest part of the profits or reduce the size of orders in the event of substantial losses.
NARROW RANGE (NR) DAY :
A Narrow Range Day is a day in which price variations are included in those of a specific day some time before. The high and low of this specific day form the "reference range". In general, we compare these variations with those of 4 or 7 days ago. The mathematical formula for finding an NR4 is :
If low > low(4) and high < high(4) :
nr = true
This implies that the current low is greater than the low of 4 days ago, and the current high is smaller than the high of 4 days ago. So today's volatility is lower than that of 4 days ago, and may be a sign of high volatility to come.
PARAMETERS :
Narrow Range Length : Corresponds to the number of candles back to compare current volatility. The default is 4, allowing comparison of current volatility with that of 4 candles ago.
Stop Loss : Percentage of the reference range on which to set an exit order to limit losses. The minimum value is 0.001, while the maximum is 1. The default value is 0.35.
Fixed Ratio : This is the amount of gain or loss at which the order quantity is changed. The default is 400, which means that for each $400 gain or loss, the order size is increased or decreased by an amount chosen by the user.
Increasing Order Amount : This is the amount to be added to or subtracted from orders when the fixed ratio is reached. The default is $200, which means that for every $400 gain, $200 is reinvested in the strategy. On the other hand, for every $400 loss, the order size is reduced by $200.
Initial capital : $1000
Fees : Interactive Broker fees apply to this strategy. They are set at 0.18% of the trade value.
Slippage : 3 ticks or $0.03 per trade. Corresponds to the latency time between the moment the signal is received and the moment the order is executed by the broker.
Important : A bot was used to test NR4 and NR7 with all possible Stop Losses in order to find out which combination generates the highest return on BITSTAMP:ETHUSD while limiting the drawdown. This strategy is the most optimal with an NR4 and a SL of 35% of the reference range size in 5D timeframe.
BUY AND SHORT SIGNALS :
When an NR is spotted, we create two stop orders on the high and low of the reference range. As soon as there's a breakout from this reference range (shown in blue on the chart), we open a position. We're LONG if there's a breakout on the high and SHORT if there's a breakout on the low. Executing a stop order cancels the second stop order.
RISK MANAGEMENT :
This strategy is subject to losses. We manage our risk with Stop Losses. The user is free to enter a SL as a percentage of the reference range. The maximum amount risked per trade therefore depends on the size of the range. The larger the range, the greater the risk. That's why we have set a maximum Stop Loss to 10% to limiting risks per trade.
The special feature of this strategy is that it targets a precise profit objective. This corresponds to the size of the reference range at the top of the high if you're LONG, or at the bottom of the low if you're short. In the same way, the larger the reference range, the greater the potential profits.
The risk reward remains the same for all trades and amounts to : 100/35 = 2.86. If the reference range is too high, we have set a SL to 10% of the trade value to limit losses. In that case, the risk reward is less than 2.86.
MONEY MANAGEMENT :
The fixed ratio method was used to manage our gains and losses. For each gain of an amount equal to the value of the fixed ratio, we increase the order size by a value defined by the user in the "Increasing order amount" parameter. Similarly, each time we lose an amount equal to the value of the fixed ratio, we decrease the order size by the same user-defined value. This strategy increases both performance and drawdown.
NOTE :
Please note that the strategy is backtested from 2017-01-01. As the timeframe is 5D, this strategy is a medium/long-term strategy. That's why only 37 trades were closed. Be careful, as the test sample is small and performance may not necessarily reflect what may happen in the future.
Enjoy the strategy and don't forget to take the trade :)

Trailing Stop Loss SuperTrendThe Trailing Stop Loss SuperTrend indicator is a popular technical analysis tool used by traders to identify trends and determine optimal entry and exit points in financial markets. This indicator combines elements of the SuperTrend indicator and trailing stop loss orders to provide valuable insights into market trends and potential reversals. By incorporating Average True Range (ATR) calculations, it adapts to market volatility, making it suitable for various trading strategies. Let's explore the key use cases and benefits of the Trailing Stop Loss SuperTrend indicator:
Trend Identification:
The primary purpose of the Trailing Stop Loss SuperTrend indicator is to identify market trends. It plots two lines on the chart: an upper band (referred to as the "up" line) and a lower band (referred to as the "dn" line). The direction of these bands helps traders determine the prevailing trend. When the price is above the upper band, it suggests a bullish trend, and when it is below the lower band, it indicates a bearish trend.
Entry and Exit Signals:
The Trailing Stop Loss SuperTrend indicator generates entry and exit signals based on trend changes. When the trend changes from bearish to bullish, a buy signal is triggered, indicating a potential entry point. Conversely, when the trend changes from bullish to bearish, a sell signal is generated, suggesting a possible exit or short-selling opportunity. These signals can be used in conjunction with other trading strategies or indicators to enhance trading decisions.
Trailing Stop Loss Orders:
One of the distinguishing features of the Trailing Stop Loss SuperTrend indicator is its ability to incorporate trailing stop loss orders. Traders can use the indicator's upper and lower bands as trailing stop levels to protect profits and manage risk. For example, in a bullish trend, the stop loss level can be set at the lower band, and as the price rises, the stop loss level trails along with it, locking in profits and reducing potential losses.
Volatility Adaptation:
By incorporating the ATR (Average True Range) calculation, the Trailing Stop Loss SuperTrend indicator adjusts its sensitivity to market volatility. A higher ATR multiplier widens the distance between the price and the bands, accommodating higher volatility, while a lower multiplier tightens the bands during periods of lower volatility. This adaptability makes the indicator versatile and suitable for various market conditions.
Alerts and Notifications:
The Trailing Stop Loss SuperTrend indicator provides the ability to set alerts for specific events, such as trend changes, buy signals, and sell signals. Traders can receive real-time notifications via email, SMS, or on-platform alerts, ensuring they stay informed about potential trading opportunities and important market developments.
Conclusion:
The Trailing Stop Loss SuperTrend indicator is a valuable tool for traders seeking to identify trends, generate entry and exit signals, and effectively manage risk. Its ability to adapt to market volatility and incorporate trailing stop loss orders enhances trading strategies and decision-making. By combining the SuperTrend concept with trailing stop loss functionality, this indicator provides traders with a comprehensive approach to trend analysis and risk management. Whether used in isolation or in conjunction with other indicators, the Trailing Stop Loss SuperTrend indicator offers a powerful tool for navigating the dynamic world of financial markets.

LowFinder_PyraMider_V2This strategy is a result of an exploration to experiment with other ways to detect lows / dips in the price movement, to try out alternative ways to exit and stop positions and a dive into risk management. It uses a combination of different indicators to detect and filter the potential lows and opens multiple positions to spread the risk and opportunities for unrealized losses or profits. This script combines code developed by fellow Tradingview community_members.
LowFinder
The lows in the price movement are detected by the Low finder script by RafaelZioni . It finds the potential lows based on the difference between RSI and EMA RSI. The MTF RSI formula is part of the MTFindicators library developed by Peter_O and is integrated in the Low finder code to give the option to use the RSI of higher timeframes. The sensitivity of the LowFinder is controlled by the MA length. When potential lows are detected, a Moving Average, a MTF Stochastic (based the the MTFindiicators by Peter_O) and the average price level filter out the weak lows. In the settings the minimal percentage needed for a low to be detected below the average price can be specified.
Order Sizing and Pyramiding
Pyramiding, or spreading multiple positions, is at the heart of this strategy and what makes it so powerful. The order size is calculated based on the max number of orders and portfolio percentage specified in the input settings. There are two order size modes. The ‘base’ mode uses the same base quantity for each order it opens, the ‘multiply’ mode multiplies the quantity with each order number. For example, when Long 3 is opened, the quantity is multiplied by 3. So, the more orders the bigger the consecutive order sizes. When using ‘multiply’ mode the sizes of the first orders are considerably lower to make up for the later bigger order sizes. There is an option to manually set a fixed order size but use this with caution as it bypasses all the risk calculations.
Stop Level, Take Profit, Trailing Stop
The one indicator that controls the exits is the Stop Level. When close crosses over the Stop Level, the complete position is closed and all orders are exited. The Stop Level is calculated based on the highest high given a specified candle lookback (settings). There is an option to deviate above this level with a specified percentage to tweak for better results. You can activate a Take Profit / Trailing Stop. When activated and close crosses the specified percentage, the Stop Level logic changes to a trailing stop to gain more profits. Another option is to use the percentage as a take profit, either when the stop level crosses over the take profit or close. With this option active, you can make this strategy more conservative. It is active by default.
And finally there is an option to Take Profit per open order. If hit, the separate orders close. In the current settings this option is not used as the percentage is 10%.
Stop Loss
I published an earlier version of this script a couple of weeks ago, but it got hidden by the moderators. Looking back, it makes sense because I didn’t pay any attention to risk management and save order sizing. This resulted in unrealistic results. So, in this script update I added a Stop Loss option. There are two modes. The ‘average price’ mode calculates the stop loss level based on a given percentage below the average price of the total position. The ‘equity’ mode calculates the stop loss level based on a given percentage of your equity you want to lose. By default, the ‘equity’ mode is active. By tweaking the percentage of the portfolio size and the stop loss equity mode, you can achieve a quite low risk strategy set up.
Variables in comments
To sent alerts to my exchange I use a webhook server. This works with a sending the information in the form of a comment. To be able to send messages with different quantities, a variable is added to the comment. This makes it possible to open different positions on the exchange with increasing quantities. To test this the quantities are printed in the comment and the quantities are switched off in the style settings.
This code is a result of a study and not intended for use as a worked out and full functioning strategy. Use it at your own risk. To make the code understandable for users that are not so much introduced into pine script (like me), every step in the code is commented to explain what it does. Hopefully it helps.
Enjoy!

The Only EURUSD Trading Strategy You Need - KaspricciThe Only EURUSD Trading Strategy You Need
I got the idea to this strategy from a youtube video uploaded by Trade Beta. It is designed to capture the early market move of major forex pair EURUSD at beginning of New York Stock Exchange (13:30 GMT). Trade Beta tested his strategy on the 5 minute chart. I have set all parameters to same values as shown in the video.
The strategy creates two pending orders at the recent swing high and low. Once the first pending order entered, the remaining one is cancelled. Latest at the end of market session all pending orders are cancelled and all open trade are closed as well.
In rare case that price at session opening is above swing high, only a pending sell stop order is created at swing high price. And in case price is below swing low, a pending buy stop order is created.
Settings
Trading Time - default: New York Stock Exchange opening hours. Pending orders are created at the close of the first candle within the session.
Swing High Source / Bars - default: High / 5 bars. Used to find the latest swing high within a range of 5 bars left and right. Price is used for buy stop order.
Swing Low Source / Bars - default: Low / 5 bars. Used to find the latest swing low within a range of 5 bars left and right. Price is used for sell stop order.
Stop Loss Type - default: ATR. You can switch between stop loss calculation based on Average True Range value or fixed value.
ATR Length / Factor / TP Ratio - default: 14 / 2.0 / 2.0. Used to calculate the Stop Loss as ATR * Factor and Take Profit as Stop Loss * TP Ratio.
FIX Stop Loss / Take Profit - default: 10 pips / 20 pips. In case you select Stop Loss Type = FIX, these value swill be used.
This strategy is for educational purposes only! It is not meant to be a financial advice.

Template Trailing Strategy (Backtester)💭 Overview
+ Title: Template Trailing Strategy (Backtester)
+ Author: Iason Nikolas (jason5480)
+ License: CC BY-NC-SA 4.0
💢 What is the "Template Trailing Strategy (Backtester)" ❓
The "Template Trailing Strategy (Backtester)" (TTS) is a back-tester orchestration framework. It supercharges the implementation-test-evaluation lifecycle of new trading strategies, by making it possible to plug in your own trading idea.
While TTS offers a vast number of configuration settings, it primarily allows the trader to:
Test and evaluate your own trading logic that is described in terms of entry, exit, and cancellation conditions.
Define the entry and exit order types as well as their target prices when the limit, stop, or stop-limit order types are used.
Utilize a variety of options regarding the placement of the stop-loss and take-profit target(s) prices and support for well-known techniques like moving to breakeven and trailing.
Provide well-known quantity calculation methods to properly handle risk management and easily evaluate trading strategies and compare them.
Alert on each trading event or any related change through a robust and fully customizable messaging system.
All of the above makes TTS a practical toolkit: once you learn it, many repetitive tasks that strategy authors usually re-implement are eliminated. Using TradingView’s built-in backtesting engine makes testing and comparing ideas straightforward.
By utilizing the TTS one can easily swap "trading logic" by testing, evaluating, and comparing each trading idea and/or individual component of a strategy.
Finally, TTS, through its per-event alert management (and debugging) system, provides an automated solution that supports live trading with brokers via webhooks.
NOTE: The "Template Trailing Strategy (Backtester)" does not dictate how you can combine different indicator types. Thus, it should not be confused as a "Trading System", because it gives its user full flexibility on that end (for better or worse).
💢 What is a "Signal Indicator" ❓
"Signal Indicator" (SI) is an indicator that can output a "signal" that follows a specific convention so that the "Template Trailing Strategy (Backtester)" can "understand" and execute the orders accordingly. The SI realizes the core trading logic signaling to the TTS when to enter, exit, or cancel an order. A SI instructs the TTS "when" to enter or exit, and the TTS determines "how" to enter and exit the position once the Signal Indicator generates a signal.
A very simple example of a Signal Indicator might be a 200-day Simple Moving Average Signal. When the price of the security closes above the 200-day SMA, a SI would provide TTS with a "long entry signal". Once TTS receives the "long entry signal", the TTS will open a long position and send an alert or automated trade message via webhook to a broker, based on the Entry settings defined in TTS. If the TTS Entry settings specify a "Market" order type, then the open long position will be executed by TTS immediately. But if the TTS Entry settings specify a "Stop" order type with a 1% Stop Distance, then when the price of the security rises by 1% after the "long entry signal" occurs, the TTS will open a long position and the Long Entry alert or webhook to the broker will be sent.
🤔 How to Guide
💢 How to connect a "signal" from a "Signal Indicator" ❓
The "Template Trailing Strategy (Backtester)" was designed to receive external signals from a "Signal Indicator". In this way, a "new trading idea" can be developed, configured, and evaluated separately from the TTS. Similarly, the SI can be held constant, and the trading mechanics can change in the TTS settings and back-tested to answer questions such as, "Am I better with a different stop loss placement method, what if I used a limit order instead of a stop order to enter, what if I used 25% margin instead of trading spot market?"
To make that possible by connecting an external signal indicator to TTS, you should:
Add both your SI (e.g. "Two MA Signal Indicator" , "Click Signal Indicator" , "Signal Adapter" , "Signal Composer" ) and the TTS script to the same chart.
Open the script's Settings / Inputs dialog for the TTS.
In the 🛠️ STRATEGY group set 𝐃𝐞𝐚𝐥 𝐂𝐨𝐧𝐝𝐢𝐨𝐧𝐬 𝐌𝐨𝐝𝐞 to 🔨External (this makes TTS listen to an external signal source).
Still inside 🛠️ STRATEGY locate the 🔌𝐒𝐢𝐠𝐧𝐚𝐥 🛈 input and choose the plotted output of your SI. The option should look like: "<SI short title>:🔌Signal to TTS" .
Verbose troubleshooting & tips
If the SI does not appear in the 🔌Signal 🛈 selector, confirm both scripts are added to the same chart and the SI exposes a plotted series (title often "🔌Signal to TTS").
When using multiple SIs, pick the SI instance that actually outputs the "🔌Signal to TTS" plotted series.
Validate on the chart: when your SI changes state, the plotted "🔌Signal" series in the TTS (visible in the data window) should change accordingly.
The TTS accepts only signals that follow the tts_convention DealConditions structure. Do not attempt to feed arbitrary scalar series without using conv.getDealConditions / conv.DealConditions.
Make sure your SI composes a DealConditions value following the TTS convention (startLong, endLong, startShort, endShort — optional cancel fields). See the template below.
If the plot is present but TTS does not react, ensure the SI plot is non-repainting (or accept realtime/backtest limitations). Test on historical bars first.
Create alerts on the strategy (see the Alerts section). Use the {{strategy.order.alert_message}} placeholder in the Create Alert dialog to forward TTS messages.
💢 How to create a custom trading logic ❓
The "Template Trailing Strategy (Backtester)" provides two ways to plug in your custom trading logic. Both of them have their advantages and disadvantages.
✍️ Develop your own Customized "Signal Indicator" 💥
The first approach is meant to be used for relatively more complex trading logic. The advantages of this approach are the full control and customization you have over the trading logic and the relatively simple configuration setup by having two scripts only. The downsides are that you have to have some experience with pinescript or you are willing to learn and experiment. You should also know the exact formula for every indicator you will use since you have to write it by yourself. Copy-pasting from existing open-source indicators will get you started quite fast though.
The idea here is either to create a new indicator script from scratch or to copy an existing non-signal indicator and make it a "Signal Indicator". To create a new script, press the "Pine Editor" button below the chart to open the "Pine Editor" and then press the "Open" button to open the drop-down menu with the templates. Select the "New Indicator" option. Add it to your chart to copy an existing indicator and press the source code {} button. Its source code will be shown in the "Pine Editor" with a warning on top stating that this is a read-only script. Press the "create a working copy". Now you can give a descriptive title and a short title to your script, and you can work on (or copy-paste) the (other) indicators of your interest. Once you have the information needed to decide, define a DealConditions object and plot it like this:
import jason5480/tts_convention/ as conv
// Calculate the start, end, cancel start, cancel end conditions
dealConditions = conv.DealConditions.new(
startLongDeal = ,
startShortDeal = ,
endLongDeal = ,
endShortDeal = ,
cnlStartLongDeal = ,
cnlStartShortDeal = ,
cnlEndLongDeal = ,
cnlEndShortDeal = )
// Use this signal in scripts like "Template Trailing Strategy (Backtester)" and "Signal Composer" that can utilize its value
// Emit the current signal value according to the TTS framework convention
plot(series = conv.getSignal(dealConditions), title = '🔌Signal to TTS', color = #808000, editable = false, display = display.data_window + display.status_line, precision = 0)
You should import the latest version of the tts_convention library and write your deal conditions appropriately based on your trading logic and put them in the code section shown above by replacing the "…" part after "=". You can omit the conditions that are not relevant to your logic. For example, if you use only market orders for entering and exiting your positions the cnlStartLongDeal, cnlStartShortDeal, cnlEndLongDeal, and cnlEndShortDeal are irrelevant to your case and can be safely omitted from the DealConditions object. After successfully compiling your new custom SI script add it to the same chart with the TTS by pressing the "Add to chart" button. If all goes well, you will be able to connect your "signal" to the TTS as described in the "How to connect a "signal" from a "Signal Indicator"?" guide.
🧩 Adapt and Combine existing non-signal indicators 💥
The second approach is meant to be used for relatively simple trading logic. The advantages of this approach are the lack of pine script and coding experience needed and the fact that it can be used with closed-source indicators as long as the decision-making part is displayed as a line in the chart. The drawback is that you have to have a subscription that supports the "indicator on indicator" feature so you can connect the output of one indicator as an input to another indicator. Please check if your plan supports that feature here
To plug in your own logic that way you have to add your indicator(s) of preference in the chart and then add the "Signal Adapter" script in the same chart as well. This script is a "Signal Indicator" that can be used as a proxy to define your custom logic in the CONDITIONS group of the "Settings/Inputs" tab after defining your inputs from your preferred indicators in the VARIABLES group. Then a "signal" will be produced, if your logic is simple enough it can be directly connected to the TTS that is also added to the same chart for execution. Check the "How to connect a "signal" from a "Signal Indicator"?" in the "🤔 How to Guide" for more information.
If your logic is slightly more complicated, you can add a second "Signal Adapter" in your chart. Then you should add the "Signal Composer" in the same chart, go to the SIGNALS group of the "Settings/Inputs" tab, and connect the "signals" from the "Signal Adapters". "Signal Composer" is also a SI so its composed "signal" can be connected to the TTS the same way it is described in the "How to connect a "signal" from a "Signal Indicator"?" guide.
At this point, due to the composability of the framework, you can add an arbitrary number (bounded by your subscription of course) of "Signal Adapters" and "Signal Composers" before connecting the final "signal" to the TTS.
💢 How to set up ⏰Alerts ❓
The "Template Trailing Strategy (Backtester)" provides a fully customizable per-event alert mechanism. This means that you may have an entirely different message for entering and exiting into a position, hitting a stop-loss or a take-profit target, changing trailing targets, etc. There are no restrictions, and this gives you great flexibility.
First enable the events you want under the "🔔 ALERT MESSAGES" module. Each enabled event exposes a text area where you can craft the message using placeholders that TTS replaces with actual values when the event occurs.
The placeholder categories (exact names used by the script) are:
Chart & instrument:
{{ticker}}
{{base_currency}}
{{quote_currency}}
Entry / exit / stop / TP prices & offsets:
{{entry_price}}
{{exit_price}}
{{stop_loss_price}}
{{take_profit_price_1}} ... {{take_profit_price_5}}
{{entry+_price}}, {{entry-_price}}, {{exit+_price}}, {{exit-_price}} — Optional offset helpers (computed using "Offset Ticks")
Quantities, percents & derived quantities:
{{entry_base_quantity}} — base units at entry (e.g. BTC)
{{entry_quote_quantity}} — quote amount at entry (e.g. USD)
{{risk_perc}} — % of capital risked for that entry (multiplied by 100 when "Percentage Range " is enabled)
{{remaining_quantity_perc}} — % of the initial position remaining at close/SL
{{remaining_base_quantity}} — remaining base units at close/SL
{{take_profit_quantity_perc_1}} ... {{take_profit_quantity_perc_5}} — % sold/bought at each TP
{{take_profit_base_quantity_1}} ... {{take_profit_base_quantity_5}} — base units closed at each TP
❗ Important: the per-event alert text is injected into the Create Alert dialog using TradingView's strategy placeholder:
{{strategy.order.alert_message}}
During the creation of a strategy alert, make sure the placeholder {{strategy.order.alert_message}} exists in the "Message" box. TradingView will substitute the per-event text you configured and enabled in TTS Settings/Inputs before sending it via webhook/notification.
Tip: For webhook/broker execution, set the proper "Condition" in the Create Alert dialog (for changing-entry/exit/SL notifications use "Order fills and alert() function calls" or "alert() function calls only" as appropriate).
💢 How to execute my orders in a broker ❓
To execute your orders in a broker that supports webhook integration, you should enable the appropriate alerts in the "Template Trailing Strategy (Backtester)" first (see the "How to set up Alerts?" guide above). Then you should go to the "Create Alert/Notifications" tab check the "Webhook URL" and paste the URL provided by your broker. You have to read the documentation of your broker for more information on what messages are expected.
Keep in mind that some brokers have deep integration with TradingView so a per-event alert approach might be overkill.
📑 Definitions
This section tries to give some definitions in terms that appear in the "Settings/Inputs" tab of the "Template Trailing Strategy (Backtester)"
💢 What is Trailing ❓
Trailing is a technique where a price target follows another "barrier" price (usually high or low) by trying to keep a maximum distance from the "barrier" when it moves in only one direction (up or down). When the "barrier" moves in the other direction the price target will not change. There are as many types of trailing as price targets, which means that there are entry trailing, exit trailing, stop-loss trailing, and take-profit trailing techniques.
💢 What is a Moonbag ❓
A Moonbag in a trade is the quantity of the position that is reserved and will not be exited even if all take-profit targets defined in the strategy are hit, the quantity will be exited only if the stop-loss is hit or a close signal is received. This makes the stop-loss trailing technique in a trend-following strategy a good candidate to take advantage of a Moonbag.
💢 What is Distance ❓
Distance is the difference between two prices.
💢 What is Bias ❓
Bias is a psychological phenomenon where you make decisions based on market sentiment. For example, when you want to enter a long position you have a long bias, and when you want to exit from the long position you have a short bias. It is the other way around for the short position.
💢 What is the Bias Distance of a price target ❓
The Bias Distance of a price target is the distance that the target will deviate from its initial price. The direction of this deviation depends on the bias of the market. For example, suppose you are in a long position, and you set a take-profit target to the local highest high. In that case, adding a bias distance of five ticks will place your take-profit target 5 ticks below this local highest high because you have a short bias when exiting a long position. When the bias is long the bias distance will be added resulting in a higher target price and when you have a short bias the bias distance will be subtracted.
⚙️ Settings
In the "Settings/Inputs" tab of the "Template Trailing Strategy (Backtester)", you can find all the customizable settings that are provided by the framework. The variety of those settings is vast; hence we will only scratch the surface here. However, for every setting, there is an information icon 🛈 where you can learn more if you mouse over it. The "Settings/Inputs" tab is divided into ten main groups. Each one of them is responsible for one module of the framework. Every setting is part of a group that is named after the module it represents. So, to spot the module of a setting find the title that appears above it comes with an emoji and uppercase letters. Some settings might have the same name but belong to different modules e.g. "Tgt Dist Mtd" (Target Distance Method). Some settings are indented, which means that they are closely related to the non-indented setting above. Usually, indented settings provide further configuration for one or more options of the non-indented setting above. The groups that correspond to each module of the framework are the following:
🗺️ Quick Module Cross-Reference (use emojis to jump to setting groups)
📆 FILTERS — session, date & weekday filters
🛠️ STRATEGY — internal vs external deal-conditions; pick the signal source
🔧 STRATEGY – INTERNAL — built-in Two MA logic for demonstration purposes
🎢 VOLATILITY — ATR / StDev update modes
🔷 ENTRY — entry order types & trailing
🎯 TAKE PROFIT — multi-step TP and trailing rules
🛑 STOP LOSS — stop placement, move-to-breakeven, trailing
🟪 EXIT — exit order types & cancel logic
💰 QUANTITY/RISK MANAGEMENT — position sizing, moonbag, limits
📊 ANALYTICS — stats, streaks, seasonal tables
🔔 ALERT MESSAGES — per-event alert templates & placeholders
😲 Caveats
💢 Does "Template Trailing Strategy (Backtester)" have repainting behavior? ❓
The answer is that the "Template Trailing Strategy (Backtester)" does not repaint as long as the "Signal Indicator" that is connected also does not repaint. If you developed your own SI make sure that you understand and know how to prevent this behavior. The publication by @PineCoders here will give you a good idea on how to avoid most of the repainting cases.
⚠️ There is an exception though, when the "Enable Trail⚠️💹" checkbox is checked, the Take Profit trailing feature is enabled, and a tick-based approach is used, meaning that after a while, when the TradingView discards all the real-time data, assumptions will be made by the backtesting engine that will cause a form of repainting. To avoid making false assumptions please disable this feature in the early stages and evaluate its usefulness in your strategy later on, after first confirming the success of the logic without this feature. In this case, consider turning on the bar magnifier feature. This way you will get more accurate backtest results when the Take Profit trailing feature is enabled.
💢 Can "Template Trailing Strategy (Backtester)" satisfy all my trading strategies ❓
While this framework can satisfy quite a large number of trading strategies there are cases where it cannot do so. For example, if you have a custom logic for your stop-loss or take-profit placement, or if you want to dollar cost average, then it might be better to start a new strategy script from scratch.
⚠️ It is not recommended to copy the official TTS code and start developing unless you are a Pine wizard! Even in that case, there is a stiff learning curve that might not be worth your time. Last, you must consider that I do not offer support for customized versions of the TTS script and if something goes wrong in the process you are all alone.
💝 Support & Feedback
For feedback, bug reports, or feature requests, contact me via TradingView PM or use the script comments.
Note: The author's personal links and contact are available on the TradingView profile.
🤗 Thanks
Special thanks to the welcoming community members, who regularly gave feedback all those years and helped me to shape the framework as it is today! Thanks everyone who contributed by either filing a "defect report" or asking questions that helped me to understand what improvements were necessary to help traders.
Enjoy!
Jason

Gap driven intraday trade (better in 15 Min chart)// Based on yesterday's High, Low, today's open, and Bollinger Band (20) in current minute chart,
// Defined intraday Trading opportunity: Stop, Entry, T0, Target (S.E.T.T)
// Back test in 60, 30, 15, 5 Min charts with SPY, QQQ, XOP, AAPL, TSLA, NVDA, UAL
// In 60 and 30 min chart, the stop and target are too big. 5 min is too small.
// 15 min Chart is the best time frame for this strategy;
// -------------------------------------------------------------------------------
// There will be Four lines in this study:
// 1. Entry Line,
// 1.1 Green Color line to Buy, If today's open price above Yesterday's High, and current price below BB upper line.
// 1.2 Red Color line to Short, if today's open price below Yesterday's Low, and current above BB Lower line.
//
// 2. Black line to show initial stop, one ATR in current min chart;
//
// 3. Blue Line (T0) to show where trader can move stop to make even, one ATR in current min chart;
//
// 4. Orange Line to show initial target, Three ATR in current min chart;
//
// Trading opportunity:
// If Entry line is green color, Set stop buy order at today's Open;
// Whenever price is below the green line, Prepare to buy;
//
// If Entry line is Red color, Set Stop short at today's Open;
// Whenever price is above the red line, Prepare to short;
//
// Initial Stop: One ATR in min chart;
// Initial T0: One ATR in min chart;
// Initial Target: Three ATR in min chart;
// Initial RRR: Reward Risk Ratio = 3:1;
//
// Maintain: Once the position moves to T0, Move stop to "Make even + Lunch (such as, Entry + $0.10)";
// Allow to move target bigger, such as, next demand/supply zone;
// When near target or demand/supply zone or near Market close, move stop tightly;
//
// Close position: Limit order filled, or near Market Close, or trendline break;
//
// Key Step: Move stop to "Make even" after T0, Do not turn winner to loser;
// Willing to "in and out" many times in one day, and trade the same direction, same price again and again.
//
// Basic trading platform requests:
// To use this strategy, user needs to:
// 1. Scan Stocks Before market open:
// Prepare a watch list for top 10 ETF and Top 90 stocks which are most actively traded.
// Stock might be limited by price range, Beta, optionable, ...
// Before market open, Run a scan for these stocks, find which has GAP and inside BB;
// create watch list for that day.
//
// 2. Attach OSO and OCO orders:
// User needs to Send Entry, Stop (loss), and limit (target) orders at one time;
// Order Send order ( OSO ): Entry order sends Stop order and limit order;
// Order Cancel order ( OCO ): Stop order and limit order, when one is filled, it will cancel the other instantly;

TURT Donchian Ladder v3.13How to trade TURT+ with the v3.13 script
1) Pick the system & arm the entry
• In the script, choose System = S1 (20D) or S2 (55D).
The HUD always shows both rails for reference, but the ladder (Entry/+Adds) uses the system you pick.
• Your Entry is shown as Pivot + 0.1×N (rounded).
• Place a stop-limit “parent” order at that Entry price. (Classic Turtle uses an entry stop; I suggest a tight limit offset so you don’t chase a blow-through.)
• Initial stop = N2 = Entry − 2×N (rounded). Put that in immediately.
If you like only confirming on a bar close, leave confirmClose = true and place the parent after the close that breaks out. If you want intrabar fills, set confirmClose = false and keep the stop-limit active intraday.
2) Size it the way you planned
• Set acctEquity / riskCapPct / posCapUSD / entryFrac / entryRiskFrac / sizingMode.
• HUD gives Rec Entry Qty (when flat) and, once in, it shows:
• Next Rung (price)
• Suggested AddShares (honors RiskCap & PosCap)
• Proj Stop if Add (ratcheted N2)
• A limiter note (RiskCap or PosCap) if you’re constrained.
3) After entry fills, stage the ADDs (only at fixed +N steps)
• Adds are NOT “every Donchian break.” You add only at:
• Add-1 = Entry + 0.5×N
• Add-2 = Entry + 1.0×N
• Add-3 = Entry + 1.5×N (optional)
• Use the HUD’s Suggested AddShares for each rung (it respects your RiskCap/PosCap).
• Place stop-limit orders for each add (either immediately as a contingent OTO chain that arms only after Entry fills, or you arm each add when price approaches—your choice).
• On each add fill, ratchet the catastrophic stop for the entire position to Last-Add − 2×N (the script and HUD show Proj Stop if Add so you know where it will land). Never move it lower.
Pro tip: If your broker supports OTO/OTOCO:
• OTO parent = Entry stop-limit.
• On fill, fire an OCO with the N2 stop (no target), and also stage child stop-limits for Add-1 / Add-2 / Add-3 with the correct sizes. If your broker can’t chain that deep, just use the script’s alerts (Entry/Add-1/Add-2/Add-3/Exits) to place/adjust orders quickly.
4) Exits (two layers)
• Catastrophic (always on): the N2 stop you’re ratcheting (Last-Add − 2×N).
• Trend exits (runner):
• S1: 10-low close (HUD shows it).
• S2: 20-low close (HUD shows it).
• Profit-taking (optional): sell ~50% at +2.5R to +3R vs current N2; let the runner trail with 10-low/20-low. You can keep N2 as a hard backstop.
5) Should you pre-set everything or buy live?
Both work; pick the style that fits you:
Preset (Turtle-pure, rules-based)
• ✅ You won’t miss the breakout; minimal discretion.
• ✅ Broker handles fills even if you’re away.
• ⚠️ You may get the occasional intraday “poke” (use confirmClose + place after close if you want fewer).
Buy on break manually
• ✅ Lets you check tape/volume or any extra gates before clicking.
• ⚠️ Higher chance of slippage or of simply missing the trigger.
A nice hybrid: place the Entry order, then arm Add-1/2/3 when price is nearing each rung and the HUD shows Suggested AddShares > 0 (green risk read).
⸻
6) Quick checklist per trade
1. System: S1 or S2?
2. Levels: Entry / Add-1 / Add-2 / Add-3 / 10-low / 20-low / N2 (rounded).
3. Sizing: confirm RiskCap/PosCap; HUD shows Suggested AddShares and limiter.
4. Orders:
• Parent Entry stop-limit.
• N2 stop (rounded).
• Stage adds (stop-limits) with sizes from HUD.
5. On fill: ratchet stop to Last-Add − 2×N; adjust remaining adds and sizes.
⸻
7) Example with your MU position (pattern)
• You’re already in: set entryQty and entryPman in the inputs to match your fill.
• HUD now focuses on Next Rung, Suggested AddShares, and Proj Stop if Add.
• If Suggested AddShares = 0 and limiter says RiskCap or PosCap, you’ll still see the next rung price and Proj Stop if Add so you can decide whether to override.
⸻
Bottom line
• Entry: buy the Donchian breakout + 0.1N with a stop-limit (Turtle style).
• Adds: only at +0.5N steps, sized by HUD; not on every future Donchian break.
• Stops: keep (and ratchet) the N2 catastrophic; trail runner on 10-low / 20-low.
If you want, tell me your broker/platform and I’ll map this to exact order ticket types (stop-limit/OTO/OCO) and a tiny checklist you can keep next to your screen.
