IDKFAIDKFA - Advanced Order Blocks & Volume Profile with Market Structure Analysis
Why IDKFA?
Named after the legendary DOOM cheat code that gives players "all weapons and full ammo," IDKFA provides traders with a comprehensive arsenal of market analysis tools. Just as the cheat code arms players with everything needed for combat, this indicator equips traders with essential market structure tools: Order Blocks, Volume Profile, LVN/HVN areas, Fibonacci retracements, and intelligent buy/sell signals - all in one unified system.
Core Features
Order Blocks Detection
Automatically identifies institutional order blocks using pivot high/low analysis
Extends blocks dynamically until price interaction occurs
Bullish blocks (demand zones) and bearish blocks (supply zones)
Customizable opacity and extend functionality
Advanced Volume Profile
Real-time volume profile calculation for multiple session types
Point of Control (POC), Value Area High (VAH), and Value Area Low (VAL)
Mode 1: Side-by-side bull/bear volume display
Mode 2: Overlapped volume display with percentage analysis
Shows buying vs selling pressure at each price level
LVN/HVN Area Detection
Low Volume Nodes (LVN): Areas below VAL where price moves quickly
High Volume Nodes (HVN): Areas above VAH with strong resistance
NPOC (Naked Point of Control): Single print areas within Value Area
Volume-based gradient coloring shows relative activity levels
Smart Fibonacci Retracements
Auto-detects trend direction for proper fibonacci orientation
Dynamic color coding: Red levels in uptrends, Gold in downtrends
Special 88.6% level turns lime green in downtrends
Key levels: 23.6%, 38.2%, 50%, 61.8%, 65%, 78.6%, 88.6%
Intelligent Signal System
Works best on higher timeframes
Identifies high-probability reversal setups at key levels
Buy signals: Large bearish rejection followed by bullish reclaim
Sell signals: Large bullish rejection followed by bearish breakdown
Signals only trigger near significant support/resistance areas
Signal Analysis & Usage Guidelines
Buy Signal Mechanics
The buy signal triggers when:
Previous candle shows significant bearish movement (minimum ATR multiplier)
Current candle reclaims a configurable percentage of the previous candle's range
Price is near a key support level (order blocks, fibonacci, volume levels)
Sell Signal Mechanics
The sell signal triggers when:
Previous candle shows significant bullish movement (minimum ATR multiplier)
Current candle rejects below a configurable percentage of the previous candle's range
Price is near a key resistance level (order blocks, fibonacci, volume levels)
When to TAKE Signals
High Probability Buy Signals:
Signal appears AT or BELOW the VAL (Value Area Low)
Signal occurs at bullish order block confluence
Price is in LVN area below VAL (momentum acceleration zone)
Signal aligns with fibonacci 61.8% or 78.6% support
Multiple session POC levels provide support confluence
Previous session's VAL acting as current support
High Probability Sell Signals:
Signal appears AT or ABOVE the VAH (Value Area High)
Signal occurs at bearish order block confluence
Price is in HVN area above VAH (heavy resistance zone)
Signal aligns with fibonacci 61.8% or 78.6% resistance
Multiple session POC levels provide resistance confluence
Previous session's VAH acting as current resistance
When to AVOID Signals
Avoid Buy Signals When:
Signal appears ABOVE the VAH (buying into resistance)
Price is in HVN red zones (high volume resistance areas)
No clear support structure below current price
Volume profile shows heavy selling pressure (high bear percentages)
Signal occurs during low-volume periods between major sessions
Multiple bearish order blocks exist below current price
Avoid Sell Signals When:
Signal appears BELOW the VAL (selling into support)
Price is in LVN green zones (momentum could continue)
No clear resistance structure above current price
Volume profile shows heavy buying pressure (high bull percentages)
Signal occurs during Asian session ranges without clear direction
Multiple bullish order blocks exist above current price
Volume Profile Context for Signals
Understanding Bull/Bear Percentages:
70%+ Bull dominance at a level = Strong support expected
70%+ Bear dominance at a level = Strong resistance expected
50/50 Split = Neutral zone, less predictable
Use percentages to gauge conviction behind moves
POC (Point of Control) Interactions:
Signals above POC in uptrend = Higher probability
Signals below POC in downtrend = Higher probability
Signals against POC bias require extra confirmation
POC often acts as magnetic level for price return
Trading Strategies
Strategy 1: VAL/VAH Bounce Strategy
Wait for price to approach VAL (support) or VAH (resistance)
Look for signal confirmation at these critical levels
Enter with tight stops beyond the Value Area
Target opposite boundary or next session's levels
Strategy 2: Order Block + Volume Confluence
Identify order block alignment with VAL/VAH
Wait for signal within the confluence zone
Enter on signal with stop beyond order block
Use LVN areas as acceleration zones for targets
Strategy 3: LVN/HVN Strategy
LVN (Green) Areas: "Go Zones" - expect quick price movement through low volume
HVN (Red) Areas: "Stop Zones" - expect resistance and potential reversals
NPOC Areas: "Fill Zones" - price often returns to fill single print gaps
Strategy 4: Multi-Session Analysis
Use Daily/Weekly for major structure context
Use 4H for intermediate levels
Use 1H for precise entry timing
Ensure all timeframes align before taking signals
Strategy 5: Fibonacci + Volume Profile
Buy signals at 61.8% or 78.6% fibonacci near VAL
Sell signals at 61.8% or 78.6% fibonacci near VAH
Use 88.6% level as final support/resistance before major moves
50% level often aligns with POC for confluence
Signal Quality Assessment
Grade A Signals (Highest Probability):
Signal at VAL/VAH with order block confluence
Fibonacci level alignment (61.8%, 78.6%)
Volume profile shows 70%+ dominance in signal direction
Multiple timeframe structure alignment
Signal occurs during high-volume sessions (London/NY)
Grade B Signals (Moderate Probability):
Signal near POC with some confluence
Fibonacci 50% or 38.2% alignment
Mixed volume profile readings (50-70% dominance)
Some timeframe alignment present
Signal during overlap sessions
Grade C Signals (Lower Probability):
Signal with minimal confluence
Weak fibonacci alignment or none
Volume profile neutral or against signal
Conflicting timeframe signals
Signal during low-volume periods
Risk Management Guidelines
Position Sizing Based on Signal Quality:
Grade A: Standard position size
Grade B: Reduced position size (50-75%)
Grade C: Minimal position size (25%) or skip entirely
Stop Loss Placement:
Beyond order block boundaries
Outside Value Area (VAL/VAH)
Below/above fibonacci confluence levels
Account for session volatility ranges
Profit Targets:
First target: Opposite VAL/VAH boundary
Second target: Next session's key levels
Final target: Major order blocks or fibonacci extensions
Credits & Attribution
Original components derived from:
Market Sessions & Volume Profile by © Leviathan (Mozilla Public License 2.0)
Volume Profile elements inspired by @LonesomeTheBlue's volume profile script
Pivot Order Blocks by TradingWolf / © MensaTrader (Mozilla Public License 2.0)
Auto Fibonacci Retracement code (public domain)
Significant enhancements and modifications include:
Advanced LVN/HVN detection and visualization
Bull/Bear percentage analysis for Mode 2/3
Comprehensive alert system with market context
Integrated buy/sell signals at key levels
Performance optimizations and extended session support
Enhanced Mode 2/3 with percentage pressure analysis
Important Disclaimers
This indicator is a technical analysis tool designed for educational purposes. It does not provide financial advice, investment recommendations, or trading signals that guarantee profits. All trading involves substantial risk of loss, and past performance does not guarantee future results. Users should conduct their own research, understand the risks involved, and consider consulting with qualified financial advisors before making trading decisions. The signals and analysis provided are based on historical price patterns and volume data, which may not predict future market movements accurately.
Best Practices
Never trade signals blindly - always consider volume profile context
Wait for confluence between multiple tools before entering
Respect the Value Area - avoid buying above VAH or selling below VAL
Use session context - Asian ranges vs London/NY breakouts
Practice proper risk management - position size based on signal quality
Understand the bigger picture - use multiple timeframes for context
Remember: Like the IDKFA cheat code, having all the tools doesn't guarantee success. The key is learning to use them together effectively and understanding when NOT to take a signal is often more important than knowing when to take one.
Tìm kiếm tập lệnh với "order"

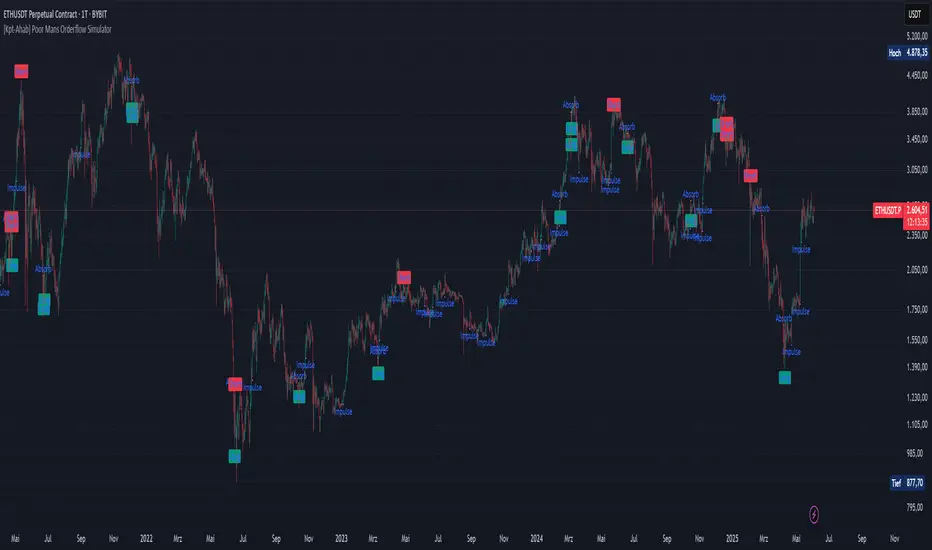
[Kpt-Ahab] Poor Mans Orderflow SimulatorScript Description – Poor Mans Orderflow Simulator
Purpose of the Script
This script simulates a simplified order flow approach ("Poor Man's Orderflow") without access to actual Bid/Ask data. The goal is to detect, quantify, and visualize patterns such as absorption, impulsive moves, and structured re-entry behaviors.
Calculation Logic
Absorption Candles
A candle is classified as "absorption" if:
The ratio of body size to full candle range is below a defined threshold,
Volume is significantly higher than the average of the last N periods,
The candle direction is negative (for long absorption) or positive (for short absorption).
These conditions define a candle with high activity but minimal price movement in the respective direction.
Impulse Candles
A candle is classified as "impulse" if:
The body-to-range ratio is high (indicating a strong directional move),
Volume exceeds the average significantly,
The price closes in the direction of the candle body (bullish or bearish).
Additionally, the average range of previous candles serves as a minimum benchmark for the impulse.
Cluster Detection
A cluster is detected when:
A minimum number of absorption candles is counted within a defined lookback period,
Either the long or short version of the absorption logic is used,
The result is a binary condition: cluster active or inactive.
Entry Signals (Re-entry)
An entry signal is generated when:
One or more absorption candles occurred in the last two bars,
A pullback against the direction of absorption occurs,
The current candle shows a directional move confirmed by a close in the expected direction.
These re-entry signals are evaluated separately for long and short scenarios.
Cluster-Confirmed Signals
A separate signal is generated when a valid re-entry setup occurs while a cluster is active. This represents a combined logic condition.
Alert Logic
The script provides a multi-layer alert framework:
Signal selection (Alertmode):
The user defines which signal type should trigger an alert (e.g. re-entry only, cluster only, combination, or impulse).
Optional filter (Filtermode):
A secondary filter limits alerts to cases where an additional condition (e.g. absorption cluster) is active.
Signal output:
As a simple binary value (+1 / –1) for classic alerts,
Or via an encoded Multibit signal, compatible with other modules in the djmad ecosystem.
These alerts are intended for integration with external systems or for use within platform-native visual or automation features.
Volumetric Rejection Blocks [UAlgo]The Volumetric Rejection Blocks is designed to help traders identify and visualize key price levels where volumetric rejections occur, which may indicate a shift in market sentiment. These rejections can signal potential trend reversals or areas where price action is likely to face support or resistance. By drawing rejection blocks based on volumetric strength, the indicator allows users to observe where significant buying or selling pressure has been exerted, which can be used as a reference point for future price action.
Also indicator dynamically calculates swing highs and lows, analyzes bullish and bearish strengths based on volume-weighted price movements, and displays rejection blocks on the chart. Each rejection block represents an area where the price attempted to move beyond a certain level but faced rejection, either on a close or wick basis. This can be particularly useful for traders who rely on market structure and order flow to make informed decisions about entering or exiting trades.
🔶 Key Features
Swing Length Customization: Allows users to define the swing length, helping tailor the sensitivity of the swing high and low detection to the specific market conditions.
Rejection Block Visualization: Displays up to the last 10 rejection blocks based on user settings, clearly marking areas of significant bullish or bearish rejections.
Volumetric Strength Analysis: The indicator calculates bullish and bearish strength for each rejection block, based on volume-weighted price movements over the last few bars, giving insight into the intensity of the rejection.
Violation Check Type: Offers two options for violation detection—"Close" and "Wick". This allows traders to specify whether a price level is considered broken only if it closes beyond the level or if any wick breaches it.
Bullish and Bearish Block Coloring: Rejection blocks are colored to represent bullish (green) and bearish (red) rejection areas. The color transparency can be adjusted for clear visibility overlaid on the price chart.
Market Structure Labels: Labels and lines marking "Market Structure Shift" (MSS) and "Break of Structure" (BOS) are displayed, giving traders context about significant market structure changes.
🔶 Interpreting the Indicator
Rejection Blocks: These colored blocks on the chart indicate areas where the price faced significant buying or selling pressure. A green block suggests a bullish rejection (support zone), where buyers absorbed the sell-off, potentially pushing the price upward. Conversely, a red block indicates a bearish rejection (resistance zone), where sellers overpowered buyers, potentially driving the price lower.
Strength Analysis: The width of the green and red sections within a rejection block represents the relative bullish and bearish strengths. A wider green section indicates stronger bullish support, while a wider red section suggests more robust bearish resistance. This helps traders gauge the likelihood of price holding or breaching these levels.
Market Structure Shift (MSS) and Break of Structure (BOS): The indicator automatically detects and labels significant changes in market structure. An "MSS" label indicates the first break, suggesting a potential shift in trend direction. A "BOS" label indicates a subsequent confirmation in trend direction, allowing traders to recognize potential trend continuations.
Violation Check: Traders can choose how to interpret breaks of these rejection blocks. Using the "Close" option provides a more conservative approach, requiring a close beyond the level for confirmation. The "Wick" option is more aggressive, treating any wick beyond the level as a break.
🔶 Disclaimer
Use with Caution: This indicator is provided for educational and informational purposes only and should not be considered as financial advice. Users should exercise caution and perform their own analysis before making trading decisions based on the indicator's signals.
Not Financial Advice: The information provided by this indicator does not constitute financial advice, and the creator (UAlgo) shall not be held responsible for any trading losses incurred as a result of using this indicator.
Backtesting Recommended: Traders are encouraged to backtest the indicator thoroughly on historical data before using it in live trading to assess its performance and suitability for their trading strategies.
Risk Management: Trading involves inherent risks, and users should implement proper risk management strategies, including but not limited to stop-loss orders and position sizing, to mitigate potential losses.
No Guarantees: The accuracy and reliability of the indicator's signals cannot be guaranteed, as they are based on historical price data and past performance may not be indicative of future results.

ICT Killzones Toolkit [LuxAlgo]The ICT Killzones Toolkit is a comprehensive set of tools designed to assist traders in identifying key trading zones and patterns within the market.
The ICT Killzones Toolkit includes the following Price Action components:
ICT Killzones with Pivot Highs/Lows
Order Blocks
Breaker Blocks
Fair Value Gaps
Market Structure Shifts
By combining these components, the ICT Killzones Toolkit provides traders with a comprehensive framework for analyzing the market and identifying setups of interest. Leveraging these tools effectively can enhance traders' decision-making process and improve killzones interpretability.
🔶 USAGE
In forex/futures trading, timing is crucial. ICT Killzone are specific periods when there's a higher chance of finding setups of interest. Mastering these time intervals can offer significant advantages to traders who know how to use them effectively.
The image above highlights a potential setup of interest when using the ICT Killzones Toolkit.
As another example for utilizing the ICT Killzones Toolkit, we can see in the image above when price retests setups generated from killzones such as Order Blocks or Fair Value Gaps, a potential strategy could be to look for entries on those & take profits as the next killzone appears.
🔹 Order Blocks
Order Blocks are sections on a price chart where notable buying or selling activity has occured, often signaling interest zones for institutional traders. This toolkit's Order Blocks component pinpoints these areas within the Killzone, which may act as potential support or resistance levels.
🔹 Breaker Blocks
Breaker Blocks are zones built from mitigated order blocks, and highlight zones on the chart where price has previously stalled or reversed. These areas may act as significant barriers to price movement in the future, and the Breaker Blocks component helps traders identify them for potential trading opportunities.
🔹 Fair Value Gaps
Fair value gaps are especially favored by price action traders and arise from market inefficiencies or imbalances, typically when buying and selling are unequal. These gaps often attract price movement before resuming in the same direction. the Fair Value Gaps component of the toolkit helps traders identify and analyze them.
🔹 Market Structure Shifts
Market Structure Shifts refer to significant changes in the overall structure of the market, such as shifts in trend direction, volatility, or trading activity. These shifts can provide valuable insights into market sentiment and potential trading opportunities, and the Market Structure Shifts component helps traders identify and interpret them.
Overall, the ICT Killzone Toolkit combines these components to provide traders with a comprehensive framework for analyzing the markets and identifying high-probability trading setups.
🔶 SETTINGS
🔹 ICT Killzones
Asian, London Open, New York, and London Close: toggles the visibility of specific Killzones, allowing users to customize time periods and Killzone colors.
Killzone Lines : Top/Bottom, Mean and Extend Top/Bottom: toggles the visibility of the Killzone's pivot high and low lines, mean (average) line, and allows users to extend the pivot lines.
Killzone Labels: Toggles the visibility of the Killzone labels.
Display Killzones within Timeframes Up To: Toggles the visibility of the Killzones up to selected Timeframes.
Open Price, Separator, Label, and Color: toggles the visibility of the open price of the Killzones or for the day, week, or month. If the day, week, or month is selected, a separator will be displayed to highlight the beginning of each respective period. Additionally, users can customize the color and toggle the label as needed.
🔹 Order Blocks & Breaker Blocks
Order Blocks | Breaker Blocks: toggles the visibility of the order blocks & breaker blocks.
Swing Detection Length: lookback period used for the detection of the swing points used to create order blocks & breaker blocks.
Mitigation Price: allows users to select between closing price or wick of the candle.
Use Candle Body in Detection: allows users to use candle bodies as order block areas instead of the full candle range.
Remove Mitigated Order Blocks & Breaker Blocks: toggles the visibility of the mitigated order blocks & breaker blocks.
Extend Order Blocks & Breaker Blocks: enables processing of the order blocks & breaker blocks beyond the boundaries of the killzones.
Display Order Blocks & Breaker Blocks: enables the display of the first, last, or all occurrences of the order blocks & breaker blocks.
Order Blocks : Bullish, Bearish Color: color customization option for order blocks.
Breaker Blocks : Bullish, Bearish Color: color customization option for breaker blocks.
Show Order Blocks & Breaker Blocks Text: toggles the visibility of the order blocks & breaker blocks labels.
🔹 Market Structure Shifts
Market Structure Shifts: toggles the visibility of the market structure shifts.
Detection Length: market structure shift detection length.
Display Market Structure Shifts: enables the display of the first, last, or all occurrences of the market structure shifts.
Market Structure Shifts : Bullish, Bearish Color: color custumization option for market structure shifts.
Show Market Structure Shifts Text: toggles the visibility of the market structure shifts labels.
🔹 Fair Value Gaps
Fair Value Gaps: toggles the visibility of the fair value gaps.
Fair Value Gap Width Filter: filtering threshold wile detecting fair value gaps.
Remove Mitigated Fair Value Gaps: removes mitigated fair value gaps.
Extend Fair Value Gaps: enables processing of the fair value gaps beyond the boundaries of the killzones.
Display Fair Value Gaps: enables the display of the first, last, or all occurrences of the fair value gaps.
Bullish Imbalance Color: color customization option.
Bearish Imbalance Color: color customization option.
Show Fair Value Gaps Text: toggles the visibility of the fair value gaps labels.
🔶 RELATED SCRIPTS
Smart-Money-Concepts
Order-Blocks-Breaker-Blocks
Thanks to our community for recommending this script. For more conceptual scripts and related content, we welcome you to explore by visiting >>> LuxAlgo-Scripts .

PhinkTrade Risk Manager EssentialsHello there, fellow traders!
So, happy to bring you a new, free tool: my Risk Manager Essentials .
(To use it, click on "Add to favorite indicators" below, and then look for it in your charts’ "Indicators & Strategies" dialog window, inside "Favorites" tab.)
The main objective of this indicator is to help and incentivize as many traders as possible to adopt essential risk management practices .
First and foremost, it helps you define how much you can buy or sell, at your chosen price levels, in order to keep your risk always under control (in other words: in order to limit the amount you can potentially lose with a trade if your stop loss order is hit).
This is fundamental if you want to have a lasting and successful trading career: protect your capital, always . Because without it, you know: it’s game over.
Indicator also helps you visualize where minimum ideal target / take profit level is , given your risk, using the popular 3:1 Return/Risk ratio (R/R) .
3:1 R/R ratio is popular because with it you only need to “be right” (have price reach your targets) about 33% of the time, in order to be profitable : in other words, the fewer successful trades will pay you more than the sum of your unsuccessful ones will take from you.
So, make sure your strategy has a success rate greater than 33% and apply 3:1 R/R to your trades . This indicator will help you that, and with developing the necessary discipline . For example, by knowing where the ideal target should be, given your choices, you can assess the likelihood of it being reached in current price context. If that would look like a hard to happen scenario, it would probably be a good idea to avoid taking that particular trade.
Now, let’s see how it works:
When you deploy the indicator to the chart for the first time, you’ll be asked to define:
Your 1st entry price (interactively: you can define and adjust levels directly on the chart, thanks to the new Interactive Mode introduced by TradingView (ty, TV team!))
Your stop loss price (likewise)
Your 1st target price (likewise)
Your starting capital (via initial Input dialog)
Your risk (likewise)
Your risk is how much of your starting capital you are willing to lose if your stop loss is hit (define it as a % of your starting capital).
There’s a good practice here too: to risk only 1 percent of your capital per trade . This way, you can reinforce the odds of making more money than you lose and keep your peace of mind in all trades – and avoid messing up with your plans – and statistics – along the way.
Successful trading is a statistics-based endeavor. So, you want to implement and maintain consistency. Again, this indicator helps with that.
After initial setup:
You can also define additional entries and targets (up to 3 each) . Just open indicator’s Settings window and adjust accordingly.
If you have more than one entry – or target, the amounts involved will be split evenly between them. You can also enable the display of the Average Entry and Average Target labels , to see the equivalent, should you have taken (or take) a single order for each.
You can also define (via Settings, then interactively) a particular date and time for the trade . This way, labels will be presented near that moment, instead of constantly show near the latest bar.
Finally, you can personalize some other display settings: levels precision (number of decimal places), labels positions , and labels colors .
In conclusion:
You are very welcome to check it out – and adopt it on your daily use!
Please let me know your feedbacks as well. If you find any issues, or have any suggestions, I’ll be glad to hear. You can contact me here, via TradingView, or Telegram.
Finally, check the updates section below , as new stuff may show from time to time.
Thank you very much for your attention, and enjoy!
PhinkTrade

Nth Order Differencing Oscillator Perform higher order differencing through convolution, the result is equivalent to cascading N momentum oscillators of periods P :
mom(mom(mom(mom(x,P)...,P)
Settings
length - Period of the oscillator, indicate the lag to use (equivalent to the period in a momentum oscillator)
order - Differencing order, indicate how many times differencing is performed (number of times a momentum oscillator is cascaded)
src - Input of the indicator
Usage
Differencing consists in subtracting an input to a previous input, this is what the momentum oscillator performs. This is often done in order to remove longer-term variations in the price. Differencing also induces a 90-degree phase shift for all sinusoids in a signal, this is why oscillators can have this leading effect, as such higher differencing can sometimes help have a faster and more visible lead.
In red the indicator with period 50 and differencing order 2, below a momentum oscillator of the same period.
It is important to note that differencing is an operation that increases noise, in fact, you might have seen some oscillators use the median price hl2 instead of the closing price, this is because the median price contains less noise than the closing price, as such more differencing require a smoother input.
Here both the sma and the oscillator period are equal to 20 with a differencing order of 5.
In time series analysis the order of differencing is chosen depending on the order of integration, more simply put we should choose a differencing order that responds to the question: "How many time should I differentiate my time series so that the result is stationary?", for stocks prices this differencing order should be 1.
Technically speaking differencing orders higher than 3 might be overkill, as higher orders return noisier outputs that might no longer be representative of the original input.
here a period of 14 with differencing order of 20 is used, we can see more periodic results but they are not really representative of the closing prices.
Details
Simple differencing is actually achieved thought convolution, if we take a first-order difference x - x(1) , we can see that this is equivalent to 1*x + -1*x(1) , the coefficients are 1 and -1, for the momentum oscillator the difference is that the coefficients include 0 values. So we only need a function generating the coefficients of our Nth order difference oscillator, in order to get them lets analyze the impulse response of a cascaded change function.
Here 5 change function are cascaded, the coefficients are: (1,-5,10,-10,5,-1)
If you look at these coefficients and the ones of higher/lower order differences we can deduce various things
The impulse response is symmetric
The first coefficient is always 1 and the last always -1
The number of coefficients increase with higher differencing orders
The sign of the current coefficient is different from the sign of the previous one
From the shape of the impulse response, we can deduce that the coefficients of an Nth order differencing operator is a windowed series of 1,-1,1...,-1 , and that's actually the case, for an Nth order differencing operator the values of this window are given by the Nth row of the Pascal triangle.
There are various ways to get the values in the row of the Pascal triangle, one involving using the combination formula, however, we can do it way faster by using the recursive formula used in line number 13. Now that we have our coefficients we only need to separate them with 0 values and that's all.
Conclusion
We can see that oscillators are noisier than the original input signal, this is can be a desired effect in order to make lagging indicators more reactive, but it can also be overlooked due to the results appearing leading the price or just looking more predictable, however, we should note that higher-order differencing does not provide a consistent nor reliable solution toward minimizing lag, nor does classical oscillators.
The indicator is not useful, but if for some reason you require a lot of differencing operations to be done and don't want to use consecutive change or mom functions, then this script might results useful to you.

ICT Venom Trading Model [TradingFinder] SMC NY Session 2025SetupIntroduction
The ICT Venom Model is one of the most advanced strategies in the ICT framework, designed for intraday trading on major US indices such as US100, US30, and US500. This model is rooted in liquidity theory, time and price dynamics, and institutional order flow.
The Venom Model focuses on detecting Liquidity Sweeps, identifying Fair Value Gaps (FVG), and analyzing Market Structure Shifts (MSS). By combining these ICT core concepts, traders can filter false breakouts, capture sharp reversals, and align their entries with the real institutional liquidity flow during the New York Session.
Key Highlights of ICT Venom Model :
Intraday focus : Optimized for US indices (US100, US30, US500).
Time element : Critical window is 08:00–09:30 AM (Venom Box).
Liquidity sweep logic : Price grabs liquidity at 09:30 AM open.
Confirmation tools : MSS, CISD, FVG, and Order Blocks.
Dual setups : Works in both Bullish Venom and Bearish Venom conditions.
At its core, the ICT Venom Strategy is a framework that explains how institutional players manipulate liquidity pools by engineering false breakouts around the initial range of the market. Between 08:00 and 09:30 AM New York time, a range called the “Venom Box” is formed.
This range acts as a trap for retail traders, and once the 09:30 AM market open occurs, price usually sweeps either the high or the low of this box to collect stop-loss liquidity. After this liquidity grab, the market often reverses sharply, giving birth to a classic Bullish Venom Setup or Bearish Venom Setup
The Venom Model (ICT Venom Trading Strategy) is not just a pattern recognition tool but a precise institutional trading model based on time, liquidity, and market structure. By understanding the Initial Balance Range, watching for Liquidity Sweeps, and entering trades from FVG zones or Order Blocks, traders can anticipate market reversals with high accuracy. This strategy is widely respected among ICT followers because it offers both risk management discipline and clear entry/exit conditions. In short, the Venom Model transforms liquidity manipulation into actionable trading opportunities.
Bullish Setup :
Bearish Setup :
🔵 How to Use
The ICT Venom Model is applied by observing price behavior during the early hours of the New York session. The first step is to define the Initial Range, also called the Venom Box, which is formed between 08:00 and 09:30 AM EST. This range marks the high and low points where institutional traders often create traps for retail participants. Once the official market opens at 09:30 AM, price usually sweeps either the top or bottom of this box to collect liquidity.
After this liquidity grab, the market tends to reverse in alignment with the true directional bias. To confirm the setup, traders look for signals such as a Market Structure Shift (MSS), Change in State of Delivery (CISD), or the appearance of a Fair Value Gap (FVG). These elements validate the reversal and provide precise levels for trade execution.
🟣 Bullish Setup
In a Bullish Venom Setup, the market first sweeps the low of the Venom Box after 09:30 AM, triggering sell-side liquidity collection. This downward move is often sharp and deceptive, designed to stop out retail long positions and attract new sellers. Once liquidity is taken, the market typically shifts direction, forming an MSS or CISD that signals a reversal to the upside.
Traders then wait for price to retrace into a Fair Value Gap or a demand-side Order Block created during the reversal leg. This retracement offers the ideal entry point for long positions. Stop-loss placement should be just below the liquidity sweep low, while profit targets are set at the Venom Box high and, if momentum continues, at higher session or daily highs.
🟣 Bearish Setup
In a Bearish Venom Setup, the process is similar but reversed. After the Initial Range is defined, if price breaks above the Venom Box high following the 09:30 AM open, it signals a false breakout designed to collect buy-side liquidity. This move usually traps eager buyers and clears out stop-losses above the high.
After the liquidity sweep, confirmation comes through an MSS or CISD pointing to a reversal downward. At this stage, traders anticipate a retracement into a Fair Value Gap or a supply-side Order Block formed during the reversal. Short entries are taken within this zone, with stop-loss positioned just above the liquidity sweep high. The logical profit targets include the Venom Box low and, in stronger bearish momentum, deeper session or daily lows.
🔵 Settings
Refine Order Block : Enables finer adjustments to Order Block levels for more accurate price responses.
Mitigation Level OB : Allows users to set specific reaction points within an Order Block, including: Proximal: Closest level to the current price. 50% OB: Midpoint of the Order Block. Distal: Farthest level from the current price.
FVG Filter : The Judas Swing indicator includes a filter for Fair Value Gap (FVG), allowing different filtering based on FVG width: FVG Filter Type: Can be set to "Very Aggressive," "Aggressive," "Defensive," or "Very Defensive." Higher defensiveness narrows the FVG width, focusing on narrower gaps.
Mitigation Level FVG : Like the Order Block, you can set price reaction levels for FVG with options such as Proximal, 50% OB, and Distal.
CISD : The Bar Back Check option enables traders to specify the number of past candles checked for identifying the CISD Level, enhancing CISD Level accuracy on the chart.
🔵 Conclusion
The ICT Venom Model is more than just a reversal setup; it is a complete intraday trading framework that blends liquidity theory, time precision, and market structure analysis. By focusing on the Initial Range between 08:00 and 09:30 AM New York time and observing how price reacts at the 09:30 AM open, traders can identify liquidity sweeps that reveal institutional intentions.
Whether in a Bullish Venom Setup or a Bearish Venom Setup, the model allows for precise entries through Fair Value Gaps (FVGs) and Order Blocks, while maintaining clear risk management with well-defined stop-loss and target levels.
Ultimately, the ICT Venom Model provides traders with a structured way to filter false moves and align their trades with institutional order flow. Its strength lies in transforming liquidity manipulation into actionable opportunities, giving intraday traders an edge in timing, accuracy, and consistency. For those who master its logic, the Venom Model becomes not only a strategy for entry and exit, but also a deeper framework for understanding how liquidity truly drives price in the New York session.

Smarter Money Concepts Dashboard [PhenLabs]📊Smarter Money Concepts Dashboard
Version: PineScript™v6
📌Description
The Smarter Money Concepts Dashboard is a comprehensive institutional trading analysis tool that combines six of our most powerful smarter money concepts indicators into one unified suite. This advanced system automatically detects and visualizes Fair Value Gaps, Inverted FVGs, Order Blocks, Wyckoff Springs/Upthrusts, Wick Rejection patterns, and ICT Market Structure analysis.
Built for serious traders who need institutional-grade market analysis, this dashboard eliminates subjective interpretation by automatically identifying where smart money is likely positioned. The integrated real-time dashboard provides instant status updates on all active patterns, making it easy to monitor market conditions at a glance.
🚀Points of Innovation
● Multi-Module Integration: Six different SMC concepts unified in one comprehensive system
● Real-Time Dashboard Display: Live tracking of all active patterns with customizable positioning
● Advanced Volume Filtering: Institutional volume confirmation across all pattern types
● Automated Pattern Management: Smart memory system prevents chart clutter while maintaining relevant zones
● Probability-Based Wyckoff Detection: Mathematical probability calculations for spring/upthrust patterns
● Dual FVG System: Both standard and inverted Fair Value Gap detection with equilibrium analysis
🔧Core Components
● Fair Value Gap Engine: Detects standard FVGs with volume confirmation and equilibrium line analysis
● Inverted FVG Module: Advanced IFVG detection using RVI momentum filtering for inversion confirmation
● Order Block System: Institutional order block identification with customizable mitigation methods
● Wyckoff Pattern Recognition: Automated spring and upthrust detection with probability scoring
● Wick Rejection Analysis: High-probability reversal patterns based on wick-to-body ratios
● ICT Market Structure: Simplified institutional concepts with commitment tracking
🔥Key Features
● Comprehensive Pattern Detection: All major SMC concepts in one indicator with automatic identification
● Volume-Confirmed Signals: Multiple volume filters ensure only institutional-grade patterns are highlighted
● Interactive Dashboard: Real-time status display with active pattern counts and module status
● Smart Memory Management: Automatic cleanup of old patterns while preserving relevant market zones
● Full Alert System: Complete notification coverage for all pattern types and signal generations
● Customizable Display Options: Adjustable colors, transparency, and positioning for all visual elements
🎨Visualization
● Color-Coded Zones: Distinct color schemes for bullish/bearish patterns across all modules
● Dynamic Box Extensions: Automatically extending zones until mitigation or invalidation
● Equilibrium Lines: Fair Value Gap midpoint analysis with dotted line visualization
● Signal Markers: Clear spring/upthrust signals with directional arrows and probability indicators
● Dashboard Table: Professional-grade status panel with module activation and pattern counts
● Candle Coloring: Wick rejection highlighting with transparency-based visual emphasis
📖Usage Guidelines
Fair Value Gap Settings
● Days to Analyze: Default 15, Range 1-100 - Controls historical FVG detection period
● Volume Filter: Enables institutional volume confirmation for gap validity
● Min Volume Ratio: Default 1.5 - Minimum volume spike required for gap recognition
● Show Equilibrium Lines: Displays FVG midpoint analysis for precise entry targeting
Order Block Configuration
● Scan Range: Default 25 bars - Lookback period for structure break identification
● Volume Filter: Institutional volume confirmation for order block validation
● Mitigation Method: Wick or Close-based invalidation for different trading styles
● Min Volume Ratio: Default 1.5 - Volume threshold for significant order block formation
Wyckoff Analysis Parameters
● S/R Lookback: Default 20 - Support/resistance calculation period for spring/upthrust detection
● Volume Spike Multiplier: Default 1.5 - Required volume increase for pattern confirmation
● Probability Threshold: Default 0.7 - Minimum probability score for signal generation
● ATR Recovery Period: Default 5 - Price recovery calculation for pattern strength assessment
Market Structure Settings
● Auto-Detect Zones: Automatic identification of high-volume thin zones
● Proximity Threshold: Default 0.20% - Price proximity requirements for zone interaction
● Test Window: Default 20 bars - Time period for zone commitment calculation
Display Customization
● Dashboard Position: Four corner options for optimal chart layout
● Text Size: Scalable from Tiny to Large for different screen configurations
● Pattern Colors: Full customization of all bullish and bearish zone colors
✅Best Use Cases
● Swing Trading: Identify major institutional zones for multi-day position entries
● Day Trading: Precise intraday entries at Fair Value Gaps and Order Block boundaries
● Trend Analysis: Market structure confirmation for directional bias establishment
● Risk Management: Clear invalidation levels provided by all pattern boundaries
● Multi-Timeframe Analysis: Works across all timeframes from 1-minute to monthly charts
⚠️Limitations
● Market Condition Dependency: Performance varies between trending and ranging market environments
● Volume Data Requirements: Requires accurate volume data for optimal pattern confirmation
● Lagging Nature: Some patterns confirmed after initial price movement has begun
● Pattern Density: High-volatility markets may generate excessive pattern signals
● Educational Tool: Requires understanding of smart money concepts for effective application
💡What Makes This Unique
● Complete SMC Integration: First indicator to combine all major smart money concepts comprehensively
● Real-Time Dashboard: Instant visual feedback on all active institutional patterns
● Advanced Volume Analysis: Multi-layered volume confirmation across all detection modules
● Probability-Based Signals: Mathematical approach to Wyckoff pattern recognition accuracy
● Professional Memory Management: Sophisticated pattern cleanup without losing market relevance
🔬How It Works
1. Pattern Detection Phase:
● Multi-timeframe scanning for institutional footprints across all enabled modules
● Volume analysis integration confirms patterns meet institutional trading criteria
● Real-time pattern validation ensures only high-probability setups are displayed
2. Signal Generation Process:
● Automated zone creation with precise boundary definitions for each pattern type
● Dynamic extension system maintains relevance until mitigation or invalidation occurs
● Alert system activation provides immediate notification of new pattern formations
3. Dashboard Update Cycle:
● Live status monitoring tracks all active patterns and module states continuously
● Pattern count updates provide instant feedback on current market condition density
● Commitment tracking for market structure analysis shows institutional engagement levels
💡Note:
This indicator represents institutional trading concepts and should be used as part of a comprehensive trading strategy. Pattern recognition accuracy improves with understanding of smart money principles. Combine with proper risk management and multiple confirmation methods for optimal results.

Advanced Market TheoryADVANCED MARKET THEORY (AMT)
This is not an indicator. It is a lens through which to see the true nature of the market.
Welcome to the definitive application of Auction Market Theory. What you have before you is the culmination of decades of market theory, fused with state-of-the-art data analysis and visual engineering. It is an institutional-grade intelligence engine designed for the serious trader who seeks to move beyond simplistic indicators and understand the fundamental forces that drive price.
This guide is your complete reference. Read it. Study it. Internalize it. The market is a complex story, and this tool is the language with which to read it.
PART I: THE GRAND THEORY - A UNIVERSE IN AN AUCTION
To understand the market, you must first understand its purpose. The market is a mechanism of discovery, organized by a continuous, two-way auction.
This foundational concept was pioneered by the legendary trader J. Peter Steidlmayer at the Chicago Board of Trade in the 1980s. He observed that beneath the chaotic facade of ticking prices lies a beautifully organized structure. The market's primary function is not to go up or down, but to facilitate trade by seeking a price level that encourages the maximum amount of interaction between buyers and sellers. This price is "value."
The Organizing Principle: The Normal Distribution
Over any given period, the market's activity will naturally form a bell curve (a normal distribution) turned on its side. This is the blueprint of the auction.
The Point of Control (POC): This is the peak of the bell curve—the single price level where the most trade occurred. It represents the point of maximum consensus, the "fairest price" as determined by the market participants. It is the gravitational center of the session.
The Value Area (VA): This is the heart of the bell curve, typically containing 70% of the session's activity (one standard deviation). This is the zone of "accepted value." Prices within this area are considered fair and are where the market is most comfortable conducting business.
The Extremes: The thin areas at the top and bottom of the curve are the "unfair" prices. These are levels where one side of the auction (buyers at the top, sellers at the bottom) was shut off, and trade was quickly rejected. These are areas of emotional trading and excess.
The Narrative of the Day: Balance vs. Imbalance
Every trading session is a story of the market's search for value.
Balance: When the market rotates and builds a symmetrical, bell-shaped profile, it is in a state of balance . Buyers and sellers are in agreement, and the market is range-bound.
Imbalance: When the market moves decisively away from a balanced area, it is in a state of imbalance . This is a trend. The market is actively seeking new information and a new area of value because the old one was rejected.
Your Purpose as a Trader
Your job is to read this story in real-time. Are we in balance or imbalance? Is the auction succeeding or failing at these new prices? The Advanced Market Theory engine is your Rosetta Stone to translate this complex narrative into actionable intelligence.
PART II: THE AMT ENGINE - AN EVOLUTION IN MARKET VISION
A standard market profile tool shows you a picture. The AMT Engine gives you the architect's full schematics, the engineer's stress tests, and the psychologist's behavioral analysis, all at once.
This is what makes it the Advanced Market Theory. We have fused the timeless principles with layers of modern intelligence:
TRINITY ANALYSIS: You can view the market through three distinct lenses. A Volume Profile shows where the money traded. A TPO (Time) Profile shows where the market spent its time. The revolutionary Hybrid Profile fuses both, giving you a complete picture of market conviction—marrying volume with duration.
AUTOMATED STRUCTURAL DECODING: The engine acts as your automated analyst, identifying critical structural phenomena in real-time:
Poor Highs/Lows: Weak auction points that signal a high probability of reversal.
Single Prints & Ledges: Footprints of rapid, aggressive market moves and areas of strong institutional acceptance.
Day Type Classification: The engine analyzes the session's personality as it develops ("Trend Day," "Normal Day," etc.), allowing you to adapt your strategy to the market's current character.
MACRO & MICRO FUSION: Via the Composite Profile , the engine merges weeks of data to reveal the major institutional battlegrounds that govern long-term price action. You can see the daily skirmish and the multi-month war on a single chart.
ORDER FLOW INTELLIGENCE: The ultimate advancement is the integrated Cumulative Volume Delta (CVD) engine. This moves beyond structure to analyze the raw aggression of buyers versus sellers. It is your window into the market's soul, automatically detecting critical Divergences that often precede major trend shifts.
ADAPTIVE SIGNALING: The engine's signal generation is not static; it is a thinking system. It evaluates setups based on a multi-factor Confluence Score , understands the market Regime (e.g., High Volatility), and adjusts its own confidence ( Probability % ) based on the complete context.
This is not a tool that gives you signals. This is a tool that gives you understanding .
PART III: THE VISUAL KEY - A LEXICON OF MARKET STRUCTURE
Every element on your chart is a piece of information. This is your guide to reading it fluently.
--- THE CORE ARCHITECTURE ---
The Profile Histogram: The primary visual on the left of each session. Its shape is the story. A thin profile is a trend; a fat, symmetrical profile is balance.
Blue Box : The zone of accepted, "fair" value. The heart of the session's business.
Bright Orange Line & Label : The Point of Control. The gravitational center. The price of maximum consensus. The most significant intraday level.
Dashed Blue Lines & Labels : The boundaries of value. Critical inflection points where the market decides to either remain in balance or seek value elsewhere.
Dashed Cyan Lines & Labels : The major, long-term structural levels derived from weeks of data. These are institutional reference points and carry immense weight. Treat them as primary support and resistance.
Dashed Orange Lines & Labels : Marks a Poor or Unfinished Auction . These represent emotional, weak extremes and are high-probability targets for future price action.
Diamond Markers : Mark Single Prints , which are footprints of aggressive, one-sided moves that left a "liquidity vacuum." Price is often drawn back to these levels to "repair" the poor structure.
Arrow Markers : Mark Ledges , which are areas of strong horizontal acceptance. They often act as powerful support/resistance in the future.
Dotted Gray Lines & Labels : The projected daily range based on multiples of the Initial Balance . Use them to set realistic profit targets and gauge the day's potential.
--- THE SIGNAL SUITE ---
Colored Triangles : These are your high-probability entry signals. The color is a strategic playbook:
Gold Triangle : ELITE Signal. An A+ setup with overwhelming confluence. This is the highest quality signal the engine can produce.
Yellow Triangle : FADE Signal. A counter-trend setup against an exhausted move at a structural extreme.
Cyan Triangle : BREAKOUT Signal. A momentum setup attempting to capitalize on a breakout from the value area.
Purple Triangle : ROTATION Signal. A mean-reversion setup within the value area, typically from one edge towards the POC.
Magenta Triangle : LIQUIDITY Signal. A sophisticated setup that identifies a "stop run" or liquidity sweep.
Percentage Number: The engine's calculated probability of success . This is not a guarantee, but a data-driven confidence score.
Dotted Gray Line: The signal's Entry Price .
Dashed Green Lines: The calculated Take Profit Targets .
Dashed Red Line: The calculated Stop Loss level.
PART IV: THE DASHBOARD - YOUR STRATEGIC COMMAND CENTER
The dashboard is your real-time intelligence briefing. It synthesizes all the engine's analysis into a clear, concise, and constantly updating summary.
--- CURRENT SESSION ---
POC, VAH, VAL: The live values for the core structure.
Profile Shape: Is the current auction top-heavy ( b-shaped ), bottom-heavy ( P-shaped ), or balanced ( D-shaped )?
VA Width: Is the value area expanding (trending) or contracting (balancing)?
Day Type: The engine's judgment on the day's personality. Use this to select the right strategy.
IB Range & POC Trend: Key metrics for understanding the opening sentiment and its evolution.
--- CVD ANALYSIS ---
Session CVD: The raw order flow. Is there more net buying or selling pressure in this session?
CVD Trend & DIVERGENCE: This is your order flow intelligence. Is the order flow confirming the price action? If "DIVERGENCE" flashes, it is a critical, high-alert warning of a potential reversal.
--- MARKET METRICS ---
Volume, ATR, RSI: Your standard contextual metrics, providing a quick read on activity, volatility, and momentum.
Regime: The engine's assessment of the broad market environment: High Volatility (favor breakouts), Low Volatility (favor mean reversion), or Normal .
--- PROFILE STATS, COMPOSITE, & STRUCTURE ---
These sections give you a quick quantitative summary of the profile structure, the major long-term Composite levels, and any active Poor Structures.
--- SIGNAL TYPES & ACTIVE SIGNAL ---
A permanent key to the signal colors and their meanings, along with the full details of the most recent active signal: its Type , Probability , Entry , Stop , and Target .
PART V: THE INPUTS MENU - CALIBRATING YOUR LENS
This engine is designed to be calibrated to your specific needs as a trader. Every input is a lever. This is not a "one size fits all" tool. The extensive tooltips are your built-in user manual, but here are the key areas of focus:
--- MARKET PROFILE ENGINE ---
Profile Mode: This is the most fundamental choice. Volume is the standard for price-based support and resistance. TPO is for analyzing time-based acceptance. Hybrid is the professional's choice, fusing both for a complete picture.
Profile Resolution: This is your zoom lens. Lower values for scalping and intraday precision. Higher values for a cleaner, big-picture view suitable for swing trading.
Composite Sessions: Your timeframe for macro analysis. 5-10 sessions for a weekly view; 20-30 sessions for a monthly, structural view.
--- SESSION & VALUE AREA ---
These settings must be configured correctly for your specific asset. The Session times are critical. The Initial Balance should reflect the key opening period for your market (60 minutes is standard for equities).
--- SIGNAL ENGINE & RISK MANAGEMENT ---
Signal Mode: THIS IS YOUR PERSONAL RISK PROFILE. Set it to Conservative to see only the absolute best A+ setups. Use Elite or Balanced for a standard approach. Use Aggressive only if you are an experienced scalper comfortable with managing more frequent, lower-probability setups.
ATR Multipliers: This suite gives you full, dynamic control over your risk/reward parameters. You can precisely define your initial stop loss distance and profit targets based on the market's current volatility.
A FINAL WORD FROM THE ARCHITECT
The creation of this engine was a journey into the very heart of market dynamics. It was born from a frustrating truth: that the most profound market theories were often confined to books and expensive institutional platforms, inaccessible to the modern retail trader. The goal was to bridge that gap.
The challenge was monumental. Making each discrete system—the volume profile, the TPO counter, the composite engine, the CVD tracker, the signal generator, the dynamic dashboard—work was a task in itself. But the true struggle, the frustrating, painstaking process that consumed countless hours, was making them work in unison . It was about ensuring the CVD analysis could intelligently inform the signal engine, that the day type classification could adjust the probability scores, and that the composite levels could provide context to the intraday structure, all in a seamless, real-time dance of data.
This engine is the result of that relentless pursuit of integration. It is built on the belief that a trader's greatest asset is not a signal, but clarity . It was designed to clear the noise, to organize the chaos, and to present the elegant, underlying logic of the market auction so that you can make better, more informed, and more confident decisions.
It is now in your hands. Use it not as a crutch, but as a lens. See the market for what it truly is.
"The market can remain irrational longer than you can remain solvent."
- John Maynard Keynes
DISCLAIMER
This script is an advanced analytical tool provided for informational and educational purposes only. It is not financial advice. All trading involves substantial risk, and past performance is not indicative of future results. The signals, probabilities, and metrics generated by this indicator do not constitute a recommendation to buy or sell any financial instrument. You, the user, are solely responsible for all trading decisions, risk management, and outcomes. Use this tool to supplement your own analysis and trading strategy.
PUBLISHING CATEGORIES
Volume Profile
Market Profile
Order Flow

Trapped Traders Order BlocksHow It Works
The Trapped Traders Order Blocks indicator identifies specific price action patterns that suggest large market participants ("big money") have been trapped in losing positions after significant price sweeps, creating potential opportunities for reversals. The indicator detects both "bullish trap blocks" (where bearish traders are trapped) and "bearish trap blocks" (where bullish traders are trapped). Here’s the step-by-step process for each:
Bullish Trap Block (Bears Trapped):
A bearish candle (Candle A) must sweep the high of the previous candle (Candle B), meaning its high exceeds the high of the prior candle.
This bearish candle must have a longer upper wick than its lower wick, indicating rejection of higher prices.
The candle must not be a doji (i.e., it must have a significant body, defined as the body being at least 10% of the candle's range).
The next candle (Candle C) must close above the body of the bearish candle (Candle A), suggesting that price has immediately moved against the bearish sweep, potentially trapping bearish traders who entered short positions expecting a downward move.
The body of the bearish candle (Candle A) is marked as a "bullish trap block." A box is drawn around this candle's body, and a label ("Bullish Trap") is placed below it.
Bearish Trap Block (Bulls Trapped):
A bullish candle (Candle A) must sweep the low of the previous candle (Candle B), meaning its low is below the low of the prior candle.
This bullish candle must have a longer lower wick than its upper wick, indicating rejection of lower prices.
The candle must not be a doji.
The next candle (Candle C) must close below the body of the bullish candle (Candle A), suggesting that price has immediately moved against the bullish sweep, potentially trapping bullish traders who entered long positions expecting an upward move.
The body of the bullish candle (Candle A) is marked as a "bearish trap block." A box is drawn around this candle's body, and a label ("Bearish Trap") is placed above it.
Dynamic Box Extension:
For both bullish and bearish trap blocks, the box extends dynamically to the current bar unless it exceeds a user-defined age (default is 52 bars), at which point it stops at the maximum age.
Sweep Detection:
Bullish Sweep (of any trap block, bullish or bearish):
The current candle's open is above the top of the box.
The low is below the top of the box.
The close is above the top of the box.
The lower wick is longer than the upper wick (indicating rejection of lower prices).
The close is above 50% of the candle's range (ensuring a strong bullish bias).
When a bullish sweep occurs, a label ("Bullish Sweep") is placed at the low of the candle, pointing upward, and an alert is triggered.
Bearish Sweep (of any trap block, bullish or bearish):
The current candle's open is below the bottom of the box.
The high is above the bottom of the box.
The close is below the bottom of the box.
The upper wick is longer than the lower wick (indicating rejection of higher prices).
The close is below 50% of the candle's range (ensuring a strong bearish bias).
When a bearish sweep occurs, a label ("Bearish Sweep") is placed at the high of the candle, pointing downward, and an alert is triggered.
When to Be Used
The Trapped Traders Order Blocks indicator is best used in the following scenarios:
Reversal Trading:
Use this indicator to identify potential reversal points in the market. Bullish trap blocks suggest that trapped bears may unwind their short positions, leading to a potential bullish move. Bearish trap blocks suggest that trapped bulls may unwind their long positions, leading to a potential bearish move.
Look for sweeps of these blocks as confirmation of a directional move. A bullish sweep indicates a potential upward move, while a bearish sweep indicates a potential downward move.
Range-Bound Markets:
In sideways or ranging markets, trapped blocks can highlight key levels where large players have been caught off-guard. These levels often act as support or resistance, and a sweep of the block can signal a breakout or continuation in the direction of the sweep.
Confluence with Other Indicators:
Combine the trapped blocks with other technical analysis tools, such as support/resistance levels, Fibonacci retracements, or volume analysis, to increase the probability of a successful trade. For example, a bullish trap block near a strong support level with a bullish sweep can provide a high-probability setup for a long position, while a bearish trap block near a strong resistance level with a bearish sweep can signal a short opportunity.
Timeframes:
The indicator is most effective on higher timeframes such as 1-day (1D), 1-week (1W), and 1-month (1M) charts. These timeframes are more likely to capture significant moves involving large market participants, reducing noise and false signals compared to lower timeframes. While it can be used on lower timeframes (e.g., 1-hour or 4-hour), the signals may be less reliable due to increased market noise.
Logic Behind It
The logic behind the Trapped Traders Order Blocks indicator is rooted in market psychology and the behavior of large market participants ("big money"). When a large sweep candle occurs where price spikes in one direction but then quickly reverses it often indicates that traders have entered positions in the direction of the sweep, expecting a continuation. However, if the price immediately moves against them, these traders are now trapped in losing positions.
Bullish Trap Block (Bears Trapped):
A large bearish sweep candle (spiking upward but closing lower) suggests that bearish traders (bears) have entered short positions at the top of the move, expecting a downward continuation. If the next candle closes above the bearish candle's body, these bears are trapped in losing positions.
The body of the bearish candle becomes a "bullish trap block" because the trapped bears are likely to have placed their stop-loss orders or break-even exit orders just above the high of the sweep candle or within the body of the candle. As price revisits this level in the future, these trapped traders may attempt to unwind their positions by buying back their shorts, which can drive the price higher. This unwinding process often attracts new buyers, leading to a potential bullish reversal or continuation.
The bullish sweep conditions (e.g., close > box top, longer lower wick, and close above 50% of the range) ensure that the price action at the block level shows strong bullish momentum and rejection of lower prices, confirming the potential for a move higher.
Bearish Trap Block (Bulls Trapped):
A large bullish sweep candle (spiking downward but closing higher) suggests that bullish traders (bulls) have entered long positions at the bottom of the move, expecting an upward continuation. If the next candle closes below the bullish candle's body, these bulls are trapped in losing positions.
The body of the bullish candle becomes a "bearish trap block" because the trapped bulls are likely to have placed their stop-loss orders or break-even exit orders just below the low of the sweep candle or within the body of the candle. As price revisits this level in the future, these trapped traders may attempt to unwind their positions by selling their longs, which can drive the price lower. This unwinding process often attracts new sellers, leading to a potential bearish reversal or continuation.
The bearish sweep conditions (e.g., close < box bottom, longer upper wick, and close below 50% of the range) ensure that the price action at the block level shows strong bearish momentum and rejection of higher prices, confirming the potential for a move lower.
Summary
Bullish Trap Block: Occurs when bears get trapped after a bearish sweep candle is immediately followed by a bullish candle, indicating a potential reversal as trapped bears may unwind their positions.
Bearish Trap Block: Occurs when bulls get trapped after a bullish sweep candle is immediately followed by a bearish candle, indicating a potential bearish reversal.
Use Case: Ideal for identifying reversal opportunities, especially in range-bound markets or at key support/resistance levels on higher timeframes like 1D, 1W, and 1M, and can be combined with other indicators for confluence.
Logic: Large sweep candles followed by an immediate reversal suggest that big money has been trapped, and these traders may unwind their positions at break-even in the near future, driving price in the opposite direction of their initial trade.
This indicator provides a visual and actionable way to identify these trapped trader scenarios, with customizable settings for box display, sweep visuals, and alerts to help traders capitalize on these opportunities, particularly on higher timeframes where the signals are most reliable.

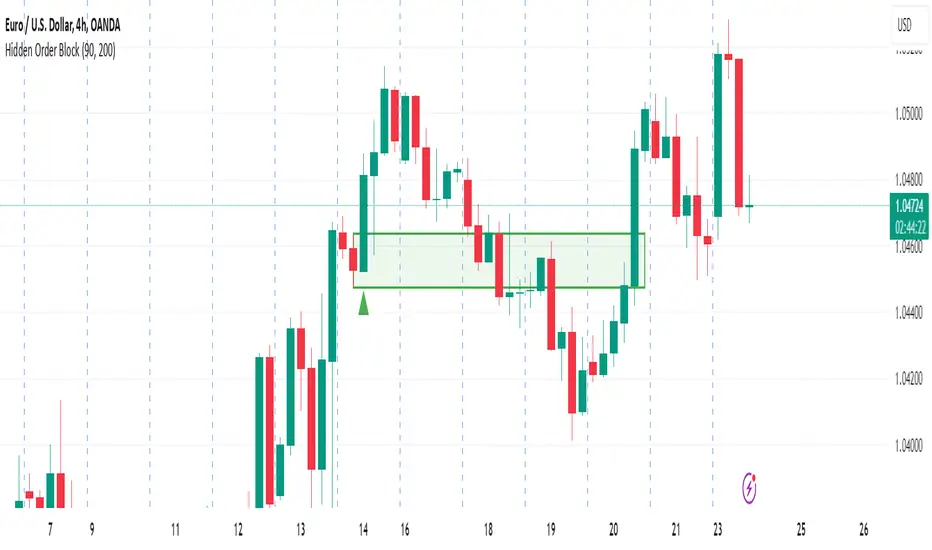
Hidden Order BlockThe Crystal Order Block Indicator is designed to help traders identify institutional order blocks with precision and reliability. By analyzing price action and volume behavior, this tool highlights high-probability zones where smart money has likely placed orders.
🔹 Key Features:
✅ Automated Order Block Detection – Identifies valid bullish & bearish order blocks based on price structure and volume dynamics.
✅ Unmitigated Order Block Filtering – Highlights fresh order blocks that haven’t been tapped, helping traders find high-probability trade setups.
✅ Smart Money Concepts (SMC) & ICT-Based Logic – Uses institutional trading principles to refine entry and exit points.
✅ Multi-Timeframe Compatibility – Works effectively on all timeframes, making it suitable for scalping, intraday, and swing trading.
✅ Customizable Alerts – Stay notified when a new order block forms, ensuring you never miss an opportunity.
✅ Risk Management Enhancement – Helps traders set precise stop-loss and take-profit levels based on institutional trading zones.
📌 How It Works:
The indicator scans price movements and detects areas where significant buying or selling pressure occurred, forming institutional order blocks. It then checks for mitigated vs. unmitigated order blocks, ensuring only the most relevant zones are displayed.
✔️ Bullish Order Blocks: Marked when a strong buying zone is detected, often acting as support.
✔️ Bearish Order Blocks: Identified in areas of strong selling pressure, often acting as resistance.
The indicator is optimized for Smart Money trading strategies, making it a valuable tool for traders who follow ICT, SMC, and VSA concepts.
🎯 How to Use It Effectively:
🔹 Entry Strategy: Wait for price to retest a fresh order block and confirm entry with additional confluences (e.g., volume spikes, price action signals).
🔹 Exit Strategy: Use order blocks as take-profit targets or stop-loss levels, improving risk-reward ratios.
🔹 Timeframe Recommendation: Best results on M30 and higher, but can be used on lower timeframes with additional confirmations.
🚀 What’s New in the Updated Version?
🔹 More Accurate Order Block Detection – Improved filtering for better precision.
🔹 Mitigation Tracking – Helps traders focus on fresh order blocks for higher success rates.
🔹 Better Visualization – Enhanced clarity for quick decision-making.
This indicator is a must-have for traders who want to trade like institutions and refine their trading strategy using smart money concepts.
ICT Concepts: MML, Order Blocks, FVG, OTECore ICT Trading Concepts
These strategies are designed to identify high-probability trading opportunities by analyzing institutional order flow and market psychology.
1. Market Maker Liquidity (MML) / Liquidity Pools
Idea: Institutional traders ("market makers") place orders around key price levels where retail traders’ stop losses cluster (e.g., above swing highs or below swing lows).
Application: Look for "liquidity grabs" where price briefly spikes to these levels before reversing.
Example: If price breaks a recent high but reverses sharply, it may indicate a liquidity grab to trigger retail stops before a trend reversal.
2. Order Blocks (OB)
Idea: Institutional orders are often concentrated in specific price zones ("order blocks") where large buy/sell decisions occurred.
Application: Identify bullish order blocks (strong buying zones) or bearish order blocks (strong selling zones) on higher timeframes (e.g., 1H/4H charts).
Example: A bullish order block forms after a strong rally; price often retests this zone later as support.
3. Fair Value Gap (FVG)
Idea: A price imbalance occurs when candles gap without overlapping, creating an area of "unfair" price that the market often revisits.
Application: Trade the retracement to fill the FVG. A bullish FVG acts as support, and a bearish FVG acts as resistance.
Example: Three consecutive candles create a gap; price later returns to fill this gap, offering a entry point.
4. Time-Based Analysis (NY Session, London Kill Zones)
Idea: Institutional activity peaks during specific times (e.g., 7 AM – 11 AM New York time).
Application: Focus on trades during high-liquidity periods when banks and hedge funds are active.
Example: The "London Kill Zone" (2 AM – 5 AM EST) often sees volatility due to European market openings.
5. Optimal Trade Entry (OTE)
Idea: A retracement level (similar to Fibonacci retracement) where institutions re-enter trends after a pullback.
Application: Look for 62–79% retracements in a trend to align with institutional accumulation/distribution zones.
Example: In an uptrend, price retraces 70% before resuming upward—enter long here.
6. Stop Hunts
Idea: Institutions manipulate price to trigger retail stop losses before reversing direction.
Application: Avoid placing stops at obvious levels (e.g., above/below recent swings). Instead, use wider stops or wait for confirmation.

Smart Money Concepts (Advanced)Inspired and initially based on LuxAlgo's Smart Money Concepts Indicator I created a library lib_smc that started to convert every function and return objects. This allowed certain customizations like tracking the current fill level of FVGs or tracking the creation of Order Blocks, by monitoring consecutive bars against the current trend.
This indicator is provided as is, based on, but probably not always be up to date with my lib_smc that I am using for my projects.
WARNING: This indicator shows EXPERIMENTAL Order Blocks that are tracked LIVE. Unlike usual Order Blocks these are not just based on the last confirmed Swing Point (formed 50 bars before) but on consecutive candles opposing an unconfirmed trend. Blocks are confirmed by price movements relative to the unconfirmed block and unconfirmed swing points. This means that some Order Blocks will appear on pullbacks, as well as reversals.
Features
Swing Points (HH / LH / HL / LL), indicating support / resistance zones price might reject off of or want to push through
Market Structure (BOS / ChoCh), indicates confirmation for a continued / changing trend
live Order Blocks (OB), see warning above.
Fair Value Gaps (FVG), optional from higher timeframes
Equal Highs / Lows (EQH/EQL), indicates strong support / resistance zones, especially when the bars forming it have long wicks toward that zone
using my lib_no_delay all moving averages are working from bar 0, so it can be used on charts with limited bars

SMC Order Block & Liquidity EntryThe SMC Order Block and Liquidity Trap Entry Strategy script uses Smart Money Concepts (SMC), which analyze institutional actions in the market, to assist traders in identifying high-probability trades. In order to help traders match their entry with institutional activity, this script highlights important regions of interest, including order blocks, liquidity zones, and indications for Break of Structure (BOS) or Change of Character (CHoCH).
The fundamental ideas of this approach, which focuses on regions where institutions frequently make sizable orders or sweep liquidity, are based on SMC principles. Order blocks, which are frequently important support or resistance zones when institutions are involved, are the final bullish or bearish candle before a significant price move in the other direction. There are liquidity zones that show where retail stop-loss orders build up (above recent highs or below recent lows), such as Buy-Side Liquidity (BSL) and Sell-Side Liquidity (SSL). Before changing the direction of the price, institutions could target these zones, giving traders possible chances.
The script depicts liquidity levels above or below recent highs and lows, automatically finds order blocks within a specified lookback time, and looks for BOS (a continuation signal) or CHoCH (a reversal signal). When liquidity retests inside an order block coincide with BOS or CHoCH circumstances, entry signals are produced. While short entries are triggered when the price breaks below the order block and SSL, long entry alerts are triggered when the price breaks above the order block and BSL.

Candle Range Theory | Flux Charts💎 GENERAL OVERVIEW
Introducing our new Candle Range Theory Indicator! This powerful tool offers a strategy built around the Candle Range Theory, which analyzes market movements through the relative size and structure of price candles. For more information about the process, check the "HOW DOES IT WORK" section.
Features of the new Candle Range Theory Indicator :
Implementation of the Candle Range Theory
FVG & Order Block Entry Methods
2 Different TP / SL Methods
Customizable Execution Settings
Customizable Backtesting Dashboard
Alerts for Buy, Sell, TP & SL Signals
📌 HOW DOES IT WORK ?
The Candle Range Theory (CRT) indicator operates by identifying significant price movements through the relative size and structure of candlesticks. A key part of the strategy is determining large candles based on their range compared to the Average True Range (ATR) in a higher timeframe. Once identified, a breakout of either the high wick or the low wick of the large candle is required. This breakout is considered a liquidity grab. After that, the indicator waits for confirmation through Fair Value Gaps (FVGs) or Order Blocks (OBs). The confirmation structure must be the opposite direction of the breakout, for example if the high wick is broken, a bearish FVG is required for the short entry. After a confirmation signal is received, the indicator will trigger entry points based on your chosen entry method (FVG or OB), and exit points will be calculated using either a dynamic ATR-based TP/SL method or fixed percentages. Alerts for Buy, Sell, Take-Proft, and Stop-Loss are available.
🚩 UNIQUENESS
This indicator stands out because it combines two highly effective entry methods: Fair Value Gaps (FVGs) and Order Blocks (OBs). You can choose between these strategies depending on market conditions. Additionally, the dynamic TP/SL system uses the ticker's volatility to automatically calculate stop-loss and take-profit targets. The backtesting dashboard provides metrics about the performance of the indicator. You can use it to tune the settings for best use in the current tiker. The Candle Range Theory approach offers more flexibility compared to traditional indicators, allowing for better customization and control based on your risk tolerance.
⚙️ SETTINGS
1. General Configuration
Higher Timeframe: Customize the higher timeframe for analysis. Recommended combinations include M15 -> H4, H4 -> Daily, Daily -> Weekly, and Weekly -> Monthly.
HTF Candle Size: Define the size of the higher timeframe candles as Big, Normal, or Small to filter valid setups based on their range relative to ATR.
Entry Mode: Choose between FVGs and Order Blocks for your entry triggers.
Require Retracement: Enable this option if you want a retracement to the FVG or OB for entry confirmation.
Show HTF Candle Lines: Toggle to display the higher timeframe candle lines for better visual clarity.
2. Fair Value Gaps
FVG Sensitivity: You may select between Low, Normal, High or Extreme FVG detection sensitivity. This will essentially determine the size of the spotted FVGs, with lower sensitivities resulting in spotting bigger FVGs, and higher sensitivities resulting in spotting all sizes of FVGs.
3. Order Blocks
Swing Length: Swing length is used when finding order block formations. Smaller values will result in finding smaller order blocks.
4. TP / SL
TP / SL Method:
a) Dynamic: The TP / SL zones will be auto-determined by the algorithm based on the Average True Range (ATR) of the current ticker.
b) Fixed : You can adjust the exact TP / SL ratios from the settings below.
Dynamic Risk: The risk you're willing to take if "Dynamic" TP / SL Method is selected. Higher risk usually means a better winrate at the cost of losing more if the strategy fails. This setting is has a crucial effect on the performance of the indicator, as different tickers may have different volatility so the indicator may have increased performance when this setting is correctly adjusted.

Smart Money Setup 06 [TradingFinder] Liquidity Sweeps + OB Swing🔵 Introduction
Smart Money, managed by large investors, injects significant capital into financial markets by entering real capital markets.
Capital entering the market by this group of individuals is called smart money. Traders can profit from financial markets by following such individuals.
Therefore, smart money can be considered one of the effective methods for analyzing financial markets.
Sometimes, before a market movement, fluctuation movements that create price movement cause many traders' "Stop Loss" to be triggered. These movements are created in various patterns.
One of these patterns is similar to an "Expanding Triangle", which touches the stop loss of individuals who have placed their stop loss in the cash area in the form of 5 consecutive openings.
To better understand this setup, pay attention to the images below.
Bullish Setup Details :
Bearish Setup Details :
🔵 How to Use
After adding the indicator to the chart, wait for trading opportunities to appear. By changing the "Time Frame" and "Pivot Period", you can see different trading positions.
In general, the smaller the "Time Frame" and "Pivot Period", the more likely trading opportunities will appear.
Bullish Setup Details on Chart :
Bearish Setup Details on Chart :
🔵 Settings
You have access to "Pivot Period", "Order Block Refine", and "Refine Mode" through settings.
By changing the "Pivot Period", you can change the range of zigzag that identifies the setup.
Through "Order Block Refine", you can specify whether you want to refine the width of the order blocks or not. It is set to "On" by default.
Through "Refine Mode", you can specify how to improve order blocks.
If you are "risk-averse", you should set it to "Defensive" mode because in this mode, the width of the order blocks decreases, the number of your trades decreases, and the "reward-to-risk ratio "increases.
If you are on the opposite side and are "risk-taker", you can set it to "Aggressive" mode. In this mode, the width of the order blocks increases, and the likelihood of losing positions decreases.

Trend Flow Profile [AlgoAlpha]Description:
The "Trend Flow Profile" indicator is a powerful tool designed to analyze and interpret the underlying trends and reversals in a financial market. It combines the concepts of Order Flow and Rate of Change (ROC) to provide valuable insights into market dynamics, momentum, and potential trade opportunities. By integrating these two components, the indicator offers a comprehensive view of market sentiment and price movements, facilitating informed trading decisions.
Rationale:
The combination of Order Flow and ROC in the "Trend Flow Profile" indicator stems from the recognition that both factors play critical roles in understanding market behavior. Order Flow represents the net buying or selling pressure in the market, while ROC measures the rate at which prices change. By merging these elements, the indicator captures the interplay between market participants' actions and the momentum of price movements, enabling traders to identify trends, spot reversals, and gauge the strength of price acceleration or deceleration.
Calculation:
The Order Flow component is computed by summing the volume when prices move up and subtracting the volume when prices move down. This cumulative measure reflects the overall order imbalance in the market, providing insights into the dominant buying or selling pressure.
The ROC component calculates the percentage change in price over a given period. It compares the current price to a previous price and expresses the change as a percentage. This measurement indicates the velocity and direction of price movement, allowing traders to assess the market's momentum.
How to Use It?
The "Trend Flow Profile" indicator offers valuable information to traders for making informed trading decisions. It enables the identification of underlying trends and potential reversals, providing a comprehensive view of market sentiment and momentum. Here are some key ways to utilize the indicator:
Spotting Trends: The indicator helps identify the prevailing market trend, whether bullish or bearish. A consistent positive (green) histogram indicates a strong uptrend, while a consistent negative (red) histogram suggests a robust downtrend.
Reversal Signals: Reversal patterns can be identified when the histogram changes color, transitioning from positive to negative (or vice versa). These reversals can signify potential turning points in the market, highlighting opportunities for counter-trend trades.
Momentum Assessment: By observing the width and intensity of the histogram, traders can assess the acceleration or deceleration of price momentum. A wider histogram suggests strong momentum, while a narrower histogram indicates a potential slowdown.
Utility:
The "Trend Flow Profile" indicator serves as a valuable tool for traders, providing several benefits. Traders can easily identify the prevailing market trend, enabling them to align their trading strategies with the dominant direction of the market. The indicator also helps spot potential reversals, allowing traders to anticipate market turning points and capture counter-trend opportunities. Additionally, the green and red histogram colors provide visual cues to determine the optimal duration of a long or short position. Following the green histogram signals when in a long position and the red histogram signals when in a short position can assist traders in managing their trades effectively. Moreover, the width and intensity of the histogram offer insights into the acceleration or deceleration of momentum. Traders can gauge the strength of price movements and adjust their trading strategies accordingly. By leveraging the "Trend Flow Profile" indicator, traders gain a comprehensive understanding of market dynamics, which enhances their decision-making and improves their overall trading outcomes.

DM Price ActionHere’s a tight, rules-based playbook for trading with your DM Price Action (FVG + S/R + Order Blocks + VWAP + Auto PDH/PDL/PMH/PML). It’s educational, not financial advice—tune to your market & risk.
Core ideas (what each tool does for you)
VWAP → intraday trend/mean.
PDH/PDL → yesterday’s extremes; magnet & reversal/continuation levels.
PMH/PML → premarket extremes; first liquidity tests after the open.
FVG → imbalance zones for continuation entries.
Order Blocks (OBs) → origin of impulses; mitigation/breaks = structure shifts.
S/R → target rails and break alerts.
Setups (long/short mirror)
1) Bias + Pullback (FVG/OB) at Key Level
Bias (need 2+ conditions):
Price above VWAP (bulls) / below VWAP (bears)
Price above PDH/PMH (bulls) or below PDL/PML (bears)
Most recent Swing OB bias in your direction (script updates via crosses)
Entry (bullish example):
Wait for a Bullish FVG to form after we reclaim PMH or PDH.
Prefer FVG overlapping a Bullish OB or sitting just above Support.
Enter on retrace into FVG midline or first bullish reversal candle inside.
Stop: a few ticks below OB low (or FVG bottom, whichever is wider).
Targets:
T1: nearest Resistance or PDH/PMH if not yet tested.
T2: next HTF S/R or fixed 2R–3R.
Manage: to BE at 1R, trail under swing lows or VWAP on trend days.
Bearish mirror: below VWAP, below PDL/PML, Bearish FVG into Bearish OB / Resistance; stop above OB high.
2) Range Break & Retest at PDH/PDL (with OB confirmation)
Context: Price consolidates under PDH (or over PDL).
Trigger: Clean break of PDH/PDL with an OB breakout alert in the break direction.
Entry: On retest of PDH/PDL from the other side, look for a small FVG forming with the move → enter on the pullback.
Stop: beyond the retest wick or the OB edge.
Targets: next S/R, opposing day extreme (e.g., from PDH to PMH/HTF level) or 2R/3R.
3) Premarket Sweep Reversal (open-specific)
Setup: At/near the cash open, price sweeps PMH/PML (wick through) but closes back inside, then a counter-direction OB forms.
Entry: On first FVG in the reversal direction that overlaps that new OB.
Stop: beyond the sweep extreme (PMH/PML).
Targets: VWAP first, then PD midline levels/SR.
Confluence checklist (score ≥3 before clicking)
+1 Above/below VWAP in trade direction
+1 Trading from a PDH/PDL/PMH/PML reaction (reclaim or rejection)
+1 FVG overlaps an OB
+1 Entry at S/R (use the script’s lines)
+1 Fresh zone (recently formed OB/FVG)
+1 Higher-TF structure aligned (e.g., 1H trend)
Take the trade only if score ≥3; size up only at ≥4.
Execution framework (simple & repeatable)
Timeframes: 1H (bias) → 5–15m (execution).
Risk per trade: 0.25–1.0% of account (fixed).
Position size: Size = Risk $ / Stop distance.
Management:
Scale ½ at T1 (nearest SR/PD level), move stop to BE at 1R.
Let runner to T2 (2R–3R) or next PD level.
If VWAP flips against you and closes 2 bars opposite, exit remainder.
Using the inputs (what to tweak)
Order Blocks:
Scalping mode for intraday speed; Day Trade for cleaner swings.
Hide Internal OBs if noise is high; keep Swing OBs for structure.
FVG:
Keep Auto Threshold = ON.
If noisy, plot higher TF FVG (e.g., 15m FVG on 5m chart).
PDH/PDL/PMH/PML:
If chart is cluttered, keep “Show lines only on last bar” ON and labels ON.
Session markets (futures/US equities): use default 0400–0930 premarket; FX/crypto can disable PM lines if irrelevant.
Alerts to set (so you only act on confluence)
Create alerts for:
Bullish/Bearish FVG (execution zones)
Swing/Internal OB Breakout (structure shift)
Support/Resistance Broken (targets/continuation)
(Optional) Crossing PDH/PDL: use TV “Price crossing” with the plotted PDH/PDL values or visually monitor the labels
Workflow: Wait for ≥2 alerts to line up (e.g., Swing OB Breakout + Bullish FVG near PDH), then open the chart and execute the rule set.
Example trade (bullish)
Price reclaims PDH, holds above VWAP.
Bullish FVG prints overlapping a Bullish Internal OB just above PDH.
Limit at FVG midline, stop below OB low.
T1 = next Resistance; T2 = 2R. Move to BE at 1R; trail under new swing lows.
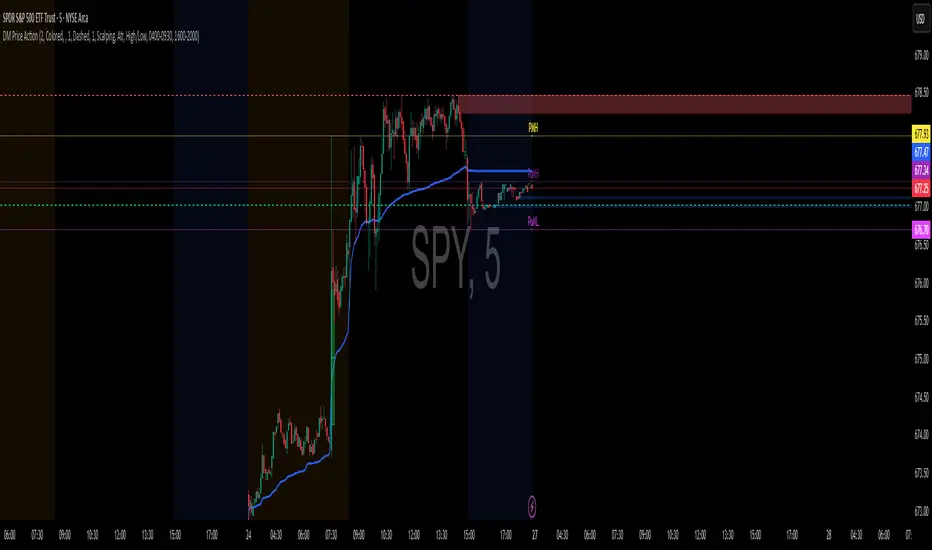
EMA Order IndicatorPaints background as per the EMA order.
White when there is no order / mixed.
Red when bearish order
Green when bullish order
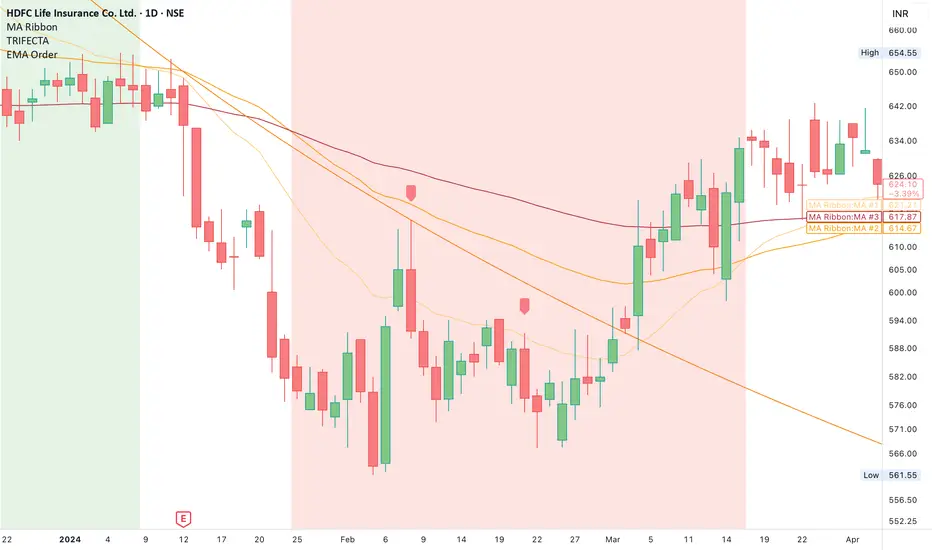
Smart Money Precision Structure [BullByte]Smart Money Precision Structure
Advanced Market Structure Analysis Using Institutional Order Flow Concepts
---
OVERVIEW
Smart Money Precision Structure (SMPS) is a comprehensive market analysis indicator that combines six analytical frameworks to identify high-probability market structure patterns. The indicator uses multi-dimensional scoring algorithms to evaluate market conditions through institutional order flow concepts, providing traders with professional-grade market analysis.
---
PURPOSE AND ORIGINALITY
Why This Indicator Was Developed
• Addresses the gap between retail and institutional analysis methods
• Consolidates multiple analysis techniques that professionals use separately
• Automates complex market structure evaluation into actionable insights
• Eliminates the need for multiple indicators by providing comprehensive analysis
What Makes SMPS Original
• Six-Layer Confluence System - Unique combination of market regime, structure, volume flow, momentum, price action, and adaptive filtering
• Institutional Pattern Recognition - Identifies smart money accumulation and distribution patterns
• Adaptive Intelligence - Parameters automatically adjust based on detected market conditions
• Real-Time Market Scoring - Proprietary algorithm rates market quality from 0-100%
• Structure Break Detection - Advanced pivot analysis identifies trend reversals early
---
HOW IT WORKS - TECHNICAL METHODOLOGY
1. Market Regime Analysis Engine
The indicator evaluates five core market dimensions:
• Volatility Score - Measures current volatility against 50-period historical baseline
• Trend Score - Analyzes alignment between 8, 21, and 50-period EMAs
• Momentum Score - Combines RSI divergence with MACD signal alignment
• Structure Score - Evaluates pivot point formation clarity
• Efficiency Score - Calculates directional movement efficiency ratio
These scores combine to classify markets into five regimes:
• TRENDING - Strong directional movement with aligned indicators
• RANGING - Sideways movement with mixed directional signals
• VOLATILE - Elevated volatility with unpredictable price swings
• QUIET - Low volatility consolidation periods
• TRANSITIONAL - Market shifting between different regimes
2. Market Structure Analysis
Advanced pivot point analysis identifies:
• Higher Highs and Higher Lows for bullish structure
• Lower Highs and Lower Lows for bearish structure
• Structure breaks when established patterns fail
• Dynamic support and resistance from recent pivot points
• Key level proximity detection using ATR-based buffers
3. Volume Flow Decoding
Institutional activity detection through:
• Volume surge identification when volume exceeds 2x average
• Buy versus sell pressure analysis using price-volume correlation
• Flow strength measurement through directional volume consistency
• Divergence detection between volume and price movements
• Institutional threshold alerts when unusual volume patterns emerge
4. Multi-Period Momentum Synthesis
Weighted momentum calculation across four timeframes:
• 1-period momentum weighted at 40%
• 3-period momentum weighted at 30%
• 5-period momentum weighted at 20%
• 8-period momentum weighted at 10%
Result smoothed with 6-period EMA for noise reduction.
5. Price Action Quality Assessment
Each bar evaluated for:
• Range quality relative to 20-period average
• Body-to-range ratio for directional conviction
• Wick analysis for rejection pattern identification
• Pattern recognition including engulfing and hammer formations
• Sequential price movement analysis
6. Adaptive Parameter System
Parameters automatically adjust based on detected regime:
• Trending markets reduce sensitivity and confirmation requirements
• Volatile markets increase filtering and require additional confirmations
• Ranging markets maintain neutral settings
• Transitional markets use moderate adjustments
---
COMPLETE SETTINGS GUIDE
Section 1: Core Analysis Settings
Analysis Sensitivity (0.3-2.0)
• Default: 1.0
• Lower values require stronger price movements
• Higher values detect more subtle patterns
• Scalpers use 0.8-1.2, swing traders use 1.5-2.0
Noise Reduction Level (2-7)
• Default: 4
• Controls filtering of false patterns
• Higher values reduce pattern frequency
• Increase in volatile markets
Minimum Move % (0.05-0.50)
• Default: 0.15%
• Sets minimum price movement threshold
• Adjust based on instrument volatility
• Forex: 0.05-0.10%, Stocks: 0.15-0.25%, Crypto: 0.20-0.50%
High Confirmation Mode
• Default: True (Enabled)
• Requires all technical conditions to align
• Reduces frequency but increases reliability
• Disable for more aggressive pattern detection
Section 2: Market Regime Detection
Enable Regime Analysis
• Default: True (Enabled)
• Activates market environment evaluation
• Essential for adaptive features
• Keep enabled for best results
Regime Analysis Period (20-100)
• Default: 50 bars
• Determines regime calculation lookback
• Shorter for responsive, longer for stable
• Scalping: 20-30, Swing: 75-100
Minimum Market Clarity (0.2-0.8)
• Default: 0.4
• Quality threshold for pattern generation
• Higher values require clearer conditions
• Lower for more patterns, higher for quality
Adaptive Parameter Adjustment
• Default: True (Enabled)
• Enables automatic parameter optimization
• Adjusts based on market regime
• Highly recommended to keep enabled
Section 3: Market Structure Analysis
Enable Structure Validation
• Default: True (Enabled)
• Validates patterns against support/resistance
• Confirms trend structure alignment
• Essential for reliability
Structure Analysis Period (15-50)
• Default: 30 bars
• Period for structure pattern analysis
• Affects support/resistance calculation
• Match to your trading timeframe
Minimum Structure Alignment (0.3-0.8)
• Default: 0.5
• Required structure score for valid patterns
• Higher values need stronger structure
• Balance with desired frequency
Section 4: Analysis Configuration
Minimum Strength Level (3-5)
• Default: 4
• Minimum confirmations for pattern display
• 5 = Maximum reliability, 3 = More patterns
• Beginners should use 4-5
Required Technical Confirmations (4-6)
• Default: 5
• Number of aligned technical factors
• Higher = fewer but better patterns
• Works with High Confirmation Mode
Pattern Separation (3-20 bars)
• Default: 8 bars
• Minimum bars between patterns
• Prevents clustering and overtrading
• Increase for cleaner charts
Section 5: Technical Filters
Momentum Validation
• Default: True (Enabled)
• Requires momentum alignment
• Filters counter-trend patterns
• Essential for trend following
Volume Confluence Analysis
• Default: True (Enabled)
• Requires volume confirmation
• Identifies institutional participation
• Critical for reliability
Trend Direction Filter
• Default: True (Enabled)
• Only shows patterns with trend
• Reduces counter-trend signals
• Disable for reversal hunting
Section 6: Volume Flow Analysis
Institutional Activity Threshold (1.2-3.5)
• Default: 2.0
• Multiplier for unusual volume detection
• Lower finds more institutional activity
• Stock: 2.0-2.5, Forex: 1.5-2.0, Crypto: 2.5-3.5
Volume Surge Multiplier (1.8-4.5)
• Default: 2.5
• Defines significant volume increases
• Adjust per instrument characteristics
• Higher for stocks, lower for forex
Volume Flow Period (12-35)
• Default: 18 bars
• Smoothing for volume analysis
• Shorter = responsive, longer = smooth
• Match to timeframe used
Section 7: Analysis Frequency Control
Maximum Analysis Points Per Hour (1-5)
• Default: 3
• Limits pattern frequency
• Prevents overtrading
• Scalpers: 4-5, Swing traders: 1-2
Section 8: Target Level Configuration
Target Calculation Method
• Default: Market Adaptive
• Three modes available:
- Fixed: Uses set point distances
- Dynamic: ATR-based calculations
- Market Adaptive: Structure-based levels
Minimum Target/Risk Ratio (1.0-3.0)
• Default: 1.5
• Minimum acceptable reward vs risk
• Higher filters lower probability setups
• Professional standard: 1.5-2.0
Fixed Mode Settings:
• Fixed Target Distance: 50 points default
• Fixed Invalidation Distance: 30 points default
• Use for consistent instruments
Dynamic Mode Settings:
• Dynamic Target Multiplier: 1.8x ATR default
• Dynamic Invalidation Multiplier: 1.0x ATR default
• Adapts to volatility automatically
Market Adaptive Settings:
• Use Structure Levels: True (default)
• Structure Level Buffer: 0.1% default
• Places levels at actual support/resistance
Section 9: Visual Display Settings
Color Theme Options
• Professional (Teal/Red)
- Bullish: Teal (#26a69a)
- Bearish: Red (#ef5350)
- Neutral: Gray (#78909c)
- Best for: Traditional traders, clean appearance
• Dark (Neon Green/Pink)
- Bullish: Neon Green (#00ff88)
- Bearish: Hot Pink (#ff0044)
- Neutral: Dark Gray (#333333)
- Best for: Dark theme users, high contrast
• Light (Green/Red Classic)
- Bullish: Green (#4caf50)
- Bearish: Red (#f44336)
- Neutral: Light Gray (#9e9e9e)
- Best for: Light backgrounds, traditional colors
• Vibrant (Cyan/Magenta)
- Bullish: Cyan (#00ffff)
- Bearish: Magenta (#ff00ff)
- Neutral: Medium Gray (#888888)
- Best for: High visibility, modern appearance
Dashboard Position
• Options: Top Left, Top Right, Bottom Left, Bottom Right, Middle Left, Middle Right
• Default: Top Right
• Choose based on chart layout preference
Dashboard Size
• Full: Complete information display (desktop)
• Mobile: Compact view for small screens
• Default: Full
Analysis Display Style
• Arrows : Simple directional markers
• Labels : Detailed text information
• Zones : Colored areas showing pattern regions
• Default: Labels (most informative)
Display Options:
• Display Analysis Strength: Shows star rating
• Display Target Levels: Shows target/invalidation lines
• Display Market Regime: Shows regime in pattern labels
---
HOW TO USE SMPS - DETAILED GUIDE
Understanding the Dashboard
Top Row - Header
• SMPS Dashboard title
• VALUE column: Current readings
• STATUS column: Condition assessments
Market Regime Row
• Shows: TRENDING, RANGING, VOLATILE, QUIET, or TRANSITIONAL
• Color coding: Green = Favorable, Red = Caution
• Status: FAVORABLE or CAUTION trading conditions
Market Score Row
• Percentage from 0-100%
• Above 60% = Strong conditions
• 40-60% = Moderate conditions
• Below 40% = Weak conditions
Structure Row
• Direction: BULLISH, BEARISH, or NEUTRAL
• Status: INTACT or BREAK
• Orange BREAK indicates structure failure
Volume Flow Row
• Direction: BUYING or SELLING
• Intensity: STRONG or WEAK
• Color indicates dominant pressure
Momentum Row
• Numerical momentum value
• Positive = Upward pressure
• Negative = Downward pressure
Volume Status Row
• INST = Institutional activity detected
• HIGH = Above average volume
• NORM = Normal volume levels
Adaptive Mode Row
• ACTIVE = Parameters adjusting
• STATIC = Fixed parameters
• Shows required confirmations
Analysis Level Row
• Minimum strength level setting
• Pattern separation in bars
Market State Row
• Current analysis: BULLISH, BEARISH, NEUTRAL
• Shows analysis price level when active
T:R Ratio Row
• Current target to risk ratio
• GOOD = Meets minimum requirement
• LOW = Below minimum threshold
Strength Row
• BULL or BEAR dominance
• Numerical strength value 0-100
Price Row
• Current price
• Percentage change
Last Analysis Row
• Previous pattern direction
• Bars since last pattern
Reading Pattern Signals
Bullish Structure Pattern
• Upward triangle or "Bullish Structure" label
• Star rating shows strength (★★★★★ = strongest)
• Green line = potential target level
• Red dashed line = invalidation level
• Appears below price bars
Bearish Structure Pattern
• Downward triangle or "Bearish Structure" label
• Star rating indicates reliability
• Green line = potential target level
• Red dashed line = invalidation level
• Appears above price bars
Pattern Strength Interpretation
• ★★★★★ = 6 confirmations (exceptional)
• ★★★★☆ = 5 confirmations (strong)
• ★★★☆☆ = 4 confirmations (moderate)
• ★★☆☆☆ = 3 confirmations (minimum)
• Below minimum = filtered out
Visual Elements on Chart
Lines and Levels:
• Gray Line = 21 EMA trend reference
• Green Stepline = Dynamic support level
• Red Stepline = Dynamic resistance level
• Green Solid Line = Active target level
• Red Dashed Line = Active invalidation level
Pattern Markers:
• Triangles = Arrow display mode
• Text Labels = Label display mode
• Colored Boxes = Zone display mode
Target Completion Labels:
• "Target" = Price reached target level
• "Invalid" = Pattern invalidated by price
---
RECOMMENDED USAGE BY TIMEFRAME
1-Minute Charts (Scalping)
• Sensitivity: 0.8-1.2
• Noise Reduction: 3-4
• Pattern Separation: 3-5 bars
• High Confirmation: Optional
• Best for: Quick intraday moves
5-Minute Charts (Precision Intraday)
• Sensitivity: 1.0 (default)
• Noise Reduction: 4 (default)
• Pattern Separation: 8 bars
• High Confirmation: Enabled
• Best for: Day trading
15-Minute Charts (Short Swing)
• Sensitivity: 1.0-1.5
• Noise Reduction: 4-5
• Pattern Separation: 10-12 bars
• High Confirmation: Enabled
• Best for: Intraday swings
30-Minute to 1-Hour (Position Trading)
• Sensitivity: 1.5-2.0
• Noise Reduction: 5-7
• Pattern Separation: 15-20 bars
• Regime Period: 75-100
• Best for: Multi-day positions
Daily Charts (Swing Trading)
• Sensitivity: 1.8-2.0
• Noise Reduction: 6-7
• Pattern Separation: 20 bars
• All filters enabled
• Best for: Long-term analysis
---
MARKET-SPECIFIC SETTINGS
Forex Pairs
• Minimum Move: 0.05-0.10%
• Institutional Threshold: 1.5-2.0
• Volume Surge: 1.8-2.2
• Target Mode: Dynamic or Market Adaptive
Stock Indices (ES, NQ, YM)
• Minimum Move: 0.10-0.15%
• Institutional Threshold: 2.0-2.5
• Volume Surge: 2.5-3.0
• Target Mode: Market Adaptive
Individual Stocks
• Minimum Move: 0.15-0.25%
• Institutional Threshold: 2.0-2.5
• Volume Surge: 2.5-3.5
• Target Mode: Dynamic
Cryptocurrency
• Minimum Move: 0.20-0.50%
• Institutional Threshold: 2.5-3.5
• Volume Surge: 3.0-4.5
• Target Mode: Dynamic
• Increase noise reduction
---
PRACTICAL APPLICATION EXAMPLES
Example 1: Strong Trending Market
Dashboard Reading:
• Market Regime: TRENDING
• Market Score: 75%
• Structure: BULLISH, INTACT
• Volume Flow: BUYING, STRONG
• Momentum: +0.45
Interpretation:
• Strong uptrend environment
• Institutional buying present
• Look for bullish patterns as continuation
• Higher probability of success
• Consider using lower sensitivity
Example 2: Range-Bound Conditions
Dashboard Reading:
• Market Regime: RANGING
• Market Score: 35%
• Structure: NEUTRAL
• Volume Flow: SELLING, WEAK
• Momentum: -0.05
Interpretation:
• No clear direction
• Low opportunity environment
• Patterns are less reliable
• Consider waiting for regime change
• Or switch to a range-trading approach
Example 3: Structure Break Alert
Dashboard Reading:
• Previous: BULLISH structure
• Current: Structure BREAK
• Volume: INST flag active
• Momentum: Shifting negative
Interpretation:
• Trend reversal potentially beginning
• Institutional participation detected
• Watch for bearish pattern confirmation
• Adjust bias accordingly
• Increase caution on long positions
Example 4: Volatile Market
Dashboard Reading:
• Market Regime: VOLATILE
• Market Score: 45%
• Adaptive Mode: ACTIVE
• Confirmations: Increased to 6
Interpretation:
• Choppy conditions
• Parameters auto-adjusted
• Fewer but higher quality patterns
• Wider stops may be needed
• Consider reducing position size
Below are a few chart examples of the Smart Money Precision Structure (SMPS) indicator in action.
• Example 1 – Bullish Structure Detection on SOLUSD 5m
• Example 2 – Bearish Structure Detected with Strong Confluence on SOLUSD 5m
---
TROUBLESHOOTING GUIDE
No Patterns Appearing
Check these settings:
• High Confirmation Mode may be too restrictive
• Minimum Strength Level may be too high
• Market Clarity threshold may be too high
• Regime filter may be blocking patterns
• Try increasing sensitivity
Too Many Patterns
Adjust these settings:
• Enable High Confirmation Mode
• Increase Minimum Strength Level to 5
• Increase Pattern Separation
• Reduce Sensitivity below 1.0
• Enable all technical filters
Dashboard Shows "CAUTION"
This indicates:
• Market conditions are unfavorable
• Regime is RANGING or QUIET
• Market score is low
• Consider waiting for better conditions
• Or adjust expectations accordingly
Patterns Not Reaching Targets
Consider:
• Market may be choppy
• Volatility may have changed
• Try Dynamic target mode
• Reduce target/risk ratio requirement
• Check if regime is VOLATILE
---
ALERTS CONFIGURATION
Alert Message Format
Alerts include:
• Pattern type (Bullish/Bearish)
• Strength rating
• Market regime
• Analysis price level
• Target and invalidation levels
• Strength percentage
• Target/Risk ratio
• Educational disclaimer
Setting Up Alerts
• Click Alert button on TradingView
• Select SMPS indicator
• Choose alert frequency
• Customize message if desired
• Alerts fire on pattern detection
---
DATA WINDOW INFORMATION
The Data Window displays:
• Market Regime Score (0-100)
• Market Structure Bias (-1 to +1)
• Bullish Strength (0-100)
• Bearish Strength (0-100)
• Bull Target/Risk Ratio
• Bear Target/Risk Ratio
• Relative Volume
• Momentum Value
• Volume Flow Strength
• Bull Confirmations Count
• Bear Confirmations Count
---
BEST PRACTICES AND TIPS
For Beginners
• Start with default settings
• Use High Confirmation Mode
• Focus on TRENDING regime only
• Paper trade first
• Learn one timeframe thoroughly
For Intermediate Users
• Experiment with sensitivity settings
• Try different target modes
• Use multiple timeframes
• Combine with price action analysis
• Track pattern success rate
For Advanced Users
• Customize per instrument
• Create setting templates
• Use regime information for bias
• Combine with other indicators
• Develop systematic rules
---
IMPORTANT DISCLAIMERS
• This indicator is for educational and informational purposes only
• Not financial advice or a trading system
• Past performance does not guarantee future results
• Trading involves substantial risk of loss
• Always use appropriate risk management
• Verify patterns with additional analysis
• The author is not a registered investment advisor
• No liability accepted for trading losses
---
VERSION NOTES
Version 1.0.0 - Initial Release
• Six-layer confluence system
• Adaptive parameter technology
• Institutional volume detection
• Market regime classification
• Structure break identification
• Real-time dashboard
• Multiple display modes
• Comprehensive settings
## My Final Thoughts
Smart Money Precision Structure represents an advanced approach to market analysis, bringing institutional-grade techniques to retail traders through intelligent automation and multi-dimensional evaluation. By combining six analytical frameworks with adaptive parameter adjustment, SMPS provides comprehensive market intelligence that single indicators cannot achieve.
The indicator serves as an educational tool for understanding how professional traders analyze markets, while providing practical pattern detection for those seeking to improve their technical analysis. Remember that all trading involves risk, and this tool should be used as part of a complete analysis approach, not as a standalone trading system.
- BullByte

Delta Volume BubblesDelta Volume Bubbles
Overview
The Delta Volume Bubbles indicator is an advanced order flow visualization tool that displays buying and selling pressure through dynamic bubble representations on your chart. Unlike traditional volume indicators that only show total volume, this indicator calculates the net delta volume (difference between buying and selling volume) and presents it as color-coded bubbles of varying sizes.
How It Works
Core Calculation Method
The indicator uses a sophisticated approach to estimate delta volume from standard OHLCV data:
1. Price Action Analysis: Analyzes the relationship between open, high, low, and close prices to determine market aggression
2. Body Ratio Calculation: body_ratio = |close - open| / (high - low)
3. Aggressive Factor: Applies multipliers based on price action:
- Strong moves (body_ratio > 0.7): 1.5x multiplier
- Moderate moves (body_ratio > 0.4): 1.2x multiplier
- Weak moves: 1.0x multiplier
4. Delta Volume Estimation:
- Buy Volume: price_change > 0 ? volume × aggressive_factor : 0
- Sell Volume: price_change < 0 ? volume × aggressive_factor : 0
- Net Delta: buy_volume - sell_volume
5. Delta Strength Normalization: delta_strength = |net_delta| / sma(volume, 20)
Percentile-Based Filtering
The indicator uses percentile filtering instead of fixed thresholds, making it adaptive to market conditions:
- Bubble Filter: Only shows bubbles when volume exceeds the specified percentile (default: 60%)
- Label Filter: Only displays numbers when volume exceeds a higher percentile (default: 90%)
- Dynamic Adaptation: Automatically adjusts to changing market volatility
Visual Elements
Bubble Sizes
- Tiny: Delta strength < 0.3
- Small: Delta strength 0.3 - 0.7
- Normal: Delta strength 0.7 - 1.2
- Large: Delta strength 1.2 - 2.0
- Huge: Delta strength > 2.0
Color Coding
- Aggressive Buy (Bright Green): Strong buying pressure with high body ratio
- Aggressive Sell (Bright Red): Strong selling pressure with high body ratio
- Passive Buy (Light Green): Moderate buying pressure
- Passive Sell (Light Red): Moderate selling pressure
Intensity Mode
Alternative coloring based on delta strength rather than flow direction:
- Gray: Low intensity (< 0.5)
- Blue: Medium intensity (0.5 - 1.0)
- Orange: High intensity (1.0 - 2.0)
- Red: Extreme intensity (> 2.0)
Parameters
Order Flow Settings
- Show Bubbles: Toggle bubble display on/off
- Bubble Volume %ile: Percentile threshold for bubble display (0-100%)
- Intensity Mode: Switch between flow-based and intensity-based coloring
Bubble Labels
- Show Numbers in Bubbles: Toggle numerical labels on/off
- Label Volume %ile: Higher percentile threshold for label display (0-100%)
Numbers are displayed in K-notation (e.g., 25000 → 25K, 1500000 → 1.5M) for better readability.
Ideal Usage Scenarios
Best Market Conditions
- High volume sessions: More accurate delta calculations
- Trending markets: Clear directional flow identification
- Breakout scenarios: Spot aggressive buying/selling at key levels
- Support/resistance testing: Identify accumulation vs distribution
Trading Applications
1. Entry Timing: Look for aggressive flow in your trade direction
2. Exit Signals: Watch for opposing aggressive flow
3. Trend Confirmation: Consistent flow direction confirms trends
4. Volume Climax: Huge bubbles may indicate exhaustion points
Optimization Tips
Parameter Adjustment
- Lower percentiles (40-60%): More bubbles, good for active markets
- Higher percentiles (70-90%): Fewer bubbles, focus on significant events
- Label percentile: Set 20-30% higher than bubble percentile for clarity
Visual Optimization
- Intensity mode: Better for identifying unusual volume spikes
- Flow mode: Better for directional bias analysis
- Label toggle: Turn off in crowded markets, on for key levels
Limitations
- Estimation-based: Uses approximation algorithms, not true order flow data
- Volume dependency: Requires accurate volume data to function properly
- Timeframe sensitivity: Works best on intraday timeframes with active volume
- Market hours: Most effective during high-volume trading sessions
Technical Notes
The indicator implements advanced Pine Script features including:
- Dynamic percentile calculations using ta.percentile_linear_interpolation()
- Conditional plotting with multiple size categories
- Custom number formatting functions
- Efficient label management to prevent display limits
This tool is designed for traders who want to understand the underlying buying and selling pressure beyond simple volume analysis, providing insights into market sentiment and potential turning points.

Supply & Demand Zones + Order Block (Pro Fusion) SuroLevel up your trading edge with this all-in-one Supply and Demand Zones + Order Block TradingView indicator, built for precision traders who focus on price action and smart money concepts.
🔍 Key Features:
Automatic detection of Supply & Demand Zones based on refined swing highs and lows
Dynamic Order Block recognition with customizable thresholds
Highlights Breakout signals with volume confirmation and trend filters
Built-in EMA 50 trend detection
Take Profit (TP1, TP2, TP3) projection levels
Clean visual labels for Demand, Supply, and OB zones
Uses smart box plotting with long extended zones for better zone visibility
🔥 Ideal for:
Traders who follow Smart Money Concepts (SMC)
Supply & Demand strategy practitioners
Breakout & Retest pattern traders
Scalpers, swing, and intraday traders using Order Flow logic
📈 Works on all markets: Forex, Crypto, Stocks, Indices
📊 Recommended timeframes: M15, H1, H4, Daily
✅ Enhance your trading strategy using this powerful zone-based script — bringing structure, clarity, and automation to your chart.
#SupplyAndDemand #OrderBlock #TradingViewScript #SmartMoney #BreakoutStrategy #TPProjection #ForexIndicator #SMC

Perfect Order Alert USDJPY/BTCUSD/XAUUSDPerfect Order Alert USDJPY/BTCUSD/XAUUSD 日本語解説は下記
This indicator detects the perfect order of three moving averages and displays on the Panel in an easy-to-understand visual manner whether there is an uptrend, downtrend, or non-trend for each time leg.
This indicator detects perfect orders for the three currency pairs USDJPY/BTCUSD/XAUUSD on the 5-minute, 15-minute, 1-hour, and 4-hour time frames, and displays them on the Panel on the chart, with “▲” for up, “▼” for down, and “ー” for non-trend, so that you can quickly determine the trend. The panel is displayed on the chart.
In order to check for perfect orders without missing them, it is also possible to set up alerts that notify you of all the time frames and currency pairs as well.
Functions
Displaying 4H, 1H, 15M, 5M, up (▲), down (▼), other (-), of USDJPY/BTCUSD/XAUUSD on the panel.
*(By default, 20EMA, 75EMA, and 200EMA are hidden.)
Display position setting of the panel (You can choose from upper left, upper top, upper right, lower left, lower bottom, or lower right).
Panel color and text color change function
The moving average line can be hidden by default.
Moving average period change
Moving average color and thickness can be changed.
EMA/SMA switchable
Alert function - One alert can be set for each currency pair and time frame ▲▼, which is very useful.
Perfect Order Alert
You can use it even if you have a free account with only one alert setting.
To use the alert function, go to the Tradingview default alert settings, select “USDJPY/BTCUSD/XAUUSD” for the top item of conditions, and select “Call Alert() function” in the frame just below it!
_* Supplementary explanation: ____________
Please note that due to the limitation of the script, only 3 currency pairs and 4 time frames are displayed with 12 items (Panels for currency pairs other than USDJPY/BTCUSD/XAUUSD are also created, but they are indicators for other scripts, so if you are interested in other currency pairs, please use those. If you are interested in other currency pairs, please use them.)
Please note that we may change the functions or delete the indicator itself without prior notice.
Translated with DeepL.com (free version)
Reference image of the setting screenReference image of the setting screen
設定画面参考画像
3本の移動平均線のパーフェクトオーダーを検知し、時間足ごとに上昇トレンドか下降トレンドかノントレンドかを視覚的にわかりやすくPanelに表示するインジゲーターです。
このインジゲーターは、USDJPY/BTCUSD/XAUUSDの3通貨ペアの5分足、15分足、1時間足、4時間足のパーフェクトオーダーを検知して、チャートに表示されるPanelに、上昇は「▲」下降は「▼」ノントレンドは「ー」と、すぐに判断できる表示にしてあります。
パーフェクトオーダーを逃さずチェックできるように、それぞれの時間足や通貨ペアも全てを通知してくれるアラート設定が可能なのも特徴です。
機能紹介
・USDJPY/BTCUSD/XAUUSDの4H,1H,15M,5M,の上昇(▲),下降(▼),その他(-),をパネルに表示
※(デフォルトでは20EMA,75EMA,200EMAの3本で非表示にしてあります)
・パネルの表示位置設定(左上、上、右上、左下、下、右下、から選択できます。)
・パネルの色とテキスト色変更機能
・移動平均線表示非表示機能(デフォルトでは表示OFFにしてあります。)
・移動平均線期間変更
・移動平均線色と太さ変更
・EMA/SMA切り替え可能
・アラート機能ー1つのアラート設定で通貨ペアと時間足▲▼一つ一つを細かく教えてくれるので便利。
※パーフェクト オーダーアラート
無料アカウントで1つしかアラート設定できなくても使えます。
アラート機能はTradingviewデフォルトのアラート設定から、条件の一番上の項目を「USDJPY/BTCUSD/XAUUSD」選択、そのすぐ下の枠に「Alert()関数の呼び出し」を選択でOK!
_※ 補足説明____________
・スクリプトの制限の為、3通貨ペアと4つの時間足の12項目で表示させていますのでご了承ください
(USDJPY/BTCUSD/XAUUSD以外の通貨ペアのPanelも作成していますが別スクリプトのインジゲーターになりますので他の通貨ペアも興味がある方はそちらをお使いください)
・予告なしで機能の変更やインジゲーター自体の削除等行う事もあるかもなのでご了承ください。
