Tìm kiếm tập lệnh với "oscillator"
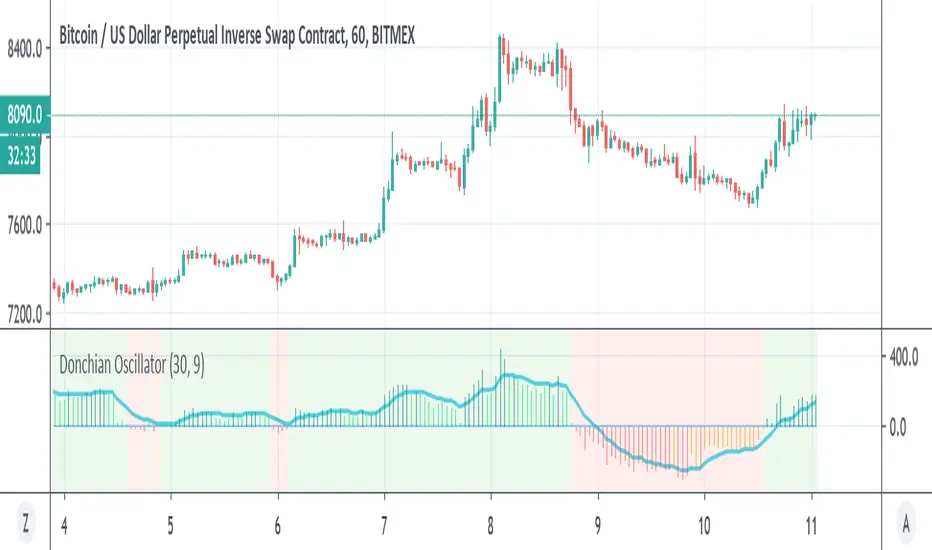
Donchian OscillatorSimple Oscillator based on Donchian line
above zero is in lime=bullish
bellow zero is in red =bearish
signal line in blue
RSI Oscillator by mattzabRSI-Oscillator is designed to be highly visual, based on strategies that recognize the RSI above 50 to be positive strength, and below 50 to be weakness.
Midpoint is 50, above is blue, below is red.

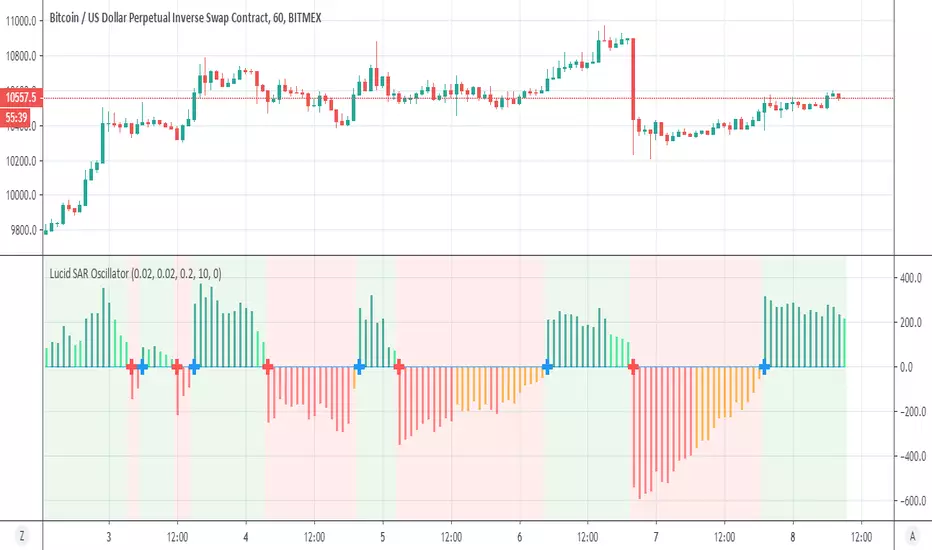
Lucid SAR OscillatorI like very much the Lucid SAR
so I converted it to oscillator adding alerts
blue cross =sar up and red cross= sar down as you see it fit perfect to the original Lucid SAR
Klinger Oscillator with signal 18 period EMA by MKMUNIR3Signal line in this modified oscillator is based on higher period EMA so that it does not give signals of buying and selling very frequently. It is able to cut off the very short period movements so that the trader has the confidence of a trend for considerable time to remain in a trade.


Linda Raschke - 3/10 oscillator The MACD indicator is very useful when thinking of it in terms of momentum and trend and not as a holy grail.
There are many settings that can be used and I prefer to use the settings that reflect the 3/10 oscillator (Raschke).
While you can simply input the numbers 3,10,16 into your standard MACD, the proper 3/10 uses simple averages.

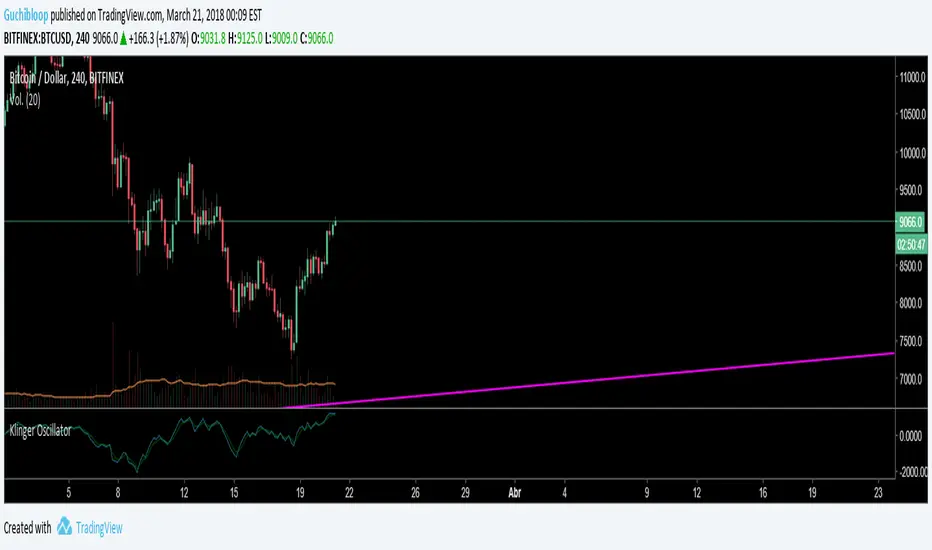
Klinger Oscillator 3DAYEMASIGNALKlinger Oscillator with a 3 day EMA signal, instead of the regular 13 day period.
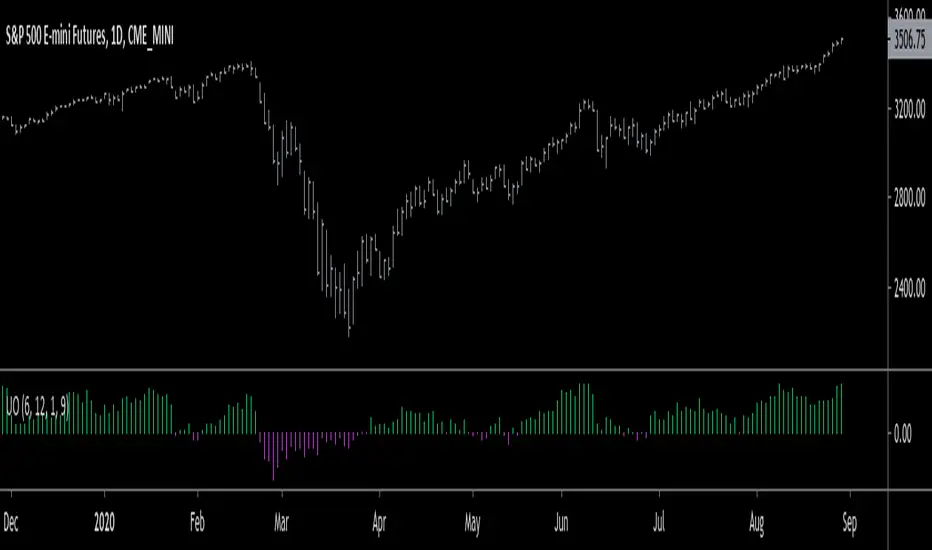
Ultimate Oscillator with 70/30/50 LinesUltimate Oscillator with 70/30/50 lines and a background.
Read how to use it here:
stockcharts.com
Enjoy :)
Normalized Oscillators Spider Chart [LuxAlgo]This indicator displays a spider chart overlaid on the user’s current chart allowing the visualization of information given by various normalized oscillators. It is possible to customize the spider chart by hiding certain oscillators from within the settings which removes their corresponding spokes from the chart.
Users can control the length settings of each oscillator individually or use a global length setting that applies to every oscillator. An additional meter element is displayed and aims to give the overall sentiment returned by the oscillators. This can also be used to gauge whether the market is trending or ranging.
This is a relatively simple application of a spider chart but can prove to be useful to some users.
1. Settings
RSI: Displays the Relative Strength Index spoke on the spider chart, includes the length setting on the right of the toggle.
%K: Displays the Stochastic Oscillator "%K" spoke on the spider chart, includes the length setting on the right of the toggle.
COR: Displays the Correlation Oscillator spoke on the spider chart, includes the length setting on the right of the toggle.
MFI: Displays the Money Flow Index oscillator spoke on the spider chart, includes the length setting on the right of the toggle.
WPR: Displays the Williams Percent Rank oscillator spoke on the spider chart, includes the length setting on the right of the toggle.
%UP: Displays the percentage of upward variations spoke on the spider chart, includes the length setting on the right of the toggle.
CMO: Displays the Chande Momentum Oscillator spoke on the spider chart, includes the length setting on the right of the toggle.
AOS: Displays the Aroon oscillator spoke on the spider chart, includes the length setting on the right of the toggle.
Global Oscillators Length: Determines whether all oscillators should use the same length settings, determined by the setting on the right of the toggle.
1.1 Style Settings
Spider Chart Length: Determines the horizontal width of the spider chart.
Spider Chart Offset: Offset between the most recent bar and the left extremity of the spider chart.
2. Usage
A spider chart can be a very useful visualization tool when it comes to seeing the individual characteristics of various variables at the same time.
Here, the tool can give a general sentiment on the direction of the trend without adding each indicator to your chart. It is also possible to determine when an oscillator is considered overbought or oversold with this indicator.
The dashed line represents the central value for each oscillator.
Disabling any of the oscillators from the settings will return a spider chart using fewer spokes.
The script also displays a meter that can be used to determine the overall sentiment given by all oscillators. This metric is based on the average value between each oscillator. An overall sentiment closer to 50 would indicate a ranging market.

Circular Barplot - Oscillators Sentiment [LuxAlgo]This indicator is an implementation of a circular barplot aiming to return the market sentiment given by multiple normalized oscillators. These include the relative strength index (RSI), Stochastic %K (%K), Linear Correlation Oscillator (ROSC), William Percent Range (WPR), Percent Rank (%R), and money flow index (MFI).
The length period of each of these oscillators can be adjusted in the indicator settings.
The label in the center of the circular plot returns the average market sentiment constructed from all the previously mentioned oscillators.
Settings
Width: Circle width.
Spacing: Determines how close each circle is to the other.
Thickness: Width of the colored lines.
Offset: Controls how far the circular barplot left extremity is from the most recent candles.
Src: Input source of the indicators.
Usage
Unlike regular bar charts, circular bar plots display the bars as circle arcs and have the advantage of preserving horizontal and vertical space. A higher arc length would indicate a value closer to the maximal value of the oscillator. Other variations of the circular barplots exist but this variation using the circle arc is particularly appropriate for normalized data.
The indicator can be used as a simple widget giving a quick method to obtain the overall market sentiment of a certain ticker. A dashboard is displayed on the top left of the chart in the event the user wants to see the actual value of the oscillators.
Note that low width or high spacing settings might return unwanted results.

SMT Oscillator: Smarter Money Divergence Detector [PhenLabs]📊Phenlabs - SMT Oscillator: Smarter Money Divergence Detector
Version: PineScript™v6
📌Description
The SMT Oscillator is a sophisticated tool designed to identify smart money divergence between two correlated assets. By analyzing the momentum and volume-weighted price action of a primary and secondary symbol, traders can spot subtle shifts in market dynamics that often precede significant price movements. This indicator is built to provide a clearer, more filtered view of inter-market relationships, solving the common problem of false signals and market noise. Its primary purpose is to equip traders with a quantifiable edge in detecting potential reversals or continuations that are not obvious on a standard price chart.
🚀Points of Innovation
Dual-Symbol Divergence Core: Directly compares momentum (RSI or MACD) between two user-selected symbols to pinpoint true SMT divergence.
Volume-Weighted Analysis: Integrates volume delta into the divergence calculation, giving more weight to moves backed by significant market participation.
Entropy Filter for Noise Reduction: Employs an entropy calculation to filter out low-quality signals during choppy or consolidating market conditions.
Predictive Forecast Line: Utilizes a linear regression model to project the oscillator’s future trajectory, offering a forward-looking glimpse of potential momentum shifts.
Customizable Signal Sensitivity: Allows fine-tuning of overbought and oversold levels to adapt to different market volatilities and trading styles.
Integrated Signal Alerts: Provides built-in alerts for bullish/bearish zero crosses and overbought/oversold conditions.
🔧Core Components
Momentum Engine: The user can select either RSI or MACD as the underlying engine for the divergence calculation, allowing for flexibility in analysis.
Normalization Function: Price data from both symbols is normalized using percentage change to ensure a true “apples-to-apples” comparison, regardless of their nominal price differences.
Divergence Calculator: The core algorithm that subtracts the secondary symbol’s momentum from the primary’s and normalizes the result using the combined standard deviation.
Smoothing Mechanism: An Exponential Moving Average (EMA) is applied to the raw oscillator output to reduce choppiness and provide a clearer signal line.
🔥Key Features
Multi-Asset Comparison: Go beyond single-asset analysis by comparing correlated pairs like ES/NQ or BTC/ETH to uncover hidden trading opportunities.
Heatmap Visualization: An optional heatmap mode provides an intuitive visual representation of divergence strength, making it easier to gauge market sentiment at a glance.
Configurable Lookback and Timeframe: Adjust the lookback period and analysis timeframe to suit your specific strategy, from short-term scalping to long-term trend analysis.
Signal Markers: Visual markers are plotted directly on the chart for bullish and bearish zero-line crossovers, providing clear entry and exit signals.
🎨Visualization
SMT Oscillator Line: The primary visual element, colored blue for bullish (positive) divergence and orange for bearish (negative) divergence.
Zero Line: A solid horizontal line at the zero level, indicating the equilibrium point between the two assets. Crossovers of this line signal a shift in relative strength.
Overbought/Oversold Zones: Dotted lines at the +80 and -80 levels (customizable) that highlight extreme divergence readings, often indicating potential exhaustion points.
Forecast Line: A predictive line that plots the anticipated path of the oscillator, giving traders an advanced warning of potential changes in momentum.
📖Usage Guidelines
Setting Categories
Primary Symbol
Default: (Chart Symbol)
Description: The main asset you are analyzing. Leave blank to use the symbol currently on your chart.
Secondary Symbol
Default: CME_MINI:ES1! (used with NASDAQ futures due to inherent heavy correlation
Description: The asset to compare against the primary symbol.
Lookback Period
Default: 14
Range: 8-100
Description: Controls the calculation window for momentum (RSI/MACD). Higher values result in a smoother, less sensitive oscillator.
Divergence Type
Default: RSI
Options: RSI, MACD
Description: Choose the momentum indicator to use for the divergence calculation.
Enable Volume Weighting
Default: true
Description: When enabled, gives more weight to divergence signals that are accompanied by significant volume.
✅Best Use Cases
Identifying high-probability reversal points by spotting divergence in overbought or oversold territory.
Confirming the strength of a trend by observing sustained positive or negative divergence.
Pairs trading by taking a long position on the outperforming asset and a short position on the underperforming one during a divergence.
Risk management by recognizing when a current trend is losing its underlying momentum.
⚠️Limitations
Requires Correlated Assets: The indicator’s effectiveness is highly dependent on the selection of two assets with a known correlation (e.g., ES and NQ).
Not a Standalone System: Divergence signals should be used in conjunction with other forms of analysis (price action, market structure) and not as a complete trading system.
Lagging by Nature: As it is based on moving averages and past price data, the oscillator is inherently lagging and may not capture all rapid price changes.
💡What Makes This Unique
Combined Momentum & Volume: Unlike standard oscillators, it fuses momentum with volume delta for a more robust “Smart Money” perspective.
Noise-Filtering Mechanism: The proprietary entropy filter is a unique feature designed to weed out insignificant market chatter and focus on high-conviction signals.
🔬How It Works
Data Normalization:
The script first normalizes the price data of the two selected symbols into percentage changes. This ensures that the comparison is fair, regardless of the difference in their price scales.
Momentum Calculation:
It then calculates the chosen momentum value (either RSI or MACD histogram) for each of the normalized price series.
Divergence Computation:
The core of the indicator lies in subtracting the momentum of the secondary symbol from the primary one. This raw divergence is then optionally weighted by volume and filtered for market noise (entropy) to produce the final oscillator value.
💡Note:
For best results, use this indicator on adequate timeframes to filter out market noise. Always confirm signals with price action analysis before entering a trade.

Swing Point Oscillator with Trend Filter [Quantigenics]The "Swing Point Oscillator with Trend Filter" is a sophisticated trading oscillator designed to enhance trading decisions by adapting to market conditions. Oscillators typically signal overbought/oversold market states, often yielding false signals in strong trends. This trend indicator addresses this by implementing a 'Trend Filter' which changes color in strong trends, alerting traders to avoid typical oscillator reversals. In strong trends (when the trend Filter is red), mid-high or mid-low levels can be used for pullback entries. In more neutral markets (when the trend Filter is close to blue), extreme high and low levels (top and bottom) can be used, as a true 'over bought / over sold' oscillator. The oscillator combines components of the Stochastic Oscillator and the CCI, then normalizes the result, providing a unique, adaptive signal. The color-coded lines and Trend Filter offer clear visual cues, making this a comprehensive tool for various market scenarios.
Caution: Always use the indicator in conjunction with other tools and analysis methods to confirm trading decisions. Avoid trading solely based on this indicator.
GOLD 4HR
CL1! 4HR
How to Use:
Swing Point Oscillator: Displays the momentum of the price relative to its recent high and low.
Trend Filter: Highlights the general direction of the market trend.
Zones: Visual representation to categorize oscillator values (Up Zone and Down Zone).
Interpretation:
Oscillator:
When the oscillator moves upward and approaches or enters the Up Zone, it indicates increasing bullish momentum.
When the oscillator moves downward and approaches or enters the Down Zone, it suggests increasing bearish momentum.
Values near the middle (around zero) often indicate indecision or consolidation in the market.
Trend Filter:
A trend filter line above the Mid-High or below the Mid-Low suggests a strong trend.
When the trend filter is between the Mid-High and Mid-Low, it might indicate a weaker or sideways trend.
Its color will change based on its position relative to the zones. For instance, it turns red when indicating a stronger trend.
Zones:
Up Zone: The area between the Top Line and the Mid-High. Indicates strong bullish momentum when the oscillator is within this zone.
Down Zone: The area between the Mid-Low and the Bottom Line. Indicates strong bearish momentum when the oscillator is in this zone.
Trading Tips:
Bullish Scenario: Consider long positions when the oscillator is rising, and the trend filter indicates a strong upward trend.
Bearish Scenario: Consider short positions when the oscillator is falling, and the trend filter indicates a strong downward trend.

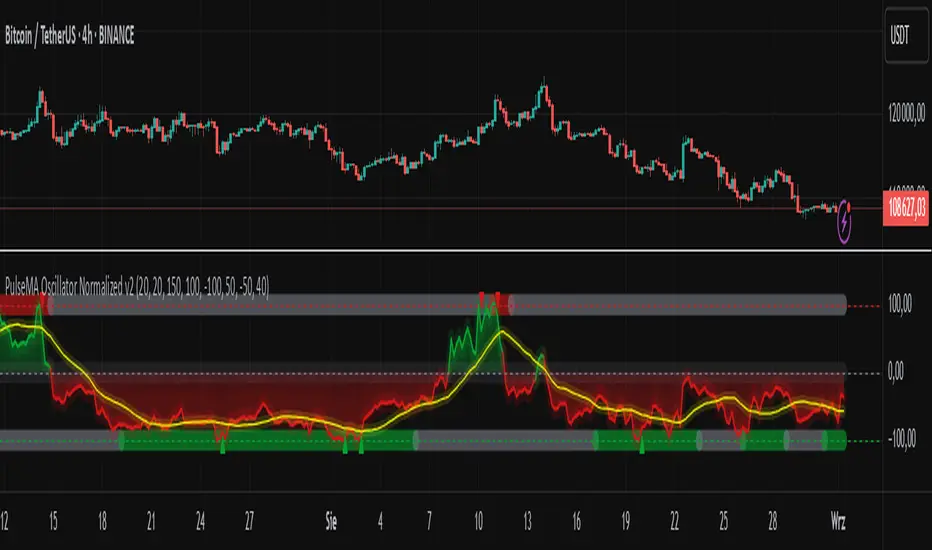
PulseMA Oscillator Normalized v2█ OVERVIEW
PulseMA Oscillator Normalized v2 is a technical indicator designed for the TradingView platform, assisting traders in identifying potential trend reversal points based on price dynamics derived from moving averages. The indicator is normalized for easier interpretation across various market conditions, and its visual presentation with gradients and signals facilitates quick decision-making.
█ CONCEPTS
The core idea of the indicator is to analyze trend dynamics by calculating an oscillator based on a moving average (EMA), which is then normalized and smoothed. It provides insights into trend strength, overbought/oversold levels, and reversal signals, enhanced by gradient visualizations.
Why use it?
Identifying reversal points: The indicator detects overbought and oversold levels, generating buy/sell signals at their crossovers.
Price dynamics analysis: Based on moving averages, it measures how long the price stays above or below the EMA, incorporating trend slope.
Visual clarity: Gradients, fills, and colored lines enable quick chart analysis.
Flexibility: Configurable parameters, such as moving average lengths or normalization period, allow adaptation to various strategies and markets.
How it works?
Trend detection: Calculates a base exponential moving average (EMA with PulseMA Length) and measures how long the price stays above or below it, multiplied by the slope for the oscillator.
Normalization: The oscillator is normalized based on the minimum and maximum values over a lookback period (default 150 bars), scaling it to a range from -100 to 100: (oscillator - min) / (max - min) * 200 - 100. This ensures values are comparable across different instruments and timeframes.
Smoothing: The main line (PulseMA) is the normalized oscillator (oscillatorNorm). The PulseMA MA line is a smoothed version of PulseMA, calculated using an SMA with the PulseMA MA length. As PulseMA MA is smoothed, it reacts more slowly and can be used as a noise filter.
Signals: Generates buy signals when crossing the oversold level upward and sell signals when crossing the overbought level downward. Signals are stronger when PulseMA MA is in the overbought or oversold zone (exceeding the respective thresholds for PulseMA MA).
Visualization: Draws lines with gradients for PulseMA and PulseMA MA, levels with gradients, gradient fill to the zero line, and signals as triangles.
Alerts: Built-in alerts for buy and sell signals.
Settings and customization
PulseMA Length: Length of the base EMA (default 20).
PulseMA MA: Length of the SMA for smoothing PulseMA MA (default 20).
Normalization Lookback Period: Normalization period (default 150, minimum 10).
Overbought/Oversold Levels: Levels for the main line (default 100/-100) and thresholds for PulseMA MA, indicating zones where PulseMA MA exceeds set values (default 50/-50).
Colors and gradients: Customize colors for lines, gradients, and levels; options to enable/disable gradients and fills.
Visualizations: Show PulseMA MA, gradients for overbought/oversold/zero levels, and fills.
█ OTHER SECTIONS
Usage examples
Trend analysis: Observe PulseMA above 0 for an uptrend or below 0 for a downtrend. Use different values for PulseMA Length and PulseMA MA to gain a clearer trend picture. PulseMA MA, being smoothed, reacts more slowly and can serve as a noise filter to confirm trend direction.
Reversal signals: Look for buy triangles when PulseMA crosses the oversold level, especially when PulseMA MA is in the oversold zone. Similarly, look for sell triangles when crossing the overbought level with PulseMA MA in the overbought zone. Such confirmation increases signal reliability.
Customization: Test different values for PulseMA Length and PulseMA MA on a given instrument and timeframe to minimize false signals and tailor the indicator to market specifics.
Notes for users
Combine with other tools, such as support/resistance levels or other oscillators, for greater accuracy.
Test different settings for PulseMA Length and PulseMA MA on the chosen instrument and timeframe to find optimal values.
Oscillator: Which follows Normal Distribution?When doing machine learning using oscillators, it would be better if the oscillators were normally distributed.
So I analyzed the distribution of oscillators.
The value of the oscillator was divided into 50 groups each from 0 to 100.
ex) if rsi value is 45.43 -> group_44, 58.23 -> group_58
Ocscillators : RSI, Stoch, MFI, WT, RVI, etc....
Caution: The normal distribution was verified through an empirical formula.

Gorgo's Hybrid Oscillator STrategy**Indicator Name:** Gorgo's Hybrid Oscillator STrategy (G.H.O.S.T.)
**Purpose:**
The Gorgo's Hybrid Oscillator STrategy (G.H.O.S.T.) is a multi-component technical analysis tool designed to identify overbought and oversold market conditions, assess trend strength, and signal potential buy and sell opportunities. By combining elements from RSI, Ultimate Oscillator, Stochastic CCI, and ADX, this custom indicator provides a comprehensive view of momentum, trend intensity, and volume context to enhance decision-making.
---
**Components and Logic:**
1. **RSI (Relative Strength Index):**
* Calculated using a customizable period (default: 14) and based on the hlc3 price source.
* Measures recent price changes to evaluate overbought/oversold conditions.
* Incorporated in the final oscillator average.
2. **Ultimate Oscillator:**
* Combines three timeframes (7, 14, 28 by default) to smooth out price movements.
* Uses true range and buying pressure for multi-frame momentum analysis.
* Averaged together with RSI to create the main oscillator signal.
3. **Stochastic CCI:**
* Applies a stochastic process to the Commodity Channel Index (CCI).
* Smooths the %K and %D lines (default: 3 each) to detect subtle reversals.
* Generates oversold (<35) and overbought (>69) signals, plotted as yellow circles.
4. **ADX + DI (Average Directional Index):**
* Determines trend strength using ADX and directional movement indicators (DI).
* ADX threshold is set at 24 by default to filter weak trends.
* Colored histogram columns:
* Green: Strong bullish trend.
* Red: Strong bearish trend.
* Gray: Weak/no trend.
5. **Volume Analysis:**
* Calculates a 9-period SMA of volume.
* Detects significant volume spikes (2.7× the average by default) to validate breakouts or fakeouts.
6. **Oscillator Output ("osc") and Levels:**
* The main plotted oscillator line is the average of the RSI and Ultimate Oscillator.
* Important horizontal lines:
* Overbought (69.0)
* Oversold (35.0)
* Midline (52.0): Neutral reference point.
* ADX threshold line (24.0)
---
**Signals:**
1. **Buy Signal Conditions:**
* Close is less than or equal to open (candle is red).
* Oscillator is decreasing and below oversold level.
* Stochastic CCI is below midline.
* Volume is above average, or excessive volume with oscillator falling below 40.
* ADX confirms trend presence (either above 15 or meeting threshold).
2. **Sell Signal Conditions:**
* ADX increasing and confirming trend.
* Oscillator is increasing and above overbought level.
* Stochastic CCI is above midline.
* Volume is above average, or very high with oscillator above 60.
3. **Visual Feedback:**
* Yellow dots highlight oversold/overbought Stochastic CCI.
* Oscillator line in cyan.
* Background colors:
* Light red for buy signals.
* White for sell signals.
4. **Alerts:**
* Built-in `alertcondition()` calls allow automated alerts for buy and sell events.
---
**Usage Guide:**
* **Best Use Cases:** Trend-following and reversal strategies on any timeframe.
* **Avoid Using Alone:** Use G.H.O.S.T. in conjunction with price action, support/resistance, and other confluence tools.
* **Customization:** All thresholds, periods, and volumes are user-editable from the settings panel.
---
**Interpretation Summary:**
G.H.O.S.T. excels at filtering out noise by combining different oscillators and volume signals to offer contextually valid entries and exits. A bullish (buy) signal typically suggests a market under pressure but potentially bottoming out, while a bearish (sell) signal highlights likely exhaustion after a strong upward push.
This hybrid approach makes the G.H.O.S.T. a reliable ally in volatile or choppy conditions where single-indicator strategies might fail.

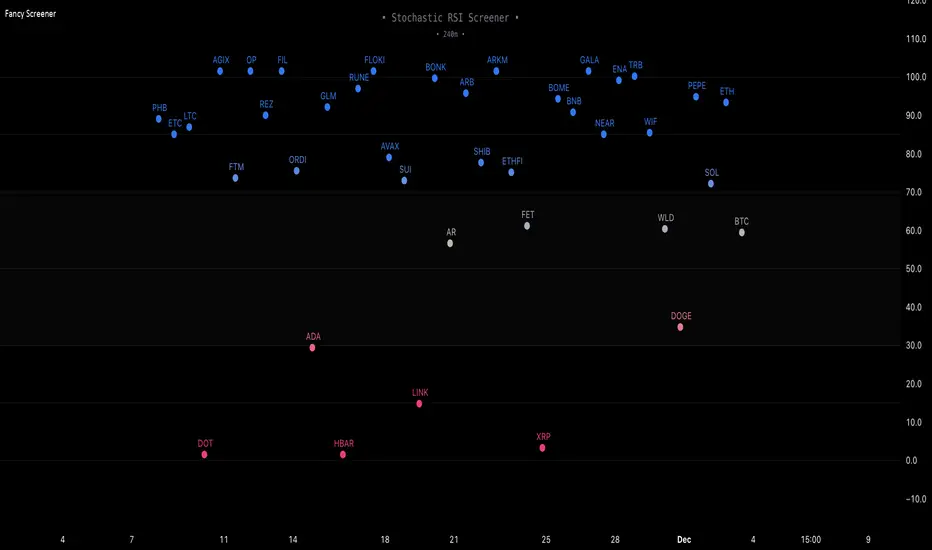
Fancy Oscillator Screener [Daveatt]⬛ OVERVIEW
Building upon LeviathanCapital original RSI Screener (), this enhanced version brings comprehensive technical analysis capabilities to your trading workflow. Through an intuitive grid display, you can monitor multiple trading instruments simultaneously while leveraging powerful indicators to identify market opportunities in real-time.
⬛ FEATURES
This script provides a sophisticated visualization system that supports both cross rates and heat map displays, allowing you to track exchange rates and percentage changes with ease. You can organize up to 40 trading pairs into seven customizable groups, making it simple to focus on specific market segments or trading strategies.
If you overlay on any circle/asset on the chart, you'll see the accurate oscillator value displayed for that asset
⬛ TECHNICAL INDICATORS
The screener supports the following oscillators:
• RSI - the oscillator from the original script version
• Awesome Oscillator
• Chaikin Oscillator
• Stochastic RSI
• Stochastic
• Volume Oscillator
• CCI
• Williams %R
• MFI
• ROC
• ATR Multiple
• ADX
• Fisher Transform
• Historical Volatility
• External : connect your own custom oscillator
⬛ DYNAMIC SCALING
One of the key improvements in this version is the implementation of dynamic chart scaling. Unlike the original script which was optimized for RSI's 0-100 range, this version automatically adjusts its scale based on the selected oscillator.
This adaptation was necessary because different indicators operate on vastly different numerical ranges - for instance, CCI typically ranges from -200 to +200, while Williams %R operates from -100 to 0.
The dynamic scaling ensures that each oscillator's data is properly displayed within its natural range, making the visualization both accurate and meaningful regardless of which indicator you choose to use.
⬛ ALERTS
I've integrated a comprehensive alert system that monitors both overbought and oversold conditions.
Users can now set custom threshold levels for their alerts.
When any asset in your monitored group crosses these thresholds, the system generates an alert, helping you catch potential trading opportunities without constant manual monitoring.
em will help you stay informed of market movements and potential trading opportunities.
I hope you'll find this tool valuable in your trading journey
All the BEST,
Daveatt
Fib OscillatorWhat is Fib Oscillator and How to Use it?
🔶 1. Conceptual Overview
The Fib Oscillator is a Fibonacci-based relative position oscillator.
Instead of measuring momentum (like RSI or MACD), it measures where price currently sits between the recent swing high and swing low, expressed as a percentage within the Fibonacci range.
In other words:
It answers: “Where is price right now within its most recent dynamic range?”
It visualizes retracement and extension zones numerically, providing continuous feedback between 0% and 100% (and beyond if extended).
🔶 2. What the Script Does
The indicator:
Automatically detects recent high and low levels using an adaptive lookback window, which depends on ATR volatility.
Calculates the current price’s position between those levels as a percentage (0–100).
Plots that percentage as an oscillator — showing visually whether price is near the top, middle, or bottom of its recent range.
Overlays Fibonacci retracement levels (23.6%, 38.2%, 50%, 61.8%, 78.6%) as reference zones.
Generates alerts when the oscillator crosses key Fib thresholds — which can signal retracement completion, breakout potential, or pullback exhaustion.
🔶 3. Technical Flow Breakdown
(a) Inputs
Input Description Default Notes
atrLength ATR period used for volatility estimation 14 Used to dynamically tune lookback sensitivity
minLookback Minimum lookback window (candles) 20 Ensures stability even in low volatility
maxLookback Maximum lookback window 100 Limits over-expansion during high volatility
isInverse Inverts chart orientation false Useful for inverse markets (e.g. shorts or inverse BTC view)
(b) Volatility-Adaptive Lookback
Instead of using a fixed lookback, it calculates:
lookback
=
SMA(ATR,10)
/
SMA(Close,10)
×
500
lookback=SMA(ATR,10)/SMA(Close,10)×500
Then it clamps this between minLookback and maxLookback.
This makes the oscillator:
More reactive during high volatility (shorter lookback)
More stable during calm markets (longer lookback)
Essentially, it self-adjusts to market rhythm — you don’t have to constantly tweak lookback manually.
(c) High-Low Reference Points
It takes the highest and lowest points within the dynamic lookback window.
If isInverse = true, it flips the candle logic (useful if viewing inverse instruments like stablecoin pairs or when analyzing bearish setups invertedly).
(d) Oscillator Core
The main oscillator line:
osc
=
(
close
−
low
)
(
high
−
low
)
×
100
osc=
(high−low)
(close−low)
×100
0% = Price is at the lookback low.
100% = Price is at the lookback high.
50% = Midpoint (balanced).
Between Fibonacci percentages (23.6%, 38.2%, 61.8%, etc.), the oscillator indicates retracement stages.
(e) Fibonacci Levels as Reference
It overlays horizontal reference lines at:
0%, 23.6%, 38.2%, 50%, 61.8%, 78.6%, 100%
These act as support/resistance bands in oscillator space.
You can read it similar to how traders use Fibonacci retracements on charts, but compressed into a single line oscillator.
(f) Alerts
The script includes built-in alert conditions for crossovers at each major Fibonacci level.
You can set TradingView alerts such as:
“Oscillator crossed above 61.8%” → possible bullish continuation or breakout.
“Oscillator crossed below 38.2%” → possible pullback or correction starting.
This allows automated monitoring of fib retracement completions without manually drawing fib levels.
🔶 4. How to Use It
🔸 Visual Interpretation
Oscillator Value Zone Market Context
0–23.6% Deep Retracement Potential exhaustion of a down-move / early reversal
23.6–38.2% Shallow retracement zone Possible continuation phase
38.2–50% Mid retracement Neutral or indecisive structure
50–61.8% Key pivot region Common trend resumption zone
61.8–78.6% Late retracement Often “last pullback” area
78.6–100% Near high range Possible overextension / profit-taking
>100% Range breakout New leg formation / expansion
🔸 Practical Application Steps
Load the indicator on your chart (set overlay = false, so it’s below the main price chart).
Observe oscillator position relative to fib bands:
Use it to determine retracement depth.
Combine with structure tools:
Trend lines, swing points, or HTF market structure.
Use crossovers for timing:
Crossing above 61.8% in an uptrend often confirms breakout continuation.
Crossing below 38.2% in a downtrend signals renewed downside momentum.
For range markets, oscillator swings between 23.6% and 78.6% can define accumulation/distribution boundaries.
🔶 5. When to Use It
During Retracements: To gauge how deep the pullback has gone.
During Range Markets: To identify relative overbought/oversold positions.
Before Breakouts: Crossovers of 61.8% or 78.6% often precede impulsive moves.
In Multi-Timeframe Contexts:
LTF (15M–1H): Detect intraday retracement exhaustion.
HTF (4H–1D): Confirm major range expansions or key reversal zones.
🔶 6. Ideal Companion Indicators
The Fib Oscillator works best when contextualized with structure, volatility, and trend bias indicators.
Below are optimal pairings:
Companion Indicator Purpose Integration Insight
Market Structure MTF Tool Identify active trend direction Use Fib Oscillator only in trend direction for cleaner signals
EMA Ribbon / Supertrend Trend confirmation Align oscillator crossovers with EMA bias
ATR Bands / Volatility Envelope Validate breakout strength If oscillator >78.6% & ATR rising → valid breakout
Volume Oscillator Confirm retracement strength Volume contraction + oscillator under 38.2% → potential reversal
HTF Fib Retracement Tool Combine LTF oscillator with HTF fib confluence Powerful multi-timeframe setups
RSI or Stochastic Measure momentum relative to position RSI divergence while oscillator near 78.6% → exhaustion clue
🔶 7. Understanding the Settings
Setting Function Practical Impact
ATR Period (14) Controls volatility sampling Higher = smoother lookback adaptation
Min Lookback (20) Smallest window allowed Lower = more reactive but noisier
Max Lookback (100) Largest window allowed Higher = smoother but slower to react
Inverse Candle Chart Flips oscillator vertically Useful when analyzing bearish or inverse scenarios (e.g. short-side fib mapping)
Recommended Configs:
For scalping/intraday: ATR 10–14, lookback 20–50
For swing/position trading: ATR 14–21, lookback 50–100
🔶 8. Example Trade Logic (Practical Use)
Scenario: Uptrend on 4H chart
Oscillator drops to below 38.2% → retracement zone
Price consolidates → oscillator stabilizes
Oscillator crosses above 50% → pullback ending
Entry: Long when oscillator crosses above 61.8%
Exit: Near 78.6–100% zone or upon divergence with RSI
For Short Bias (Inverse Setup):
Enable isInverse = true to visually flip the oscillator (so lows become highs).
Use the same thresholds inversely.
🔶 9. Strengths & Limitations
✅ Strengths
Dynamic, self-adapting to volatility
Quantifies Fib retracement as a continuous function
Compact oscillator view (no clutter on chart)
Works well across all timeframes
Compatible with both trending and ranging markets
⚠️ Limitations
Doesn’t define trend direction — must be used with structure filters
Can whipsaw during choppy consolidations
The “lookback auto-adjust” may lag in sudden volatility shifts
Shouldn’t be used standalone for entries without structural confluence
🔶 10. Summary
The “Fib Oscillator” is a dynamic Fibonacci-relative positioning tool that merges retracement theory with adaptive volatility logic.
It gives traders an intuitive, quantified view of where price sits within its recent fib range, allowing anticipation of pullbacks, reversals, or breakout momentum.
Think of it as a "Fibonacci RSI", but instead of momentum strength, it shows positional depth — the vibrational location of price within its natural swing cycle.

Real-Fast Fourier Transform of Price Oscillator [Loxx]Real-Fast Fourier Transform Oscillator is a simple Real-Fast Fourier Transform Oscillator. You have the option to turn on inverse filter as well as min/max filters to fine tune the oscillator. This oscillator is normalized by default. This indicator is to demonstrate how one can easily turn the RFFT algorithm into an oscillator..
What is the Discrete Fourier Transform?
In mathematics, the discrete Fourier transform (DFT) converts a finite sequence of equally-spaced samples of a function into a same-length sequence of equally-spaced samples of the discrete-time Fourier transform (DTFT), which is a complex-valued function of frequency. The interval at which the DTFT is sampled is the reciprocal of the duration of the input sequence. An inverse DFT is a Fourier series, using the DTFT samples as coefficients of complex sinusoids at the corresponding DTFT frequencies. It has the same sample-values as the original input sequence. The DFT is therefore said to be a frequency domain representation of the original input sequence. If the original sequence spans all the non-zero values of a function, its DTFT is continuous (and periodic), and the DFT provides discrete samples of one cycle. If the original sequence is one cycle of a periodic function, the DFT provides all the non-zero values of one DTFT cycle.
What is the Complex Fast Fourier Transform?
The complex Fast Fourier Transform algorithm transforms N real or complex numbers into another N complex numbers. The complex FFT transforms a real or complex signal x in the time domain into a complex two-sided spectrum X in the frequency domain. You must remember that zero frequency corresponds to n = 0, positive frequencies 0 < f < f_c correspond to values 1 ≤ n ≤ N/2 −1, while negative frequencies −fc < f < 0 correspond to N/2 +1 ≤ n ≤ N −1. The value n = N/2 corresponds to both f = f_c and f = −f_c. f_c is the critical or Nyquist frequency with f_c = 1/(2*T) or half the sampling frequency. The first harmonic X corresponds to the frequency 1/(N*T).
The complex FFT requires the list of values (resolution, or N) to be a power 2. If the input size if not a power of 2, then the input data will be padded with zeros to fit the size of the closest power of 2 upward.
What is Real-Fast Fourier Transform?
Has conditions similar to the complex Fast Fourier Transform value, except that the input data must be purely real. If the time series data has the basic type complex64, only the real parts of the complex numbers are used for the calculation. The imaginary parts are silently discarded.
Included
Moving window from Last Bar setting. You can lock the oscillator in place on the current bar by adding 1 every time a new bar appears in the Last Bar Setting

Multi-ZigZag Multi-Oscillator Trend DetectorThis table is intended to give you snapshot of how price and oscillators are moving along with zigzag pivots.
This is done in the same lines of Zigzag-Trend-Divergence-Detector
But, here are the differences
Table shows multiple oscillator movements at a same time instead of one selected oscillator
Divergence is not calculated and also supertrend based trend. Trend can be calculated based on zigzag movements. However, lets keep this for future enhancements.
This system also uses multiple zigzags instead of just one.
⬜ Process
▶ Derive multiple zigzags - Code is taken from Multi-ZigZag
▶ Along with zigzags - also calculate different oscillators and attach it to zigzag pivot.
▶ Calculate directions of zigzag pivots and corresponding oscillators.
▶ Plot everything in the table on last bar.
⬜ Table components
Table contains following data:
Directional legends are:
⇈ - Higher High (Green)
⇊ - Lower Low (Red)
⭡- Lower High (Orange)
⭣ - Higher Low (Lime)
⬜ Input Parameters
▶ Source : Default is close. If Unchecked - uses high/low data for calculating pivots. Can also use external input such as OBV
▶ Stats : Gives option to select the depth of output (History) and also lets you chose text size and table position.
▶ Oscillators : Oscillator length is derived by multiplying multiplier to zigzag length. For example, for zigzag 5, with 4 as multiplier, all oscillators are calculated with length 20. But, same for zigzag 8 will be 32 and so on.
▶ Available oscillators :
CCI - Commodity Channel Index
CMO - Chande Momentum Oscillator
COG - Center Of Gravity
MFI - Money Flow Index (Shows only if volume is present)
MOM - Momentum oscillator
ROC - Rate Of Change
RSI - Relative Strength Index
TSI - Total Strength Index
WPR - William Percent R
BB - Bollinger Percent B
KC - Keltner Channel Percent K
DC - Donchian Channel Percent D
ADC - Adoptive Donchian Channel Percent D ( Adoptive-Donchian-Channel )
⬜ Challenges
There are 12 oscillators and each zigzag has different length. Which means, there are 48 combinations of the ocillators.
First challenge was generating these values without creating lots of static initialization. Also, note, if the functions are not called on each bar, then they will not yield correct result. This is achieved through initializer function which runs on every bar and stores the oscillator values in an array which emulates multi dimensional array oscillator X zigzag length.
Next challenge was getting these values within function when we need it. While doing so I realized that values stored in array also have historical series and calling array.get will actully get you the entire series and not just the value. This is an important takeaway for me and this can be used for further complex implementations.
Thanks to @LonesomeTheBlue and @LucF for some timely suggestions and interesting technical discussions :)

Fibonacci Averages Trend OscillatorOverview:
The Fibonacci Averages Trend Oscillator is a unique technical indicator that leverages Fibonacci numbers to analyze market trends. It calculates the average trend sentiment over periods determined by Fibonacci numbers and smooths the result to create an oscillator.
Key Features:
Uses Fibonacci sequences for trend analysis.
Smooths the trend data to create a clear oscillator.
Offers adjustable oversold and overbought levels for customized analysis.
Inputs:
Max Fib Number: Select the highest Fibonacci number for trend calculation.
Smooth: Adjust the smoothness of the oscillator line.
Using the Oscillator:
A rising oscillator indicates a bullish trend, while a falling oscillator suggests bearish sentiment.
Oversold and overbought levels help identify potential reversal points.
Use the oscillator in conjunction with other indicators for comprehensive market analysis.
Tips for Effective Use:
Adjusting Fibonacci Levels: Experiment with different 'Max Fib Number' settings to find the one that best matches your trading style and the asset's characteristics. Higher Fibonacci numbers consider longer periods, which might be more suitable for long-term trend analysis.
Smoothing Level: The 'Smooth' input helps in reducing noise. A higher smooth level results in a less responsive but smoother line, which can be useful for identifying the overall trend direction.
Interpreting Overbought/Oversold: Watch for the oscillator reaching overbought or oversold levels. These points could signal potential trend reversals or consolidation phases.
Combination with Other Tools: For best results, combine the Fibonacci Averages Trend Oscillator with other technical tools like moving averages, RSI, or MACD to validate the signals and develop a robust trading strategy.
Conclusion:
The Fibonacci Averages Trend Oscillator offers a unique approach to trend analysis by incorporating Fibonacci numbers into its calculation. Its adjustable settings allow for customization to fit various trading styles and market conditions, making it a versatile tool for traders seeking to enhance their technical analysis capabilities.

Rainbow Oscillator The Rainbow Oscillator is a technical indicator that shows prices in overbought or oversold areas. That allows you to catch the price reversal point.
---------------
FEATURES
---------------
.:: Dynamic levels ::.
The indicator levels are divided into several zones, which have a fibonacci ratio. Zones determine the overbought/oversold level. Blue and green level zones are better for buying, red and orange for selling. Dynamic levels are used as replacements for classic levels such as -100 and 100 for the CCI indicator or 30 and 70 for the RSI indicator. Dynamic levels work much better than static levels, as they are more adaptive to the current market situation.
.:: Composite oscillator (3 in 1) ::.
The main signal line of the indicator includes all three oscillators RSI, CCI, Stoch in different ratios. In the settings, you can change the proportions or completely remove one of the oscillators by setting its weight to 0
.:: CCI + RSI + Stoch ratio setting ::.
Each of the oscillators has its own weight in the calculation formula: w2 * cci ( + w1 * ( rsi - 50) + (1 - w2 - w1) * ( stoch - 50), this allows you to create the resulting oscillator from all indicators, depending on the weight of each of them. Each weight value must be between 0 and 1 so that the sum of all weights does not exceed 1.
.:: Smoothing levels and lines of the oscillator ::.
Smoothing the oscillator readings allows you to filter out the noise and get more accurate data. Level offset allows you to customize the support for inputs.
.:: Market Flat ::.
Dynamic creation of levels allows you to find in the price reversal zone, even when the price is in a flat
.:: Sources ::.
You can change the data source for the indicator to the number of longs and shorts for the selected asset. For example, BTCUSDLONGS / BTCUSDSHORTS is perfect for Bitcoin, then the oscillator will work on this data and will not use the quote price.
.:: Trend Detection ::.
The main line of the oscillator has 2 colors - green and red. Red means downtrend, green means uptrend. Trend reversal points are most often found in overbought and oversold zones.
.:: Alerts ::.
Alerts inside for next events: Buy (blue point) Sell (red point) and TrendReversal (change line color)
----------------
TRADING
—-------------
There are several possible entry points for the indicator, let's consider them all.
1) Trend reversal.
Long entry: The indicator line is in the green zone below 0 (oversold), while the line changes color from red (downward) to green (upward)
Short entry: The indicator line is in the red zone above the 0 (overbought) mark, while the line changes color from green to red.
2) Red and blue dots.
Long entry: Blue dot
Short Entry: Red Dot
I prefer to use the first trading method.
----------------
SETTINGS
----------------
.:: Trend Filter (checkbox) ::.
Use trend confirmation for red/blue dots. When enabled, the blue dot requires an uptrend, red dot requires downtrend confirmation before appearing.
.:: Use long/shorts (checkbox) ::.
Change formula to use longs and shorts positions as data source (instead of quote price)
.:: RSI weight / CCI weight / Stoch weight ::.
Weight control coefficients for RSI and CCI indicators, respectively. When you set RSI Weight = 0, equalize the combo of CCI and Stoch , when RSI Weight is zero and CCI Weight is equal to the oscillator value will be plotted
only from Stoch . Intermediate values have a high degree of measurement of each of the three oscillators in percentage terms from 0 to 100. The calculation uses the formula: w2 * cci ( + w1 * ( rsi - 50) + (1 - w2 - w1) * ( stoch - 50),
where w1 is RSI Weight and w2 is CCI Weight, Stoch weight is calculated on the fly as (1 - w2 - w1), so the sum of w1 + w2 should not exceed 1, in this case Stoch will work as opposed to CCI and RSI .
.:: Oscillograph fast and slow periods ::.
The fast period is the period for the moving average used to smooth CCI, RSI and Stoch. The slow period is the same. The fast period must always be less than the slow period.
.:: Oscillograph samples period::.
The period of smoothing the total values of indicators - creates a fast and slow main lines of the oscillator.
.:: Oscillograph samples count::.
How many times smoothing applied to source data.
.:: Oscillator samples type ::.
Smoothing line type e.g. EMA, SMA, RMA …
.:: Level period ::.
Periodically moving averages used to form the levels (zone) of the Rainbow Oscillator indicator
.:: Level offset ::.
Additional setting for shifting levels from zero points. Can be useful for absorbing levels and filtering input signals. The default is 0.
.:: Level redundant ::.
It characterizes the severity of the state at each iteration of the level of the disease. If set to 1 - the levels will not decrease when the oscillator values fall. If it has a value of 0.99 - the levels are reduced by 0.01
each has an oscillator in 1% of cases and is pressed to 0 by more aggressive ones.
.:: Level smooth samples ::.
setting allows you to set the number of strokes per level. Measuring the number of averages with the definition of the type of moving averages
.:: Level MA Type ::.
Type of moving average, average for the formation of a smoothing overbought and oversold zone
