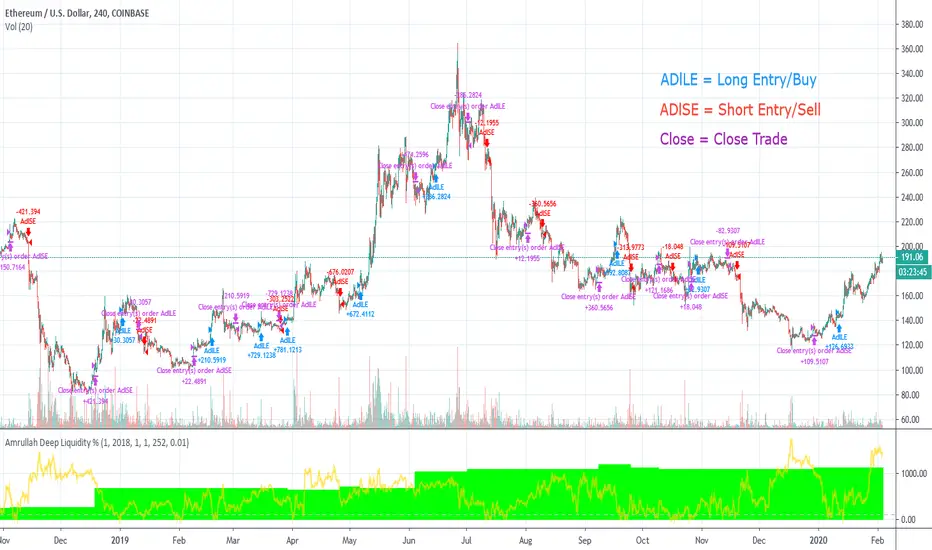
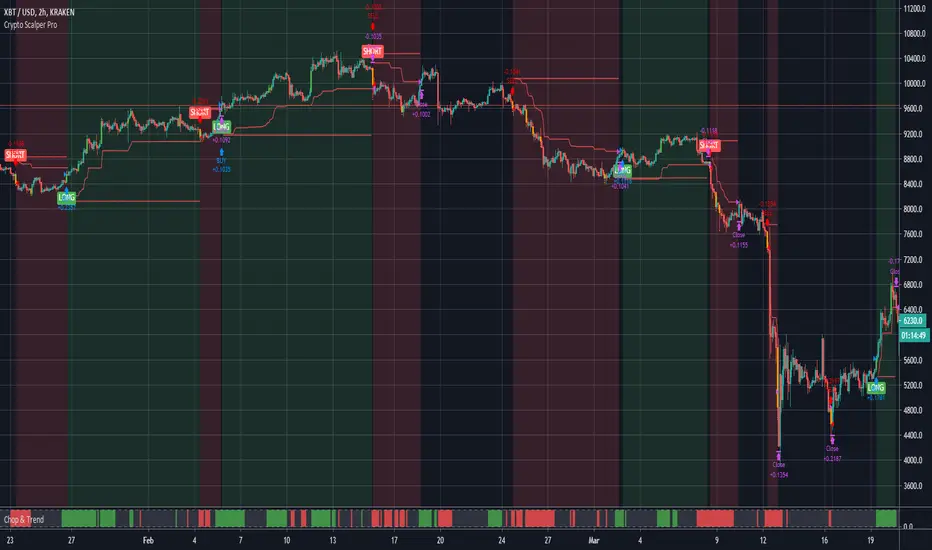
Crypto Scalper Pro===========
Crypto Scalper Pro Strategy
===========
Crypto Scalper Pro is a scalping strategy developed to work alongside our Crypto Tipster Strategy, now you can trade the D markets with our Tipster, and Intra-Day markets with our Scalper!
This strategy works very well on shorter time frames across multiple crypto pairs, everything from 4H all the way down to a 5m chart, our Crypto Scalper will find the best Entry and Exit points for consistent and reliable returns.
We've added a few variables for you to play with to fine tune this scalper to suit your chosen trading plan - however, these will only adjust the strategy to a certain degree, as there are many algorithms and indicators doing their thing hidden in the background that take precedence.
Check out the Crypto Scalper Pro Alert Indicator to automate this strategy!
-----------
What's Included?
Crypto Scalper Pro comes with a host of features and is being continually updated, these features include (but are not limited to):
- Date Range Settings
Setting custom Start/End dates can help hone your strategy to suit the current times, or get a general overview of the market over the years.
- Heikin Ashi Confirmation
We added HA confirmation for both Entry & Exit of trades. This started as a form of "Safe Mode", we have since adapted our safe mode far beyond Heikin Ashi; but kept this confirmation as an added extra.
- Variable Indicator Settings
As well as our Fixed Indicators and Price Action analysis going on in the background of the strategy, we've also included some Variable Indicators that you have access to edit.
Lookback Period will help establish how far back you'd want to be confirming price indications on the strategy - the higher the number the further back it will look, making the Scalping Strategy appear smoother with less trades during choppy times, the downside with a higher lookback is you might miss the start of a potentially epic trade, and only be shown an Entry after the event has already happened.
We find Lookback Lengths of between 5 and 100 could work depending on various other settings, the market being traded, and the timeframe being used.
MA Length (Length of Moving Average) - We use a few MA's to best determine various factors involved with successfully scalping a market, overall trend direction, current price movements and fake-out detection to name just a few. You've got the option of determining a good average length for a few of these variables.
Again, a short MA Length will catch every big move right at the start, but you're almost guaranteed a Negative Expected Value with that method, due to the vast quantity of losing trades in times of chop/ranging markets. A Higher MA Length will remove a lot of chop, reduce the quantity of trades, and therefore (should) result in a higher Percent of Trades Profitable; it will however add a certain lag to the strategy, meaning those highly profitable trades we're looking for may turn out to be not so highly profitable!
- Safe Mode
Enabling Safe Mode will add a couple more confirmation indicators to the strategy - the aim of Safe Mode is, in essence, to remove any trading signals that would end of being false/bad moves. Usually resulting in less Overall Trades, a higher Net Profit, higher % Profitable, higher Profit Factor AND a lower Drawdown. Use Safe Mode to help eliminate orders that would otherwise be placed in choppy markets.
- Stop Loss/Take Profit Settings
This is where Crypto Scalper Pro really proves itself, Money Management. We have an editable Fixed SL/TP, as well as Trailing Stops for Long or Short orders, all of which you can use on their own, or combined with each other. Playing with these settings can turn an un-profitable system into a very-profitable trading plan!
-----------
For more information and a FREE 7-Day Trial with the Crypto Scalper Pro Strategy visit the link in our signature.
Good Luck and Happy Trading!
Tìm kiếm tập lệnh với "profit factor"
SPX-1D (Strategy) - S&P daily modelWith 2000 likes I will publish the "Study version" that allows you to get alerts and and pre-alerts (triggered a few minutes before the end of the previous day).
Be advised that this model applied to real data will get lower factors. My guesstimate would be a profit factor between 3 and 7, for a percent profitability around 66%.
Invest wisely, a model can only predict some of the predictable moves. In case of doubt, get out of the risk.

Boilerplate Configurable Strategy [Yosiet]This is a Boilerplate Code!
Hello! First of all, let me introduce myself a little bit. I don't come from the world of finance, but from the world of information and communication technologies (ICT) where we specialize in data processing with the aim of automating it and eliminating all human factors and actors in the processes. You could say that I am an algotrader.
That said, in my journey through trading in recent years I have understood that this world is often shown to be incomplete. All those who want to learn about trading only end up learning a small part of what it really entails, they only seek to learn how to read candlesticks. Therefore, I want to share with the entire community a fraction of what I have really understood it to be.
As a computer scientist, the most important thing is the data, it is the raw material of our work and without data you simply cannot do anything. Entropy is simple: Data in -> Data is transformed -> Data out.
The quality of the outgoing data will directly depend on the incoming data, there is no greater mystery or magic in the process. In trading it is no different, because at the end of the day it is nothing more than data. As we often say, if garbage comes in, garbage comes out.
Most people focus on the results only, on the outgoing data, because in the end we all want the same thing, to make easy money. Very few pay attention to the input data, much less to the process.
Now, I am not here to delude you, because there is no bigger lie than easy money, but I am here to give you a boilerplate code that will help you create strategies where you only have to concentrate on the quality of the incoming data.
To the Point
The code is a strategy boilerplate that applies the technique that you decide to customize for the criteria for opening a position. It already has the other factors involved in trading programmed and automated.
1. The Entry
This section of the boilerplate is the one that each individual must customize according to their needs and knowledge. The code is offered with two simple, well-known strategies to exemplify how the code can be reused for your own benefits.
For the purposes of this post on tradingview, I am going to use the simplest of the known strategies in trading for entries: SMA Crossing
// SMA Cross Settings
maFast = ta.sma(close, length)
maSlow = ta.sma(open, length)
The Strategy Properties for all cases published here:
For Stock TSLA H1 From 01/01/2025 To 02/15/2025
For Crypto XMR-USDT 30m From 01/01/2025 To 02/15/2025
For Forex EUR-USD 5m From 01/01/2025 To 02/15/2025
But the goal of this post is not to sell you a dream, else to show you that the same Entry decision works very well for some and does not for others and with this boilerplate code you only have to think of entries, not exits.
2. Schedules, Days, Sessions
As you know, there are an infinite number of markets that are susceptible to the sessions of each country and the news that they announce during those sessions, so the code already offers parameters so that you can condition the days and hours of operation, filter the best time parameters for a specific market and time frame.
3. Data Filtering
The data offered in trading are numerical series presented in vectors on a time axis where an endless number of mathematical equations can be applied to process them, with matrix calculation and non-linear regressions being the best, in my humble opinion.
4. Read Fundamental Macroeconomic Events, News
The boilerplate has integration with the tradingview SDK to detect when news will occur and offers parameters so that you can enable an exclusion time margin to not operate anything during that time window.
5. Direction and Sense
In my experience I have found the peculiarity that the same algorithm works very well for a market in a time frame, but for the same market in another time frame it is only a waste of time and money. So now you can easily decide if you only want to open LONG, SHORT or both side positions and know how effective your strategy really is.
6. Reading the money, THE PURPOSE OF EVERYTHING
The most important section in trading and the reason why many clients usually hire me as a financial programmer, is reading and controlling the money, because in the end everyone wants to win and no one wants to lose. Now they can easily parameterize how the money should flow and this is the genius of this boilerplate, because it is what will really decide if an algorithm (Indicator: A bunch of math equations) for entries will really leave you good money over time.
7. Managing the Risk, The Ego Destroyer
Many trades, little money. Most traders focus on making money and none of them know about statistics and the few who do know something about it, only focus on the winrate. Well, with this code you can unlock what really matters, the true success criteria to be able to live off of trading: Profit Factor, Sortino Ratio, Sharpe Ratio and most importantly, will you really make money?
8. Managing Emotions
Finally, the main reason why many lose money is because they are very bad at managing their emotions, because with this they will no longer need to do so because the boilerplate has already programmed criteria to chase the price in a position, cut losses and maximize profits.
In short, this is a boilerplate code that already has the data processing and data output ready, you only have to worry about the data input.
“And so the trader learned: the greatest edge was not in predicting the storm, but in building a boat that could not sink.”
DISCLAIMER
This post is intended for programmers and quantitative traders who already have a certain level of knowledge and experience. It is not intended to be financial advice or to sell you any money-making script, if you use it, you do so at your own risk.

TradingIQ - Impulse IQIntroducing "Impulse IQ" by TradingIQ
Impulse IQ is an exclusive trading algorithm developed by TradingIQ, designed to trade breakouts and established trends. By integrating artificial intelligence and IQ Technology, Impulse IQ analyzes historical and real-time price data to construct a dynamic trading system adaptable to various asset and timeframe combinations.
Philosophy of Impulse IQ
Impulse IQ combines IQ Technology (AI) with the classic principles of trend and breakout trading. Recognizing that markets inherently follow trends that need to persist for significant price movements to unfold, Impulse IQ eliminates the need for rigid settings or manual intervention.
Instead, it dynamically develops, adapts, and executes trend-based trading strategies, enabling a more responsive approach to capturing meaningful market opportunities.
Impulse IQ is designed to work straight out of the box. In fact, its simplicity requires just one user setting, making it incredibly straightforward to manage.
Strategy type is the only setting that controls Impulse IQ’s functionality.
Traders don’t have to spend hours adjusting settings and trying to find what works best - Impulse IQ handles this on its own.
Key Features of Impulse IQ
Self-Learning Breakout Detection
Employs IQ Technology to identify breakouts.
AI-Generated Trading Signals
Provides breakout trading signals derived from self-learning algorithms.
Comprehensive Trading System
Offers clear entry and exit labels.
AI-Determined Trailing Profit Target and Stop Loss
Position exit levels are clearly defined and calculated by the AI once the trade is entered.
Performance Tracking
Records and presents trading performance data, easily accessible for user analysis.
Long and Short Trading Capabilities
Supports both long and short positions to trade various market conditions.
IQ Meter
The IQ Meter details where price is trading relative to a higher timeframe trend and lower timeframe trend. Fibonacci levels are interlaced along the meter, offering unique insights on trend retracement opportunities.
Self Learning, Multi Timeframe IQ Zig Zags
The Zig Zag IQ is a self-learning, multi-timeframe indicator that adapts to market volatility, providing a clearer representation of market movements than traditional zig zag indicators.
Dual Strategy Execution
Impulse IQ integrates two distinct strategy types: Breakout and Cheap (details explained later).
How It Works
Before diving deeper into Impulse IQ, it's essential to understand the core terminology:
Zig Zag IQ : A self-learning trend and breakout identification mechanism that serves as the foundation for Impulse IQ. Although it belongs to the “Zig Zag” class of technical indicators, it's powered by IQ Technology.
Impulse IQ : A self-learning trading strategy that executes trades based on Zig Zag IQ. Zig Zag IQ identifies market trends, while Impulse IQ adapts, learns, and executes trades based on these trend characterizations.
Impulse IQ operates on a simple heuristic: go long during upside volatility and go short during downside volatility, essentially capturing price breakouts.
The definition of a “price breakout” is determined by IQ Technology, TradingIQ's exclusive AI algorithm. In Impulse IQ, the algorithm utilizes two IQ Zig Zags (self-learning, multi-timeframe zig zags) to analyze and learn from market trends.
It identifies breakout opportunities by recognizing violations of established price levels marked by the IQ Zig Zags. Impulse IQ then adapts and evolves to trade similar future violations in a recurring and dynamic manner.
Put simply, IQ Zig Zags continuously learn from both historical and real-time price updates to adjust themselves for an "optimal fit" to price data. The aim is to adapt so that the marked price tops and bottoms, when violated, reveal potential breakout opportunities.
The strategy layer of IQ Zig Zags, known as Impulse IQ, incorporates an additional level of self-learning with IQ Technology. It learns from breakout signals generated by the IQ Zig Zags, enabling it to dynamically identify and signal tradable breakouts. Moreover, Impulse IQ learns from historical price data to manage trade exits.
All positions start with an initial fixed stop loss and a trailing stop target. Once the trailing stop target is reached, the fixed stop loss converts into a trailing stop, allowing Impulse IQ to remain in the breakout/trend until the trailing stop is triggered.
What Classifies as a Breakout, Price Top, and Price Bottom?
For Impulse IQ:
Price tops are considered the highest price achieved before a price bottom forms.
Price bottoms are the lowest price reached before a price top forms.
For price tops, the highest price continues to be calculated until a significant downside price move occurs. Similarly, for price bottoms, the lowest price is calculated until a significant upside price move happens.
What distinguishes Zig Zag IQ from other zig zag indicators is its unique mechanism for determining a "significant counter-trend price move." Zig Zag IQ evaluates multiple fits to identify what best suits the current market conditions. Consequently, a "significant counter-trend price move" in one market might differ in magnitude from what’s considered "significant" in another, allowing it to adapt to varying market dynamics.
For example, a 1% price move in the opposite direction might be substantial in one market but not in another, and Zig Zag IQ figures this out internally.
The image above illustrates the IQ Zig Zags in action. The solid Zig Zag IQ lines represent the most recent price move being calculated, while the dotted, shaded lines display historical price moves previously analyzed by IQ Zig Zag.
Notice how the green zig zag aligns with a larger trend, while the purple zig zag follows a smaller trend. This mechanism is crucial for generating breakout signals in Impulse IQ: for a position to be entered, the breakout of the smaller trend must occur in the same direction as the larger trend.
The image above depicts the IQ Meters—an exclusive TradingIQ tool designed to help traders evaluate trend strength and retracement opportunities.
When the lower timeframe Zig Zag IQ and the higher timeframe Zig Zag IQ are out of sync (i.e., one is uptrending while the other is downtrending, with no active positions), the meters display a neutral color, as shown in the image.
The key to using these meters is to identify trend unison and pinpoint key trend retracement entry opportunities. Fibonacci retracement levels for the current trend are interlaced along each meter, and the current price is converted to a retracement ratio of the trend.
These meters can mathematically determine where price stands relative to the larger and smaller trends, aiding in identifying entry opportunities.
The top of each meter indicates the highest price achieved during the current price move.
The bottom of each meter indicates the lowest price achieved during the current price move.
When both the larger and smaller trends are in sync and uptrending, or when a long position is active, the IQ meters turn green, indicating uptrend strength.
When both trends are in sync and downtrending, or when a short position is active, the IQ meters turn red, indicating downtrend strength.
The image above shows the Point of Change for both the larger and smaller Zig Zag IQ trends. A distinctive feature of Zig Zag IQ is its ability to calculate these turning points in advance—unlike most traditional zig zag indicators that lack predetermined turning points and often lag behind price movements. In contrast, Zig Zag IQ offers a minimal-lag trend detection capability, providing a more responsive representation of market trends.
Simply put, once the market Zig Zag anchors are touched, the corresponding Zig Zag IQ will change direction.
Trade Signals
Impulse IQ can trade in one of two ways: Entering breakouts as soon as they happen (Breakout Strategy Type) or entering the pullback of a price breakout (Cheap Strategy Type).
Generally, the Breakout Strategy type will take a greater number of trades and enter a breakout quicker. The Cheap Strategy type will usually take less trades, but potentially enter at a better time/price point, prior to the next leg up of a break up, or the next leg down of a break down.
Entry signals are given when price breaks out to the upside or downside for the "Breakout" strategy type, or for the "Cheap" strategy type, when price retraces to the level it broke out from!
Breakout Strategy Example
The image above demonstrates a long position entered and exited using the Breakout strategy. The price breakout level is marked by the dotted, horizontal green line, representing a previously established price high identified by IQ Zig Zag. Once the price breaks and closes above this level, a long position is initiated.
After entering a long position, Impulse IQ immediately displays the initial fixed stop price. As the price moves favorably for the long position, the trailing stop conversion level is reached, and the indicator switches to a trailing stop, as shown in the image. Impulse IQ continues to "ride the trend" for as long as it persists, exiting only when the trailing stop is triggered.
Cheap Strategy Example
The image above shows a short entry executed using the Cheap strategy. The aim of the Cheap strategy is to enter on a pullback before the breakout occurs. While this results in fewer trades if price doesn’t pull back before the breakout, it typically allows for a better entry time and price point when a pullback does happen.
The image above illustrates the remainder of the trade until the trailing stop was hit.
Green Arrow = Long Entry
Red Arrow = Short Entry
Blue Arrow = Trade Exit
Impulse IQ calculates the initial stop price and trailing stop distance before any entry signals are triggered. This means users don’t need to constantly tweak these settings to improve performance—Impulse IQ handles this process internally.
Verifying Impulse IQ’s Effectiveness
Impulse IQ automatically tracks its performance and displays the profit factor for both its long and short strategies, visible in a table located in the top-right corner of your chart.
The image above shows the profit factor for both the long and short strategies used by Impulse IQ.
A profit factor greater than 1 indicates that the strategy was profitable when trading historical price data.
A profit factor less than 1 indicates that the strategy was unprofitable when trading historical price data.
A profit factor equal to 1 indicates that the strategy neither gained nor lost money on historical price data.
Using Impulse IQ
While Impulse IQ functions as a comprehensive trading system with its own entry and exit signals, it was designed for the manual trader to take its trading signals and analysis indications to greater heights - offering numerous applications beyond its built-in trading system.
The standout feature of Impulse IQ is its ability to characterize and capitalize on trends. Keeping a close eye on “Breakout” labels and making use of the IQ meter is the best way to use Impulse IQ.
The IQ Meters can be used to:
Find entry points during trend retracements
Assess trend alignment across higher and lower timeframes
Evaluate overall trend strength, indicating where the price lies on both IQ Meters.
Additionally, "Break Up" and "Break Down" labels can be identified for anticipating breakouts. Impulse IQ self-learns to capture breakouts optimally, making these labels dynamic signals for predicting a breakout.
The Zig Zag IQ indicators are instrumental in characterizing the market's current state. As a self-learning tool, Zig Zag IQ constantly adapts to improve the representation of current price action. The price tops and bottoms identified by Zig Zag IQ can be treated as support/resistance and breakout levels.
Of course, you can set alerts for all Impulse IQ entry and exit signals, effectively following along its systematic conquest of price movement.

Scalper Bot [SMRT Algo]The SMRT Algo Bot is a trading strategy designed for use on TradingView, enabling traders to backtest and refine their strategies with precision. This bot is built to provide key performance metrics through TradingView’s strategy tester feature, offering insights such as net profit, maximum drawdown, profit factor, win rate, and more.
The SMRT Algo Bot is versatile, allowing traders to execute either pro-trend or contrarian strategies, each with customizable parameters to suit individual trading styles.
Traders can automate the bot to their brokerage platform via webhooks and use third-party software to facilitate this.
Core Features:
Backtesting Capabilities: The SMRT Algo Bot leverages TradingView’s powerful strategy tester, allowing traders to backtest their strategies over historical data. This feature is crucial for assessing the viability of a strategy before deploying it in live markets. By providing metrics such as net profit, maximum drawdown, profit factor, and win rate, traders can gain a comprehensive understanding of their strategy's performance, helping them to make informed decisions about potential adjustments or optimizations.
Advanced Take Profit and Stop Loss Methods: The SMRT Algo Bot offers multiple methods for setting Take Profit (TP) and Stop Loss (SL) levels, providing flexibility to match different market conditions and trading strategies.
Take Profit Methods:
- Normal (Percent-based): Traders can set their TP levels as a percentage. This method adjusts the TP dynamically based on market volatility, allowing for more responsive profit-taking in volatile markets.
- Donchian Channel: Alternatively, the bot can use the Donchian Channel to set TP levels, which is particularly useful in trend-following strategies. The Donchian Channel identifies the highest high and lowest low over a specified period, providing a clear target for profit-taking when prices reach extreme levels.
Stop Loss Methods:
- Percentage-Based Stop Loss: This method allows traders to set a fixed percentage of the entry price as the stop loss. It provides a straightforward, static risk management approach that is easy to implement.
- Normal (Percent-based): Traders can set their SL levels as a percentage. This method adjusts the SL dynamically based on market volatility, allowing for more responsive profit-taking in volatile markets.
- ATR Multiplier: Similar to the TP method, the SL can also be set using a multiple of the ATR.
Pro-Trend and Contrarian Strategies: The SMRT Algo Bot is designed to execute either pro-trend or contrarian trading strategies, though only one can be active at any given time.
Pro-Trend Strategy: This strategy aligns with the prevailing market trend, aiming to capitalize on the continuation of current price movements. It is particularly effective in trending markets, where momentum is expected to carry the price further in the direction of the trend.
Contrarian Strategy: In contrast, the contrarian strategy seeks to exploit potential reversals or corrections, trading against the prevailing trend. This approach is more suitable in overextended markets where a pullback is anticipated. Traders can switch between these strategies based on their market outlook and trading style.
Dashboard Display: A dashboard located in the bottom right corner of the TradingView interface provides real-time updates on the bot’s performance metrics. This includes key statistics such as net profit, drawdown, profit factor, and win rate, specific to the current instrument being tested. This immediate access to performance data allows traders to quickly assess the effectiveness of the strategy and make necessary adjustments on the fly.
Input Settings:
Reverse Signals: If turned on, buy trades will be shown as sell trades, etc.
Show Signal (Bar Color): Shows the signal bar as a green candle for buy or red candle for sell.
RSI: Used as a filter for one of the conditions for trade. Can be turned on/off by clicking on the checkbox.
Timeframe: Affects the timeframe of RSI filter.
Length: Length of RSI used in measurement.
First Cross: Whether or not to factor in the first RSI cross in the calculation.
Buy/Sell (Above/Below): Look for trades if RSI is above or below these values.
EMA: Used as a trend filter for one of the conditions for trade. Can be turned on/off by clicking on the checkbox.
Timeframe: Affects the timeframe of EMA filter.
Fast Length: Value for the fast EMA.
Middle Length: Value for the middle EMA
Slow Length: Value for the slow EMA.
ADX: Used as a volatility filter for one of the conditions for trade. Can be turned on/off by clicking on the checkbox.
Threshold: Threshold value for ADX.
ADX Smoothing: Smoothing value for the ADX
DI Length: DI length value for the ADX.
Donchian Channel Length: This value affects the length value of the DC. Used in TP calculation.
Close Trade On Opposite Signal: If true, the current trade will close if an opposite trade appears.
RSI: If turned on, it will also use the RSI to exit the trade (overextended zones).
Take Profit Option: Choose between normal (percentage-based) and Donchian Channel options.
Stop Loss Option: Choose between normal (percentage-based) and Donchian Channel options.
The SMRT Algo Bot’s components are designed to work together seamlessly, creating a comprehensive trading solution. Whether using the ATR multiplier for dynamic adjustments or the Donchian Channel for trend-based targets, these methods ensure that trades are managed effectively from entry to exit. The ability to switch between pro-trend and contrarian strategies offers adaptability, enabling traders to optimize their approach based on market behavior. The real-time dashboard ties everything together, providing continuous feedback that informs strategic adjustments.
Unlike basic or open-source bots, which often lack the flexibility to adapt to different market conditions, the SMRT Algo Bot provides a robust and dynamic trading solution. The inclusion of multiple TP and SL methods, particularly the ATR and Donchian Channel, adds significant value by offering traders tools that can be finely tuned to both volatile and trending markets.
The SMRT Algo Suite, which the SMRT Algo Bot is a part of, offers a comprehensive set of tools and features that extend beyond the capabilities of standard or open-source indicators, providing significant additional value to users.
What you also get with the SMRT Algo Suite:
Advanced Customization: Users can customize various aspects of the indicator, such as toggling the confirmation signals on or off and adjusting the parameters of the MA Filter. This customization enhances the adaptability of the tool to different trading styles and market conditions.
Enhanced Market Understanding: The combination of pullback logic, dynamic S/R zones, and MA filtering offers traders a nuanced understanding of market dynamics, helping them make more informed trading decisions.
Unique Features: The specific combination of pullback logic, dynamic S/R, and multi-level TP/SL management is unique to SMRT Algo, offering features that are not readily available in standard or open-source indicators.
Educational and Support Resources: As with other tools in the SMRT Algo suite, this indicator comes with comprehensive educational resources and access to a supportive trading community, as well as 24/7 Discord support.
The educational resources and community support included with SMRT Algo ensure that users can maximize the indicators’ potential, offering guidance on best practices and advanced usage.
SMRT Algo believe that there is no magic indicator that is able to print money. Indicator toolkits provide value via their convenience, adaptability and uniqueness. Combining these items can help a trader make more educated; less messy, more planned trades and in turn hopefully help them succeed.
RISK DISCLAIMER
Trading involves significant risk, and most day traders lose money. All content, tools, scripts, articles, and educational materials provided by SMRT Algo are intended solely for informational and educational purposes. Past performance is not indicative of future results. Always conduct your own research and consult with a licensed financial advisor before making any trading decisions.

Seer's HutThis is a strategy based on Exponential Moving Averages or Volume Weighted Moving Averages against Adaptive fib resistance / support level and profit percentage which can be definetly defined by user and targeting small profits(profits will be raised by leverages).
In this strategy, there are predefined values which are collected one by one with statistical background and backtests. This gives an advantage to see which ratios are working better for each symbol. Also this statistics are re-evaluated monthly and if there is a need they are going to be changed with the help of libraries. Also IT IS RECOMMENDED TO USE IN DAILY INTERVAL GRAPHICS!!!!
When we deep dive to strategy, it is based on profit percentages. it is similar to the MOST system. MOST only changes the way with default value of %2. But this hardcoded strategy is not working well with each Symbol.
So this is the point where DC and ADR Statistics are involved.
For Ex. while BTC is suits well with %2, it does not do wonders for RSR or RUNE which is 4-5% for each.
There is 3 options for setting the statistical usage of this indicator.
1. Auto calculated based on 1000 days of ADR and DC
imgur.com
2. Using Library where statistical values are stored.
imgur.com
3. User-defined values used. Yeah you read it right. Fully on-demand changes are supported. Which gives freedom to users for setup their own Adaptive FIB and Profit Percentages.
imgur.com
Based on this 3 options, TP and SL points are calculated on bar closures. Strategy Orders are also shown / raised with the closures.
Ok, system calculates these values but how to read / use them. what is this strategy based on ?
This strategy is mostly looking for minimizing the LOSS in case of any stop. So because of this, in each TP, system gives order signal to close half of the remaining open position.
There are 7 type of orders
OL : Open Long (Close Short and Open Long if in position)
CL 50 : Close Long - %50 of Open Position
CL 100 : Close Long - Close all position
OS : Open Short (Close Long and Open Short if in position)
CL 50 : Close Short - %50 of Open Position
CL 100 : Close Short - Close all position
TP5 : Highest TP reached. Close all position.
Script checks cross of EMA / VWMA and adFib to decide open a position. In reversal / crosses, adFib line had been set to defined Fib. Percentage (FP) level.
For creating the TP points, Profit Percentage (PP) parameter had been used which I briefly introduce at the beginning with the options.
One important topic about this strategy, it is not stacking / pyramiding the positions. Which means, it always calculate one way position. For example we are in the long position after OL signal.
We reached TP values and take profits. Later on due to FP crossing EMA, OS order signal given. This means you have to close all long position and open short position.
But beware. These calculated points are based on given values or calculated regarding to average ADR / DC ratings. For supporting strategy, several methods also had been included in the options.
imgur.com
These are:
1. MA plotting (Optional 4 EMA, 1WMA) - checking for Golden and Death Cross
2. Bollinger Bands (Length 25 and Multiplier 2.5 set as default. Used in correlation with TEMA)
3. Kama 2 / Kama 5 - Crossing speaks of Trend way
4. TEMA (TEMA 50, VWMA 25 calculations and plotting. Used for TEMA 50 / VWMA 25 / SMA 25 cross checks for weakening or strengthening trend analysis)
5. ATR plotting
6. Chandelier Exit plotting (Widely used for calculating Stop levels in market)
7. PSAR (Widely used for indicating trend reversal)
Also for the ease of use, if the users does not want to plot any values on the graph and just want to see the values there is couple of tables also included.
1. EMA info
2. KAMA info
3. Order info
4. TP/SL info
imgur.com
Some important notes:
1. To minimize the stop just after the order opening candle in volatile grounds, system prevents to raise new order signals if there is a signal already raised in last 4 candle.
2. if system reach and give close order in one of the TP points (For Ex TP1.), then index goes down and goes up again same TP (above TP1 in scenario) after 4 candle, system gives a close order signal again in the same TP.
3. There is a Profit Factor value had been shown at Order Info table. This information shows how profitable is the setup regarding to given FP and PP values.
In general market conditions, A Profit Factor above 1.50 is considered good enough and above 2.0 it is considered ideal. A strategy with profit factor less than 1.20 suggests too bigger a risk taken for making money.
In some cases automatic ADR and DC calculations are not good enough. so if you want to find a good Profit Factor value, you can change the system automatic calculation to manual value entering and you can see the results directly with in this field.

[Strategy]Turtle's 20day High Low Break StrategyJapanese below / 日本語説明は下記
Overview
I have made this strategy mimicking the legendary traders group, Turtle’s 20days high low break strategy with more options available for take profit(TP) and stop loss(SL) conditions.
The main component of the strategy is same as my indicator, Previous N days/weeks/months high/low(see the link below) and with this strategy, you can backtest previous N days high/low break strategy.
Unlike the indicator, you can specify another previous N days high/low as TP condition. This is because Turtle used 10days low as TP condition for 20days high break buy strategy, according to articles/books about them.
ATR and other factors which is said to be used in their original strategy are not included in this strategy.
Previous N Days/Weeks/Months High Low
What is Turtle?
Turtle is the group of traders founded by Richard Dennis and William Eckhardt to prove their theory that good traders can be trained or not.
It is said that Turtle had made more than 175 million dollars over 5 years and some of the traders has become fund managers or successful individual traders even after the experiment.
What is this strategy like?
The strategy generates long entries once prices break previous N days highs and short entries when previous N days lows broken.
N is user input so you can adjust it for your own strategy.
As mentioned above, you can also specify another set of different previous N days high/low for TP conditions.
e.g. 55 days high(low) break for entry and 20days low(high) break for take profit condition.
How to use it?
What this strategy shows is almost same as the indicator, Previous N days/weeks/months high/low.
It displays previous N days/weeks/months highs and lows and you can set up entry condition based on previous N days high/low.
Previous N weeks/months highs/lows can be used as take profit points when you develop your own strategy based on this.
See the parameters below for the rest of the details.
Parameters
TP condition:
You can select from “Pips”, “When opposite entries” or “Previous high low break”.
When “When opposite entries” selected, the strategy exits the open positions when opposite directional entries happened. e.g. Long positions will be closed when short entries made.
If you would like to exit positions with specific previous N days highs/lows, you can enter N in Previous N days High/Low for TP field with “Previous high low break” selected.
SL condition:
You can select from “Pips” or “Swing High/Low”.
If “Swing High/Low” selected, left bars and right bars need input to determine swing high/low.
Note: If you select “pips” in TP/SL conditions, it currently works only for forex pairs.
What timeframe is the best for this strategy?
As this strategy is for swing trading, longer timeframes are the best.
Base on my quick check upon strategy’s performance over USD pairs in forex, daily timeframe works best, however, it could fit in with lower timeframes such as 4H and 1H by adjusting TP/SL conditions.
Look at the sample result below. The result shows the strategy’s performance for USDJPY for over 40 years on Daily timeframe and it performs fairly good with more than 2 profit factor over long period of time with up-trending equity curve.
It is just a simulation but the data shows Turtle’s strategy still works.
=================
概要
伝説のトレーダー集団タートルの20日高値・安値ブレイク手法を模倣して作成したストラテジーです。
利益確定や損切り条件を設定可能なようにして、より柔軟性を持たせています。
ストラテジーの主要な構造は過去にリリースしたインジケーターPrevious N days/weeks/months high/lowと同じです(下記リンク参照)。
このストラテジーを使うと、過去N日高値・安値のブレイク手法のバックテストを行うことが可能です。
また、前述のインジケーターとは異なり、このストラテジーでは利益確定条件のために、もう一つ別の過去N日高値・安値を設定することができます。これはタートルが20日高値のブレイクで買いエントリーを行う場合、10日安値ブレイクを手仕舞いの基準として使っていたことからです。
タートルのオリジナル手法ではATRやその他の要素も用いられていたようですが、このストラテジーには含まれていません。
Previous N Days/Weeks/Months High Low
タートルとは何か?
タートルとは、「優れたトレーダーは育成可能か?」の問いを証明するために、投資家リチャード・デニス氏とウィリアム・エックハート氏によって組織されたトレーダー集団です。
タートルは5年間に渡って1億7千5百万ドル以上を稼ぎ出したと言われており、この実験終了後にはヘッジファンドを運営する者や個人投資家として成功したトレーダーを輩出したことで知られています。
このストラテジーの特徴
このストラテジーは、価格が過去N日高値をブレイクした時にロングエントリーを、過去N日安値をブレイクした時にショートエントリーを実行します。
Nはパラメーターで指定可能なので、皆さんの独自の手法開発のために調整することができます。
また、前述の通り、利益確定条件としてエントリー条件とは別の過去N日高値・安値を指定することが可能です。
例:エントリーには55日の高値・安値のブレイクを用い、決済には20日高値・安値のブレイクを用いるなど。
使い方
このストラテジーは前述のインジケーターとほぼ同じ内容のラインを表示します。
過去N日、N週間、Nヶ月の高値・安値を表示でき、エントリーの条件として過去N日高値・安値を指定することができます。
過去N週・Nヶ月高値・安値ラインは利益確定の目安に用いるなど、皆さんが独自の手法を構築するときの参考として使ってください。
その他のパラメーターについては以下の詳細を参照ください。
パラメーター:
TP condition(利益確定条件):
“Pips(Pips指定)”, “When opposite entries(逆方向エントリー時)” or “Previous N days high low break(過去N日高値・安値)”から選択することができます。
“When opposite entries” を選択した場合、現在のポジションは、現在ポジションとは逆方向のエントリー条件が満たされた時に、決済されます。
例: ロングポジションはショートのエントリーが実行されると同時に決済される。
特定の過去N日高値・安値ブレイクを決済条件としたい場合は、“Previous N days high low break”を選択の上、該当するN日を”Previous N days High/Low for TP”の項目に入力してください。
SL condition(損切り基準):
“Pips(Pips指定)”、“Swing High/Low(スウィングハイ・ロー)”から選択することができます。
“Swing High/Low”選択時は、高値・安値決定に必要な左右のバーの本数を指定します。
注:TP、SL条件でPipsを選択した場合は、現時点では為替通貨ペアのみに機能します。
このストラテジーに最適の時間軸は?
当ストラテジーはスウィングトレードの手法となっているため、長期の時間軸が適しています。
為替のドルストレートペアでの結果を見てみると日足が最も適していますが、利益確定や損切り条件を調整することで、4時間足や1時間足向きにもアレンジできると思います。
上に示したストラテジーの例は、ドル円の日足における過去40年間以上でのバックテストの結果ですが、これだけの長期に渡って右上がりのエクイティカーブとともにプロフィットファクター2近くを維持するなど、かなり良い結果と言えるのではないでしょうか。
これは一つのシミュレーション結果に過ぎませんが、データを見る限りタートルの手法は現在でも機能すると言えるでしょう。

[MT] Strategy Backtest Template| Initial Release | | EN |
An update of my old script, this script is designed so that it can be used as a template for all those traders who want to save time when programming their strategy and backtesting it, having functions already programmed that in normal development would take you more time to program, with this template you can simply add your favorite indicator and thus be able to take advantage of all the functions that this template has.
🔴Stop Loss and 🟢Take Profit:
No need to mention that it is a Stop Loss and a Take Profit, within these functions we find the options of: fixed percentage (%), fixed price ($), ATR, especially for Stop Loss we find the Pivot Points, in addition to this, the price range between the entry and the Stop Loss can be converted into a trailing stop loss, instead, especially for the Take Profit we have an option to choose a 1:X ratio that complements very well with the Pivot Points.
📈Heikin Ashi Based Entries:
Heikin Ashi entries are trades that are calculated based on Heikin Ashi candles but their price is executed to Japanese candles, thus avoiding false results that occur in Heikin candlestick charts, this making in certain cases better results in strategies that are executed with this option compared to Japanese candlesticks.
📊Dashboard:
A more visual and organized way to see the results and necessary data produced by our strategy, among them we can see the dates between which our operations are made regardless if you have activated some time filter, usual data such as Profit, Win Rate, Profit factor are also displayed in this panel, additionally data such as the total number of operations, how many were gains and how many losses, the average profit and loss for each operation and finally the maximum profits and losses followed, which are data that will be very useful to us when we elaborate our strategies.
Feel free to use this template to program your own strategies, if you find errors or want to request a new feature let me know in the comments or through my social networks found in my tradingview profile.
| Update 1.1 | | EN |
➕Additions: '
Time sessions filter and days of the week filter added to the time filter section.
Option to add leverage to the strategy.
5 Moving Averages, RSI, Stochastic RSI, ADX, and Parabolic Sar have been added as indicators for the strategy.
You can choose from the 6 available indicators the way to trade, entry alert or entry filter.
Added the option of ATR for Take Profit.
Ticker information and timeframe are now displayed on the dashboard.
Added display customization and color customization of indicator plots.
Added customization of display and color plots of trades displayed on chart.
📝Changes:
Now when activating the time filter it is optional to add a start or end date and time, being able to only add a start date or only an end date.
Operation plots have been changed from plot() to line creation with line.new().
Indicator plots can now be controlled from the "plots" section.
Acceptable and deniable range of profit, winrate and profit factor can now be chosen from the "plots" section to be displayed on the dashboard.
Aesthetic changes in the section separations within the settings section and within the code itself.
The function that made the indicators give inputs based on heikin ashi candles has been changed, see the code for more information.
⚙️Fixes:
Dashboard label now projects correctly on all timeframes including custom timeframes.
Removed unnecessary lines and variables to take up less code space.
All code in general has been optimized to avoid the use of variables, unnecessary lines and avoid unnecessary calculations, freeing up space to declare more variables and be able to use fewer lines of code.
| Lanzamiento Inicial | | ES |
Una actualización de mi antiguo script, este script está diseñado para que pueda ser usado como una plantilla para todos aquellos traders que quieran ahorrar tiempo al programar su estrategia y hacer un backtesting de ella, teniendo funciones ya programadas que en el desarrollo normal te tomaría más tiempo programar, con esta plantilla puedes simplemente agregar tu indicador favorito y así poder aprovechar todas las funciones que tiene esta plantilla.
🔴Stop Loss y 🟢Take Profit:
No hace falta mencionar que es un Stop Loss y un Take Profit, dentro de estas funciones encontramos las opciones de: porcentaje fijo (%), precio fijo ($), ATR, en especial para Stop Loss encontramos los Pivot Points, adicionalmente a esto, el rango de precio entre la entrada y el Stop Loss se puede convertir en un trailing stop loss, en cambio, especialmente para el Take Profit tenemos una opción para elegir un ratio 1:X que se complementa muy bien con los Pivot Points.
📈Entradas Basadas en Heikin Ashi:
Las entradas Heikin Ashi son operaciones que son calculados en base a las velas Heikin Ashi pero su precio esta ejecutado a velas japonesas, evitando así́ los falsos resultados que se producen en graficas de velas Heikin, esto haciendo que en ciertos casos se obtengan mejores resultados en las estrategias que son ejecutadas con esta opción en comparación con las velas japonesas.
📊Panel de Control:
Una manera más visual y organizada de ver los resultados y datos necesarios producidos por nuestra estrategia, entre ellos podemos ver las fechas entre las que se hacen nuestras operaciones independientemente si se tiene activado algún filtro de tiempo, datos usuales como el Profit, Win Rate, Profit factor también son mostrados en este panel, adicionalmente se agregaron datos como el número total de operaciones, cuantos fueron ganancias y cuantos perdidas, el promedio de ganancias y pérdidas por cada operación y por ultimo las máximas ganancias y pérdidas seguidas, que son datos que nos serán muy útiles al elaborar nuestras estrategias.
Siéntete libre de usar esta plantilla para programar tus propias estrategias, si encuentras errores o quieres solicitar una nueva función házmelo saber en los comentarios o a través de mis redes sociales que se encuentran en mi perfil de tradingview.
| Actualización 1.1 | | ES |
➕Añadidos:
Filtro de sesiones de tiempo y filtro de días de la semana agregados al apartado de filtro de tiempo.
Opción para agregar apalancamiento a la estrategia.
5 Moving Averages, RSI, Stochastic RSI, ADX, y Parabolic Sar se han agregado como indicadores para la estrategia.
Puedes escoger entre los 6 indicadores disponibles la forma de operar, alerta de entrada o filtro de entrada.
Añadido la opción de ATR para Take Profit.
La información del ticker y la temporalidad ahora se muestran en el dashboard.
Añadido personalización de visualización y color de los plots de indicadores.
Añadido personalización de visualización y color de los plots de operaciones mostradas en grafica.
📝Cambios:
Ahora al activar el filtro de tiempo es opcional añadir una fecha y hora de inicio o fin, pudiendo únicamente agregar una fecha de inicio o solamente una fecha de fin.
Los plots de operaciones han cambiados de plot() a creación de líneas con line.new().
Los plots de indicadores ahora se pueden controlar desde el apartado "plots".
Ahora se puede elegir el rango aceptable y negable de profit, winrate y profit factor desde el apartado "plots" para mostrarse en el dashboard.
Cambios estéticos en las separaciones de secciones dentro del apartado de configuraciones y dentro del propio código.
Se ha cambiado la función que hacía que los indicadores dieran entradas en base a velas heikin ashi, mire el código para más información.
⚙️Arreglos:
El dashboard label ahora se proyecta correctamente en todas las temporalidades incluyendo las temporalidades personalizadas.
Se han eliminado líneas y variables innecesarias para ocupar menos espacio en el código.
Se ha optimizado todo el código en general para evitar el uso de variables, líneas innecesarias y evitar los cálculos innecesarios, liberando espacio para declarar más variables y poder utilizar menos líneas de código.

Measure Volume, Momentum, Trend, VolatilityThis script displays the following indicators in one pane to quickly determine several important factors regarding price action. It allows the user to quickly see all of most important factors surrounding price action in one pane with one quick glance. This should be incredibly helpful and allow things like double divergence and trend confirmation to be spotted much more quickly. I personally use the data in this indicator to replace four separate indicators and it has brought my win rate and profit factor significantly higher. I hadn't seen any place where all of the best J. Welles Wilder indicators such as RSI, Parabolic SAR, and DMI/ADX were brought into one easy to use interface. This is my attempt at fixing that gap. For a much deeper understanding of how to use these indicators, I recommend reading New Concepts in Technical Trading Systems written by J. Welles Wilder.
Momentum via RSI (Relative Strength Index)
Volume via MFI (Money Flow Index)
Volatility via DMI/ADX (Direction Movement Index/Average Directional Index)
Trend via Parabolic SAR (Parabolic Stop and Reverse)
It is worth noting that DMI/ADX and Parabolic SAR can both help determine trend strength and volatility.
The Volatility mechanism is measured by DMI and ADX and displayed at the top of the pane using circles. The top, tiny circles reflect if show if positive DI or negative DI has a higher value. The small circles directly underneath indicate whether or not the ADX is above 20 (configurable, some may choose to increase this to 25 or even 30).
The Momentum mechanism is shown as standard RSI with the default being a white line and default period of 14, which is all configurable.
The Volume mechanism is shown as standard MFI with the default being a fuchsia line and default period of 14, which is also configurable.
The momentum and volume oscillators should be used in conjunction to help spot whether the trend is strong or weak using divergences and the middle, overbought, and oversold levels. These levels are also configurable.
The Trend mechanism is measured by Parabolic SAR and displayed at the bottom of the pane using diamonds. The default is red diamonds when in a bear trend, green when in an uptrend which is configurable. When price is above the Parabolic SAR, it is considered to be an uptrend. When price is below the Parabolic SAR, it is considered to be a downtrend. The way price is measured is also configurable (i.e. open, close, ohlc4, hlc3, etc.). When price crossed above or below the Parabolic SAR, the diamonds will change colors.
All the indicators displayed should be used in a well rounded strategy. For instance, I only trade when ADX is above 20 and rarely trade against the trend shown via PSAR. When trend shifts and divergences helped indicate a trend shift would occur using the RSI and MFI, it can be a great spot to take an entry. RSI/MFI can also confirm the trend is strong when they are not showing divergences and inline with price action. All of this data should be used in conjunction with good fundamental data and technical levels. Divergences with RSI and MFI on double tops or bottoms can also be incredibly powerful. There is no right or wrong way to use all the data displayed in this indicator, however using all four pillars of trading (Momentum, Volume, Trend, Volatility) will help ensure only the best trades are taken.

Grover Llorens Activator Strategy AnalysisThe Grover Llorens Activator is a trailing stop indicator deeply inspired by the parabolic SAR indicator, and aim to provide early exit points and reversal detection. The indicator was posted not so long ago, you can find it here :
Today a strategy using the indicator is proposed, and its profitability is analyzed on 3 different markets with the main time frame being 1 hour, remember that lower time frames involve lower absolute price changes, therefore we are way more affected by the spread, and we can require a larger position sizing depending on our investment target, trading higher time-frames is always a good practice and this is why 1 hour is selected. Based on the result we might make various conclusions regarding the indicator accuracy and might have ideas on future improvements of the indicator.
I'am not great when it comes to strategy design, i still hope to share correct and useful information in this post, let me know your thoughts on the post format and if i should make more of these.
Setup And Rules
The analysis is solely based on the indicator signals, money management isn't taken into account, this allow us to have an idea on the indicator robustness and resilience, particularly on extremely volatile markets and ones exhibiting a chaotic structure, altho it is normally good practice to close any position before a market closure in order to avoid any potential major gaps.
The settings used are 480 for length and 14 for mult, this create relatively mid term signals that are suited for a trend indicator such as the Grover Llorens Activator, unfortunately we can't infer the indicator optimal settings, thats how it is with any technical indicator anyway.
Here are the rules of our strategy :
long : closing price cross over the indicator
short : closing price cross under the indicator
We use constant position sizing, once a signal is triggered all the previous positions are closed.
Description Of The Statistics Used
Various statistics are presented in this post, here is a brief description of the main ones :
Percent Profitability (higher = better): Percentage of winning trades, that is : winning trades/total number of trades × 100
Maximum Drawdown (lower = better) : The highest difference between a peak and a valley in the balance, that is : peak - valley , in percentage : (peak - valley)/peak × 100
Profit Factor (higher = better) : Gross profit divided by gross loss, values under 1 represent gross losses superior to the gross profits
Remember that more volatility = more risk, since higher absolute price changes can logically cause larger losses.
EURUSD
The first market analyzed is the Forex market with the EURUSD major pair with a position sizing of 1000 units (1 micro lot). Since October EURUSD is not showing any particular strong trend but posses a discrete rising motion, fortunately cycles can be observed.
The equity was rising until two trades appeared causing a decline in the equity. Before October a bearish market could be observed.
We can see that the equity is rising, the trend still posses various retracements that affect our indicator, however we can see that the indicator totally nail the end of the trend, thats the power of converging toward the price.
In short :
$ 86.63 net profit
340 closed trades
37.65 % profitable (thats a lot of loosing trades)
1.19 profit factor
$ 76.67 max drawdown
Applying a spread would create negative results (in general the average spread is used), not a great start...
BTCUSD
The cryptocurrency market is relatively more volatile than others, which also mean potentially higher returns, we test the indicator using certainly the most traded cryptocurrency, BTCUSD. We will use a position sizing of 1 unit.
In the case of BTCUSD the strategy balance is relatively stationary around the initial capital, with of course high dispersion.
from september to december the market is bearish with various ranging periods, no apparent cycles can be observed, except maybe in the ranging period of october, this ranging period is followed by a non linear trend (relatively parabolic) that the indicator failed to capture in its integrity (this is a recurrent problem and it is starting to piss me off xD).
In short :
$ 2010.64 net profit (aka how i bet the crypto market)
395 closed trades
38.23 % profitable
1.036 profit factor
$ 5738.01 max drawdown (aka how i lost to the crypto market)
AMD
AMD stand for Advanced Micro Devices and is a company focused on the development of computer technology, i love the microprocessor market and i really like AMD who start this year in a pretty great way with a net bullish trend.
The performance of the indicator on AMD is decent (at last !) with the equity producing many new higher highs. The indicator performance still drop in the middle end of 2019 with a large equity drawdown of 17$ caused by the gap of august 8. Unfortunately AMD, like lot of well behaving stocks can only tells us that the indicator has good performances on heavily trending markets with no excess of noise or chaotic structures.
In short :
$ 17.86 net profit (Enough for a consistent lunch)
295 closed trades
36.27 % profitable
1.414 profit factor
$ 10.37 max drawdown.
Conclusion
A strategy using the recently proposed Grover Llorens activator has been presented. We can easily conclude that the indicator can't possibly generate long term returns under chaotic and volatile markets, and could even produce unnecessary trades in trending markets without much parasitic fluctuations such as noise and retracements (think about a simple linear trend) since the indicator converge toward the price and would therefore automatically cross over/under the trend, thus guaranteeing a false signal.
However we have seen its ability to provide accurate early reversal detection shine from time to time, thus over performing lagging indicators in this aspect, however the duration of price fluctuations isn't fixed at a certain period, the rate of convergence should be way faster during volatile fluctuations, of moderate speed during more cyclic fluctuations, and really slow with apparent long term trends, this could be achieved by making the indicator adaptive, but it won't really make it necessarily perform better.
That said i still believe that converging trend indicators are really interesting and aim to capture the non lasting behavior of price fluctuations, they shouldn't receive so much hate (think about the poor p-sar).
Thanks for reading !

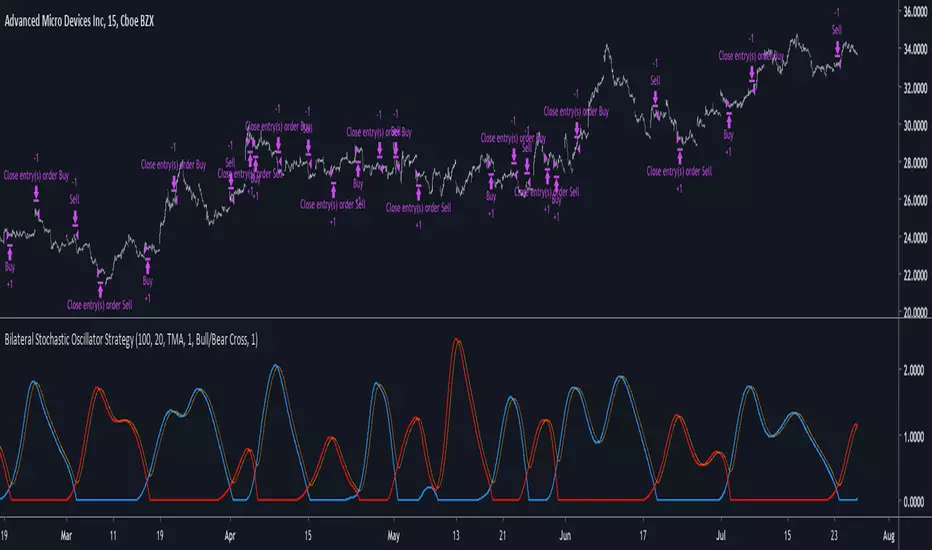
Bilateral Stochastic Oscillator StrategyIntroduction
Strategy based on the bilateral stochastic oscillator, this oscillator aim to detect trends and possible reversal points of the current trend. The oscillator is composed of 1 bull line in blue and 1 bear line in red as well as a signal line in orange, the strategy have many options such as two different strategy framework and a martingale mode. If you require more information about the indicator go check it into my uploaded indicators.
Strategy Frameworks
There are two frameworks available that can be selected from the strategy settings window. Both have the same closing conditions, the "Bull/Bear Cross" entry conditions are :
Buy : when the bull line cross over the bear line
Sell : when the bear line cross over the bull line
The "Signal Cross" entry conditions are :
Buy : when the bull line cross over the signal line
Sell : when the bear line cross over the signal line
Both have the same close conditions that is : close when bull/bear cross under the signal line.
Introduction To Martingale
The martingale money management system consist to double the order size after a loosing trade and can be described as a 2^x where x is the current number of loosing trades since the last win trade, when we win a trade the order size return to the default order size. Therefore our order size function is based on exponential growth.
This system enable the trader to win back his previous losses plus a potential profit, martingales must always be used with stops and sometimes take profits in order to get control in a strategy.
It must always be taken into account that in a series of losses the balance can exponentially decay thus ending to 0 in a matter of trades, this is why it is not recommended to use such system. The strategy allow you to select a martingale multiplier that can be inferior to 2 thus limiting risks, a multiplied of 1 disable the martingale.
Results
Those are the some statistics of the strategy applied to some forex majors by using the default settings in a time frames of 15 minutes.
//-------------------------------------------------------
EURUSD - Order Size 1000 - Spread 0.0002
Profit : $ 21.08
Trades : 19
PP : 57.89 %
Profit Factor : 3.228
Max Drawdown : -$ 3.81
Average Trade : $ 1.11
//-------------------------------------------------------
GBPUSD - Order Size 1000 - Spread 0.0002
Profit : $ 2.31
Trades : 20
PP : 55 %
Profit Factor : 0.938
Max Drawdown : -$ 20.29
Average Trade : $ 0.12
//-------------------------------------------------------
EURAUD - Order Size 1000 - Spread 0.0002
Profit : -$ 9.22
Trades : 20
PP : 40 %
Profit Factor : 0.698
Max Drawdown : -$ 23.44
Average Trade : $ 0.46
//-------------------------------------------------------
EURCHF - Order Size 1000 - Spread 0.0002
Profit : $ 1.58
Trades : 24
PP : 54.17 %
Profit Factor : 1.103
Max Drawdown : -$ 7.23
Average Trade : $ 0.07
//-------------------------------------------------------
Conclusions
Based on the results the strategy does not posses the sufficient performance in order to apply a martingale or any other growth systems as order size. Parameters might be subject to drastic changes depending on the market/time-frame in order to return long-term positive results. I let you draw your conclusions.
TMA Indicator v2.2This indicator is designed to show support and resistance at local extremes. Configurable SMA crossover events can be used to impart a bullish or bearish bias. This helps to reduce noise on the chart and increase profit factor. In other words, the indicator will only look for bullish breakouts if the fast moving average is above the slow moving average and vice-versa.
SMA Crossover events can be used to filter bullish or bearish resistance levels.
SMA Crossover events can be used to filter bullish or bearish breakout alerts.
Supports alerts for entries and exits based on breakouts of local extrema.
Alerts can be generated at every breakout or with SMA crossover filtering active.
Backtests would suggest that filtering with SMA crossovers often yields slightly lower profit but with a considerable improvement to profit factor.
Green/Red indicates long/short entry
Yellow/Orange indicates long/short exit
See here for an example backtest and visualization of active SMA signal filtering:
For paper trading only. Do not use on real markets. Never make investment decisions based on this indicator alone.

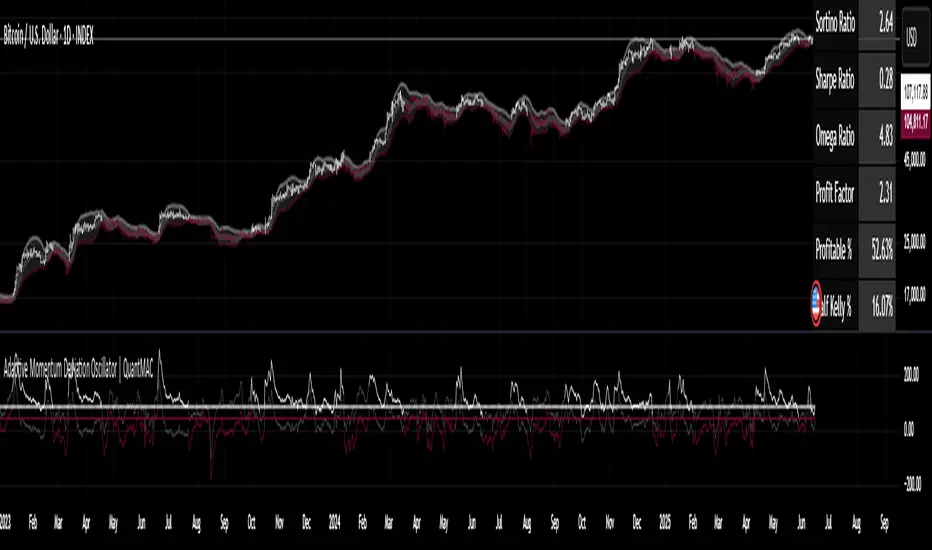
Adaptive Momentum Deviation Oscillator | QuantMACAdaptive Momentum Deviation Oscillator | QuantMAC 📊
Overview 🎯
The Adaptive Momentum Deviation Oscillator (AMDO) is an advanced technical analysis indicator that combines the power of Bollinger Bands with adaptive momentum calculations to identify optimal entry and exit points in financial markets. This sophisticated oscillator creates dynamic bands that adapt to market volatility while providing clear visual signals for both trending and ranging market conditions.
How It Works 🔧
Core Methodology
The AMDO employs a sophisticated multi-layered approach to market analysis through four distinct phases:
Bollinger Band Foundation : The indicator begins by establishing a volatility baseline using traditional Bollinger Bands. These bands are calculated using a simple moving average as the center line, with upper and lower bands positioned at a specific number of standard deviations away from this centerline. The distance between these bands expands and contracts based on market volatility, creating a dynamic envelope around price action.
BB% Normalization Process : The raw price data is then transformed into a normalized percentage format that represents where the current price sits within the Bollinger Band envelope. When price is at the lower band, this percentage reads 0%; at the upper band, it reads 100%. This normalization allows for consistent comparison across different timeframes and price levels, creating a standardized oscillator that oscillates between extreme values.
Adaptive Momentum Band Construction : The normalized BB% values undergo a secondary volatility analysis where their own standard deviation is calculated over a specified period. This creates "bands around the bands" - upper and lower boundaries that adapt to the volatility of the normalized price position itself. These adaptive bands expand during periods of high momentum volatility and contract during consolidation phases.
Intelligent Signal Synthesis : The final layer combines the adaptive momentum bands with user-defined threshold levels to create a sophisticated trigger system. The indicator monitors when the dynamic bands cross above or below these thresholds, filtering out noise while capturing significant momentum shifts. This creates a dual-confirmation system where both volatility adaptation and threshold breaches must align for signal generation.
Key Components 🛠️
Adaptive Momentum Bands 📈
Dynamic Volatility Response : These bands automatically widen during periods of high momentum volatility and narrow during consolidation phases. Unlike fixed oscillator boundaries, they continuously recalibrate based on recent price behavior within the Bollinger Band framework.
Dual-Layer Calculation : The bands are derived from the volatility of the normalized price position itself, creating a "volatility of volatility" measurement. This provides early warning signals when momentum characteristics are changing, even before price breakouts occur.
State-Aware Visualization : The bands employ intelligent color coding that transitions between active and neutral states based on their interaction with threshold levels. Active states indicate high-probability momentum conditions, while neutral states suggest consolidation or indecision.
Momentum Persistence Tracking : The bands maintain memory of recent momentum characteristics, allowing them to distinguish between genuine momentum shifts and temporary price spikes or dips.
Threshold Levels 🎚️
Statistical Significance Boundaries : The threshold levels (default 83 for long, 40 for short) are positioned to capture statistically significant momentum events while filtering out market noise. These levels represent points where momentum probability shifts meaningfully in favor of directional moves.
Asymmetric Design Philosophy : The intentional asymmetry between long and short thresholds (83 vs 40) reflects the natural upward bias of many financial markets and the different risk/reward profiles of long versus short positions.
Contextual Sensitivity : The thresholds work in conjunction with the adaptive bands to create context-sensitive triggers. A threshold breach is only meaningful when it occurs in the proper sequence with band interactions.
Risk-Adjusted Positioning : The threshold levels are calibrated to provide favorable risk-adjusted entry points, considering both the probability of success and the potential magnitude of subsequent moves.
Bollinger Bands Overlay 📊
Multi-Timeframe Context : The price chart overlay provides essential context by showing traditional Bollinger Bands alongside the oscillator. This dual perspective allows traders to see both the absolute price position and the momentum characteristics simultaneously.
Support/Resistance Identification : The filled band area creates a visual representation of dynamic support and resistance levels. Price interaction with these bands provides additional confirmation for oscillator signals.
Volatility Environment Assessment : The width and slope of the bands offer immediate visual feedback about the current volatility environment, helping traders adjust their expectations and risk management accordingly.
Confluence Analysis : The overlay enables traders to identify confluence between price action at Bollinger Band levels and oscillator signals, creating higher-probability trade setups.
Signal Generation ⚡
The AMDO generates signals through precise mathematical crossover events:
Long Signals 🟢
Momentum Accumulation Detection : Long signals are generated when the lower adaptive momentum band crosses above the 83 threshold, indicating that downside momentum has exhausted and bullish momentum is beginning to accumulate. This represents a shift from defensive to offensive market posture.
Statistical Edge Confirmation : The crossing event occurs only when momentum characteristics have shifted sufficiently to provide a statistical edge for long positions. The adaptive nature ensures the signal quality remains consistent across different market volatility regimes.
Visual State Synchronization : Upon signal generation, the entire indicator ecosystem shifts to a bullish state - bar colors change, band states update, and the visual hierarchy emphasizes the long bias until conditions change.
Momentum Persistence Validation : The signal incorporates momentum persistence analysis to distinguish between genuine trend starts and false breakouts, reducing whipsaw trades in choppy market conditions.
Short Signals 🔴
Momentum Exhaustion Recognition : Short signals trigger when the upper adaptive momentum band crosses below the 40 threshold, signaling that bullish momentum has peaked and bearish momentum is emerging. This asymmetric threshold reflects the different dynamics of bullish versus bearish market phases.
Volatility-Adjusted Timing : The adaptive band system ensures that short signals are generated with appropriate timing regardless of the underlying volatility environment, maintaining signal quality in both high and low volatility conditions.
Regime-Aware Activation : Short signals are only active in Long/Short trading mode, recognizing that not all trading strategies benefit from short positions. The indicator adapts its behavior based on the selected trading approach.
Risk-Calibrated Thresholds : The 40 threshold is specifically calibrated to capture meaningful bearish momentum shifts while accounting for the higher risk typically associated with short positions.
Cash Signals 💰
Defensive Positioning Logic : In Long/Cash mode, cash signals are generated when short conditions are met, allowing traders to move to a defensive cash position rather than taking on short exposure. This preserves capital during unfavorable market conditions.
Risk Mitigation Strategy : Cash signals represent a risk-off approach that removes market exposure when momentum conditions favor the short side, protecting long-biased portfolios from adverse market movements.
Opportunity Cost Optimization : The cash position allows traders to avoid negative returns while maintaining flexibility to re-enter long positions when momentum conditions improve, optimizing the risk-adjusted return profile.
Features & Customization ⚙️
Color Schemes 🎨
9 pre-built color schemes (Classic through Classic9)
Custom color override option
Dynamic color changes based on signal states
Trading Modes 📈
Long/Short : Full bidirectional trading capability
Long/Cash : Long-only strategy with cash positions
Performance Metrics 📊
The indicator includes a comprehensive suite of advanced performance analytics that provide deep insights into strategy effectiveness:
Risk-Adjusted Return Metrics
Sortino Ratio : Measures returns relative to downside deviation only, providing a more accurate assessment of risk-adjusted performance by focusing on harmful volatility rather than total volatility. This metric is particularly valuable for asymmetric return distributions.
Sharpe Ratio : Calculates excess return per unit of total risk, offering a standardized measure of risk-adjusted performance that allows for comparison across different strategies and timeframes.
Omega Ratio : Employs probability-weighted analysis to compare the likelihood and magnitude of gains versus losses, providing insights into the overall shape of the return distribution and tail risk characteristics.
Drawdown and Risk Analysis
Maximum Drawdown : Tracks the largest peak-to-trough equity decline, providing crucial information about the worst-case scenario and helping traders understand the emotional and financial stress they might encounter.
Dynamic Drawdown Monitoring : Continuously updates drawdown calculations in real-time, allowing traders to monitor current drawdown levels relative to historical maximums.
Trade Statistics and Profitability
Profit Factor Analysis : Compares gross profits to gross losses, revealing the efficiency of the trading approach and the relationship between winning and losing trades.
Win Rate Calculation : Provides the percentage of profitable trades, which must be interpreted in conjunction with profit factor and average trade size for meaningful analysis.
Trade Frequency Tracking : Monitors total trade count to assess strategy turnover and transaction cost implications.
Position Sizing Guidance
Half Kelly Percentage : Calculates optimal position sizing based on Kelly Criterion methodology, then applies a conservative 50% reduction to account for parameter uncertainty and reduce volatility. This provides mathematically-based position sizing guidance that balances growth with risk management.
Parameters & Settings 🔧
BMD Settings
- Base Length : Period for Bollinger Band calculation (default: 10)
- Source : Price data source (default: close)
- Standard Deviation Length : Period for volatility calculation (default: 35)
- SD Multiplier : Bollinger Band width multiplier (default: 1.0)
- BB% Multiplier : Scaling factor for BB% calculation (default: 100)
BMD Settings
Base Length : Period for Bollinger Band calculation (default: 10)
Source : Price data source (default: close)
Standard Deviation Length : Period for volatility calculation (default: 35)
SD Multiplier : Bollinger Band width multiplier (default: 1.0)
BB% Multiplier : Scaling factor for BB% calculation (default: 100)
Signal Thresholds 🎯
Long Threshold : Trigger level for long signals (default: 83)
Short Threshold : Trigger level for short signals (default: 40)
Display Options 🖥️
Toggleable metrics table with 6 position options
Customizable date range limiter
Multiple visual elements for comprehensive analysis
Use Cases & Applications 💡
Trend Following
Identifies momentum shifts in trending markets
Provides early entry signals during trend continuations
Adaptive bands adjust to changing volatility conditions
Mean Reversion
Detects oversold/overbought conditions
Signals potential reversal points
Works effectively in ranging markets
Risk Management
Built-in performance metrics for strategy evaluation
Half Kelly percentage for position sizing guidance
Maximum drawdown monitoring
Advantages ✅
Adaptive Nature : Automatically adjusts to market volatility
Dual Display : Oscillator and price chart components work together
Comprehensive Metrics : Built-in performance analysis
Flexible Trading Modes : Supports different trading strategies
Visual Clarity : Color-coded signals and states
Customizable : Extensive parameter adjustment options
Important Considerations ⚠️
This indicator is designed for educational and analysis purposes
Should be used in conjunction with other technical analysis tools
Proper risk management is essential when trading
Backtest thoroughly before implementing in live trading
Market conditions can change rapidly, affecting indicator performance
Disclaimer ⚠️
Past performance is not indicative of future results. Trading involves substantial risk of loss and is not suitable for all investors. The information provided by this indicator should not be considered as financial advice. Always conduct your own research.
No indicator guarantees profitable trades - Always use proper risk management! 🛡️
OptionHawk1. What makes the script original?
• Unique concept: It integrates a Keltner based custom supertrend with a multi-EMA energy visualization, ATR based multi target management, and on chart options (CALL/PUT) trade signals—creating a toolkit not found in typical public scripts.
• Innovative use: Instead of off the shelf indicators, it reinvents them:
• Keltner bands used as dynamic Supertrend triggers.
• Fifteen EMAs layered for “energy” zones (bullish/bearish heatmaps).
• ATR dynamically scales multi-TP levels and stop loss.
These are creatively fused into a unified signal and automation engine.
________________________________________
2. What value does it provide to traders?
• Clear entries & exits: Labels for entry price/time, five TP levels, and SL structure eliminate guesswork.
• Visualization & automation: Real-time bar coloring and energy overlays allow quick momentum reads.
• Targeted to common pain points: Many traders struggle with manual TP/SL and entry timing—this automates that process.
• Ready for real use: Just plug into intraday (e.g., 5 min) or swing setups; no manual calculations. Signals are actionable out of the box.
________________________________________
3. Why invite only (worth paying)?
• Proprietary fusion: Public indicators like Supertrend or EMA are common—but your layered use, ATR based scaling, and label logic are exclusive.
• Auto-generated options format: Unique labeling for CALL/PUT, with graphical on chart signals, isn’t offered freely elsewhere.
• Time-saver & edge-provider: Saves traders hours of configuration and enhances consistency—worth the subscription cost over piecing together mash ups.
________________________________________
4. How does it work?
• Signal backbone: Custom supertrend uses Keltner bands crossing with close for direction, filtered by trend direction EMAs.
• Multi time logic: Trend defined by crossover of price over dynamic SMA thresholds built from ATR.
• Energy bar-colors/EMAs: 15 fast EMAs color-coded green/red to instantly show momentum.
• Entry logic: “Bull” when close crosses above supertrend; “Bear” when crosses below.
• Risk management: SL set at previous bar; up to 5 ATR scaled targets (or percentage based).
• Options formatted alerts: CALL/PUT labels with ₹¬currency values, embedded timestamp, SL/TP all printed on the chart.
________________________________________
5. How should traders use it?
• Best markets & timeframes: Ideal for intraday / low timeframe (1 15m) setups and 1 hour swing trades in equities, indices, options.
• Conditions: Works best in trending or volatility driven sessions—visible via Keltner bands and EMA energy alignment.
• Recommended combo: Use alongside volume filters or broader cycles; when supertrend & energy EMAs align, validation is stronger.
________________________________________
6. Proof of effectiveness?
• On chart visuals: Entry/exit labels, confirmed labels, TP and SL markers make past hits obvious.
• Real trade examples: Highlighted both bull & bear setups with full profit realization or SL hits.
• Performance is paint tested: Easy to showcase historic signals across multiple tickers.
• Data-backed: Users can export chart data to calculate win rate and avg return per trade.
________________________________________
Summary Pitch:
OptionHawk offers a holistic, execution-ready trading tool:
1. Proprietary blend of Keltner-supertrend and layered EMAs—beyond standard scripts.
2. Automates entries, multi-tier targets, SL, and options-format labels.
3. Visual energy overlays for quick momentum readings.
4. Use-tested in intraday and swing markets.
5. Installs on chart and works immediately—no setup complexity.
It's not a public indicator package; it's a self-contained, plug and play trade catalyst—worth subscribing for active traders seeking clarity, speed, and structure in their decision-making.
6. While OptionHawk is designed for clarity and structure, no script can predict the market. Always use with discretion and proper risk management.
---------------------------------------------------------------------------------------------------------------------
OptionHawk: A Comprehensive Trend-Following & Volatility-Adaptive Trading System
The "OptionHawk" script is a sophisticated trading tool designed to provide clear, actionable signals for options trading by combining multiple technical indicators and custom logic. It aims to offer a holistic view of market conditions, identifying trend direction, momentum, and potential entry/exit points with dynamic stop-loss and take-profit levels.
________________________________________
1. Why These Specific Indicators and Code Elements?
The "OptionHawk" script is a strategic fusion of the Supertrend indicator (modified with Keltner Channels), a multi-EMA "Energy" ribbon, dynamic trend lines (based on SMA and ATR), a 100-period Trend Filter EMA, and comprehensive trade management logic (SL/TP). My reason and motivation for this mashup stem from a desire to create a robust system that accounts for various market aspects often overlooked by individual indicators:
• Supertrend with Keltner Channels: The standard Supertrend is effective for trend identification but can sometimes generate whipsaws in volatile or ranging markets. By integrating Keltner Channels into the Supertrend calculation, the volatility measure becomes more adaptive, using the (high - low) range within the Keltner Channel for its ATR-like component. This aims to create a more responsive yet less prone-to-false-signals Supertrend.
• Multi-EMA "Energy" Ribbon: This visually striking element, composed of 15 EMAs, provides a quick glance at short-to-medium term momentum and potential support/resistance zones. When these EMAs are stacked and moving in one direction, it indicates strong "energy" behind the trend, reinforcing the signals from other indicators.
• Dynamic Trend Lines (SMA + ATR): These lines offer a visual representation of support and resistance that adapts to market volatility. Unlike static trend lines, their ATR-based offset ensures they remain relevant across different market conditions and asset classes, providing context for price action relative to the underlying trend.
• 100-Period Trend Filter EMA: A longer-period EMA acts as a higher-timeframe trend filter. This is crucial for confirming the direction identified by the faster-acting Supertrend, helping to avoid trades against the prevailing broader trend.
• Comprehensive Trade Management Logic: The script integrates automated calculation and display of stop-loss (SL) and multiple take-profit (TP) levels, along with trade confirmation and "TP Hit" labels. This is critical for practical trading, providing immediate, calculated risk-reward parameters that individual indicators typically don't offer.
This combination is driven by the need for a multi-faceted approach to trading that goes beyond simple signal generation to include trend confirmation, volatility adaptation, and essential risk management.
________________________________________
2. What Problem or Need Does This Mashup Solve?
This mashup addresses several critical gaps that existing individual indicators often fail to fill:
• Reliable Trend Identification in Volatile Markets: While Supertrend is good, it can be late or whipsaw. Integrating Keltner Channels helps it adapt to changing volatility, providing more reliable trend signals.
• Confirmation of Signals: A common pitfall of relying on a single indicator is false signals. "OptionHawk" uses the multi-EMA "Energy" ribbon and the 100-period EMA to confirm the trend identified by the Keltner-Supertrend, reducing false entries.
• Dynamic Support/Resistance & Trend Context: Static support and resistance levels can quickly become irrelevant. The dynamic SMA + ATR trend lines provide continually adjusting zones that reflect the current market's true support and resistance, giving traders a better understanding of price action within the trend.
• Integrated Risk and Reward Management: Most indicators just give entry signals. This script goes a significant step further by automatically calculating and displaying clear stop-loss and up to five take-profit levels (either ATR-based or percentage-based). This is a vital component for structured trading, allowing traders to pre-define their risk and reward for each trade.
• Visual Clarity and Actionable Information: Instead of requiring traders to layer multiple indicators manually, "OptionHawk" integrates them into a single, cohesive display with intuitive bar coloring, shape plots, and informative labels. This reduces cognitive load and presents actionable information directly on the chart.
In essence, "OptionHawk" provides a more comprehensive, adaptive, and actionable trading framework than relying on isolated indicators.
________________________________________
3. How Do the Components Work Together?
The various components of "OptionHawk" interact in a synergistic and often sequential manner to generate signals and manage trades:
• Keltner-Supertrend as the Primary Signal Generator: The supertrend function, enhanced by keltner_channel, is the core of the system. It identifies potential trend reversals and continuation signals (bullish/bearish crosses of the supertrendLine). The sensitivity and factor inputs directly influence how closely the Supertrend follows price and its responsiveness to volatility.
• Multi-EMA "Energy" Ribbon for Momentum and Confirmation: The 15 EMAs (from ema1 to ema15) are plotted to provide a visual representation of short-term momentum. When the price is above these EMAs and they are spread out and pointing upwards, it suggests strong bullish "energy." Conversely, when price is below them and they are pointing downwards, it indicates bearish "energy." This ribbon serves as a simultaneous visual confirmation for the Supertrend signals; a buy signal from Supertrend is stronger if the EMA ribbon is also indicating upward momentum.
• Dynamic Trend Lines for Context and Confirmation: The sma_high and sma_low lines, incorporating ATR, act as dynamic support and resistance. The trend variable, determined by price crossing these lines, provides an overarching directional bias. This component works conditionally with the Supertrend; a bullish Supertrend signal is more potent if the price is also above the sma_high (indicating an uptrend).
• 100-Period Trend Filter EMA for Macro Trend Confirmation: The ema100 acts as a macro trend filter. Supertrend signals are typically considered valid if they align with the direction of the ema100. For example, a "BUY" signal from the Keltner-Supertrend is ideally taken only if the price is also above the ema100, signifying that the smaller trend aligns with the larger trend. This is a conditional filter.
• Trade Confirmation and SL/TP Logic (Sequential and Conditional):
• Once a bull or bear signal is generated by the Keltner-Supertrend, the tradeSignalCall or tradeSignalPut is set to true.
• A confirmation step then occurs for a "BUY" signal, the script checks if the close of the next bar is higher than the entry bar's close. For a "SELL" signal, it checks if the close of the next bar is lower. This is a sequential confirmation step aimed at filtering out weak signals.
• Upon a confirmed signal, the stop-loss (SL) is immediately set based on the previous bar's low (for calls) or high (for puts).
• Multiple take-profit (TP) levels are calculated and stored in arrays. These can be based on a fixed percentage or dynamic ATR multiples, based on user input.
• The TP HIT logic continuously monitors price action simultaneously against these pre-defined target levels, displaying labels when a target is reached. The SL HIT logic similarly monitors for a stop-loss breach.
In summary, the Supertrend generates the initial signal, which is then confirmed by the dynamic trend lines and the 100-period EMA, and visually reinforced by the EMA "Energy" ribbon. The trade management logic then takes over, calculating and displaying vital risk-reward parameters.
________________________________________
4. What is the Purpose of the Mashup Beyond Simply Merging Code?
The purpose of "OptionHawk" extends far beyond merely combining different indicator codes; it's about creating a structured and informed decision-making process for options trading. The key strategic insights and functionalities added by combining these elements are:
• Enhanced Signal Reliability and Reduced Noise: By requiring multiple indicators to align (e.g., Keltner-Supertrend signal confirmed by EMA trend filter and dynamic trend lines), the script aims to filter out false signals and whipsaws that commonly plague individual indicators. This leads to higher-probability trade setups.
• Adaptive Risk Management: The integration of ATR into both the Supertrend calculation and the dynamic stop-loss/take-profit levels makes the entire system adaptive to current market volatility. This means stop-losses and targets are not static but expand or contract with the market's price swings, promoting more realistic risk management.
• Clear Trade Entry and Exit Framework: The script provides a complete trading plan with each signal: a clear entry point, a precise stop-loss, and multiple cascading take-profit levels. This holistic approach empowers traders to manage their trades effectively from initiation to conclusion, rather than just identifying a potential entry.
• Visual Confirmation of Market Strength: The "Energy" ribbon and dynamic trend lines provide an immediate visual understanding of the market's momentum and underlying trend strength, helping traders gauge conviction behind a signal.
• Improved Backtesting and Analysis: By combining these elements into one script, traders can more easily backtest a comprehensive strategy rather than trying to manually combine signals from multiple overlaying indicators, leading to more accurate strategy analysis.
• Suitability for Options Trading: Options contracts are highly sensitive to price movement and volatility. This script's focus on confirmed trend identification, dynamic volatility adaptation, and precise risk management makes it particularly well-suited for the nuanced demands of options trading, where timing and defined risk are paramount.
________________________________________
5. What New Functionality or Insight Does Your Script Offer?
"OptionHawk" offers several new functionalities and insights that significantly enhance decision-making, improve accuracy, and provide clearer signals and better timing for traders:
• "Smart" Supertrend: By basing the Supertrend's volatility component on the Keltner Channel's range instead of a simple ATR, the Supertrend becomes more sensitive to price action within its typical bounds while still adapting to broader market volatility. This can lead to earlier and more relevant trend change signals.
• Multi-Confirmation System: The script doesn't just provide a signal; it layers multiple confirmations (Keltner-Supertrend, multi-EMA "Energy" coloration, dynamic trend lines, and the 100-period EMA). This multi-layered validation significantly improves the accuracy of signals by reducing the likelihood of false positives.
• Automated and Dynamic Risk-Reward Display: This is a major functionality enhancement. The automatic calculation and clear display of stop-loss and five distinct take-profit levels (based on either ATR or percentage) directly on the chart, along with "TP HIT" and "SL HIT" labels, streamline the trading process. Traders no longer need to manually calculate these crucial levels, leading to enhanced decision-making and better risk management.
• Visual Trend "Energy" and Momentum: The vibrant coloring of the multi-EMA ribbon based on price relative to the EMA provides an intuitive and immediate visual cue for market momentum and "energy." This offers an insight into the strength of the current move, which isn't available from single EMA plots.
• Post-Signal Confirmation: The "Confirmation" label appearing on the bar after a signal, if the price continues in the signaled direction, adds an extra layer of real-time validation. This helps to improve signal timing by waiting for initial follow-through.
• Streamlined Options Trading Planning: For options traders, having clear entry prices, stop-losses, and multiple target levels directly annotated on the chart is invaluable. It helps in quickly assessing potential premium movements and managing positions effectively.
In essence, "OptionHawk" transitions from a collection of indicators to a semi-automated trading assistant, providing a comprehensive, visually rich, and dynamically adaptive framework for making more informed and disciplined trading decisions.
----------------------------------------------------------------------------------------------------------------
Performance & Claims
1. What is the claimed performance of the script or strategy?
Answer: The script does not claim any specific performance metrics (e.g., win rate, profit factor, percentage gains). It's an indicator designed to identify potential buy/sell signals and target/stop-loss levels. The labels it generates ("BUY CALL," "BUY PUT," "TP HIT," "SL HIT") are informational based on its internal logic, not a representation of actual trading outcomes.
2. Is there any proof or backtesting to support this claim?
Answer: No, the provided code does not include any backtesting functionality or historical performance proof. As an indicator, it simply overlays visual signals on the chart. To obtain backtesting results, the logic would need to be implemented as a Pine Script strategy with entry/exit rules and commission/slippage considerations.
3. Are there any unrealistic or exaggerated performance expectations being made?
Answer: The script itself does not make any performance expectations. It avoids quantitative claims. However, if this script were presented to users with implied promises of profit based solely on the visual signals, that would be unrealistic.
4. Have you clearly stated the limitations of the performance data (e.g., “based on backtesting only”)?
Answer: There is no statement of performance data or its limitations because the script doesn't generate performance data.
5. Do you include a disclaimer that past results do not guarantee future performance?
Answer: No, the script does not include any disclaimers about past or future performance. This is typically found in accompanying documentation or marketing materials for a trading system, not within the indicator's code itself.
________________________________________
Evidence & Transparency
6. How are your performance results measured (e.g., profit factor, win rate, Sharpe ratio)?
Answer: Performance results are not measured by this script. It's an indicator.
7. Are these results reproducible by others using the same script and settings?
Answer: The visual signals and calculated levels (Supertrend line, EMAs, target/SL levels) generated by the script are reproducible on TradingView when applied to the same instrument, timeframe, and with the same input settings. However, the actual trading results (profit/loss) are not generated or reproducible by this indicator.
8. Do you include enough data (charts, equity curves, trade logs) to support your claims?
Answer: No, the script does not include or generate equity curves or trade logs. It provides visual labels on the chart, which can be seen as a form of "data" to support the signal generation, but not the performance claims (as none are made by the code).
________________________________________
Future Expectations
9. Are you making any predictions about future market performance?
Answer: No, the script does not make any explicit predictions about future market performance. Its signals are based on historical price action and indicator calculations.
10. Have you stated clearly that the future is fundamentally uncertain?
Answer: No, the script does not contain any statements about the uncertainty of the future.
11. Are forward-looking statements presented with caution and appropriate language?
Answer: The script does not contain any forward-looking statements beyond the visual signals it generates based on real-time data.
________________________________________
Risk & Disclosure
12. Have you disclosed the risks associated with using your script or strategy?
Answer: No, the script does not include any risk disclosures. This is typically found in external documentation.
13. Do you explain that trading involves potential loss as well as gain?
Answer: No, the script does not contain any explanation about the potential for loss in trading.
________________________________________
Honesty & Integrity
14. Have you avoided hype words like “guaranteed,” “foolproof,” or “no losses”?
Answer: Yes, the script itself avoids these hype words. The language used within the code is technical and describes the indicator's logic.
15. Is your language grounded and realistic rather than promotional?
Answer: Yes, the language within the provided Pine Script code is grounded and realistic as it pertains to the technical implementation of an indicator.
16. Are you leaving out any important details that might mislead users (e.g., selective performance snapshots)?
Answer: From the perspective of the code itself, no, it's not "leaving out" performance details because it's not designed to generate them. However, if this indicator were to be presented as a "strategy" that implies profitability without accompanying disclaimers, backtesting results, and risk disclosures, then that external presentation could be misleading. The script focuses on signal generation and visual representation.
⚠️ Disclaimer:
This indicator is for informational and educational purposes only. It does not guarantee any future results or performance. All trading involves risk. Please assess your own risk tolerance and consult a licensed financial advisor if needed. Past performance does not indicate future returns.

Gabriel's Price Action Strategy🧠 Gabriel's Price Action Strategy — Smart Signal Sequence with Dynamic Risk Control
Created by: OneWallStreetQuant
Strategy Type: Momentum-based Sequence Logic + Smart Volume & RSI Filters
Ideal For: Intraday scalping, swing trading, and momentum trend entries on stocks, forex, crypto, indices.
🚀 Overview
Gabriel's Price Action Strategy is a multi-layered, logic-driven trading system that combines:
✅ Candle Sequence Detection: Detects persistent bullish/bearish momentum using a smart configurable sequence of green/red candles.
✅ Structure Break Filtering: Prevents entries if recent price invalidates the momentum setup (e.g., a red candle breaks a bullish low).
✅ Custom Volume Engine: Integrates a hybrid tick-volume model using Negative/Positive Volume Index (NVI-PVI) to identify smart money flows.
✅ Advanced RSI Logic: Uses Jurik RSX for accurate oversold/overbought filtering.
✅ Optional MTF Trend Filter: Validates trend direction using a slope-based Jurik MA on higher timeframes.
✅ MPT-Based DMI Filter: Adds pyramid entries only during strong trend phases, based on Gain/Pain ratios and Ulcer-index smoothed ADX.
✅ Risk Management: ATR-based SL/TP and fully customizable trailing logic for both profit and stop-loss.
📈 Entry Logic
Trades are triggered only when:
A minimum number of recent candles are bullish/bearish (Min Green/Red Candles)
Structure has not been broken by opposite price action (optional)
Relative volume exceeds average (optional)
RSI is below overbought or above oversold (optional)
MTF slope is aligned with trend direction (optional)
💡 Key Features
Custom Candle Logic: Detects momentum shifts using a tunable lookback window (up to 50 bars).
Smart Volume Filtering: Volume is intelligently estimated using tick-based ranges and NVI-PVI deltas.
Risk Management Built-in: Set your ATR length, SL/TP multipliers, and dynamic trailing offsets with full control.
Scorecard System: A built-in scoring engine evaluates Win Rate, Drawdown, Sharpe Ratio, Recovery Factor, and Profit Factor — visualized on chart as a label.
Backtest-Friendly: Includes date range toggles, bar-magnifier support, and optimized execution on every tick.
📊 Strategy Scorecard (Label)
Automatically calculates:
✅ Total Trades
✅ Win Rate (%)
✅ Net Profit
✅ Profit Factor
✅ Expected Payoff
✅ Max & Avg Drawdown
✅ Recovery Factor
✅ Sharpe Ratio
✅ VaR (95%)
Plus, assigns a normalized score from 0 to 100 for evaluating overall robustness.
⚙️ Customization
Every module — from entry filters to pyramiding and trailing logic — is fully configurable:
Volume Filters ✅
RSI Filters ✅
Structure Break Checks ✅
HTF Jurik MA & Slope Threshold ✅
Multi-Timeframe Mode ✅
Backtest Score Visualization ✅
⚠️ Notes
Enable bar magnifier and calc on every tick for best accuracy.
On early bars, signal logic may delay until enough candles are available.
Best paired with assets showing directional volatility (SPY, BTC, ETH, Gold, etc.).
Ideally paired on trending timeframes such as M1, M5, M15, M30, 1HR, 4 Hourly, Daily, Weekly, Monthly, etc.
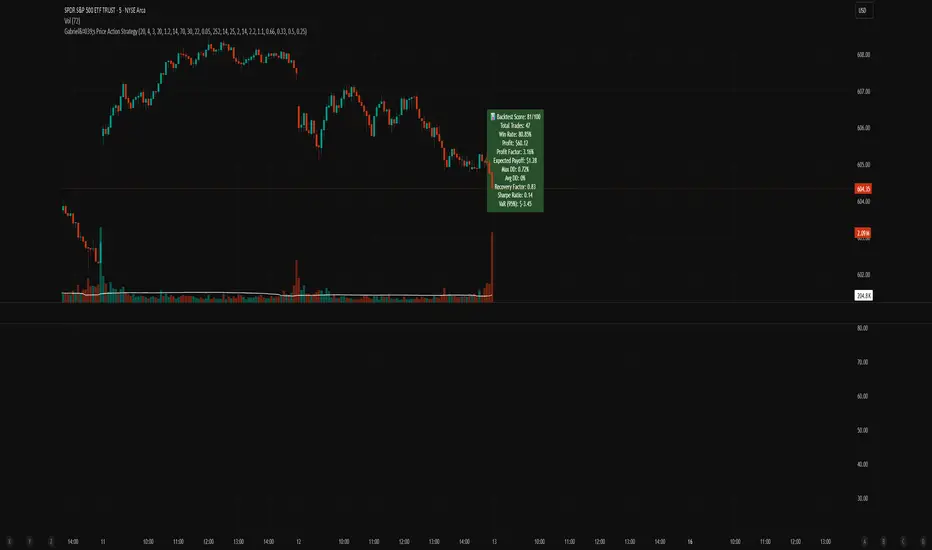
SEMA JMA | QuantEdgeB
📈 Introducing SEMA JMA by QuantEdgeB
🛠️ Overview
SEMA JMA is a precision-engineered, dual-signal trend indicator that blends Jurik Moving Average (JMA) logic with Double Exponential Moving Average (DEMA) smoothing and normalized statistical filters.
This advanced indicator is built for high-quality trend detection, reducing false signals by confirming momentum through both price-based SD bands and normalized JMA logic. The result is a powerful, noise-filtered tool ideal for directional trading in volatile and ranging environments.
SEMA JMA offers adaptive volatility bands, backtest-ready analytics, and dynamic signal labeling, making it a favorite for traders demanding speed, precision, and strategic clarity.
✨ Key Features
🔹 Hybrid JMA + DEMA Core
Combines the ultra-smooth JMA with lag-reducing DEMA for exceptional trend clarity.
🔹 Volatility-Based SD Band Filtering
Uses rolling standard deviation on JMA for adaptive long/short bands that respond to market dynamics.
🔹 Normalized Price Filter Confirmation
A second JMA stream is normalized against price and filtered via SD for added trend confirmation and false signal suppression.
🔹 Backtest Integration & Equity Curve Plotting
Built-in compatibility with QuantEdgeB/BacktestingIndV2, delivering historical metrics, equity visualization, and strategic evaluation.
🔹 Fully Customizable UI
Includes label toggles, signal overlays, visual themes, and backtest table position selection.
📊 How It Works
1️⃣ JMA-DEMA Hybrid Trend Engine
The foundation of SEMA JMA lies in a custom-built JMA engine, enhanced by a DEMA smoothing layer to:
• Minimize lag without losing trend integrity.
• Maintain responsiveness in noisy or low-volume environments.
• Create a central trend structure used by both raw price and normalized filters.
2️⃣ Standard Deviation Band Filtering
SEMA JMA applies a rolling SD filter over the JMA signal. This creates adaptive upper and lower bands:
• Long Signal = Price > Upper Band
• Short Signal = Price < Lower Band
These bands adjust based on price volatility, offering a dynamic alternative to traditional fixed thresholds.
3️⃣ Normalized JMA for Momentum Confirmation
A second JMA-DEMA structure is normalized by dividing by price, then smoothed:
• If the normalized signal rises above -1, it suggests upside pressure.
• If it drops below -1, it signals momentum decay.
Only when both raw and normalized signals agree does the indicator issue a trade trigger.
✅ Signal Logic
📌 Long Signal →
🔹 Price breaks above volatility-adjusted upper SD band
🔹 AND Normalized JMA rises above -1
📌 Short Signal →
🔹 Price breaks below lower SD band
🔹 AND Normalized JMA falls below -1
⚙️ SEMA JMA stays in its active trend state until an opposing signal triggers, enabling tren riding while filtering short lived swings.
👥 Who Should Use It?
✅ Swing & Trend Traders → Ride strong directional moves with reduced whipsaws
✅ Volatility-Adaptive Systems → Filter trades using rolling SD-based thresholds
✅ Quantitative Strategy Builders → Deploy within algo-driven strategies using backtest-ready metrics
✅ Risk-Aware Traders → Use dual confirmation to minimize signal risk
⚙️ Customization & Default Settings
🔧 Core Settings:
• JMA Length (Default: 35) → Defines JMA sensitivity.
• DEMA Length (Default: 20) → Smoothing after JMA to refine structure.
• Normalized JMA Lengths → Control confirmation layer smoothness (default: 1 for short and long).
• Standard Deviation Length (Default: 30) → Determines the volatility lookback.
• SD Weight Factors → Separate values for long (default: 1.0) and short (default: 1.002) bands.
📊 Backtest Mode
SEMA JMA includes an optional backtest table, enabling traders to assess its historical effectiveness before applying it in live trading conditions.
🔹 Backtest Metrics Displayed:
• Equity Max Drawdown → Largest historical loss from peak equity.
• Profit Factor → Ratio of total profits to total losses, measuring system efficiency.
• Sharpe Ratio → Assesses risk-adjusted return performance.
• Sortino Ratio → Focuses on downside risk-adjusted returns.
• Omega Ratio → Evaluates return consistency & performance asymmetry.
• Half Kelly → Optimal position sizing based on risk/reward analysis.
• Total Trades & Win Rate → Assess historical success rate.
📌 Disclaimer:
Backtest results are based on past performance and do not guarantee future success. Always incorporate real-time validation and risk management in live trading.
🚀 Why This Matters?
✅ Strategy Validation → Gain insight into historical trend accuracy.
✅ Customization Insights → See how different settings impact performance.
✅ Risk Awareness → Understand potential drawdowns before deploying capital.
📌 How to Use SEMA JMA
🌀 Trend-Following Strategy
✔ Go Long: When price breaks above SD band and normalized momentum rises
✔ Go Short: When price breaks below SD band and normalized momentum falls
✔ Stay in position: Until signal reversal confirms
⚙️ Volatility-Adaptive Configuration
✔ Tune w1 (Long SD weight) and w2 (Short SD weight) for responsiveness
✔ Increase SD length in noisy markets for smoother bands
📌 Conclusion
SEMA JMA by QuantEdgeB delivers surgical precision trend signals using a dual-layer approach:
• JMA + DEMA core smoothing
• Statistical SD breakout filters
• Normalized confirmation logic
It’s a versatile indicator suited for trend-following, volatility tracking, and system-based signal generation—engineered for clarity, confidence, and adaptability.
🔹 Key Takeaways:
1️⃣ Multi-Filter Trend Logic – JMA + DEMA + Normalized filtering for high-confidence signals
2️⃣ SD-Based Volatility Control – Reduces noise, avoids ATR limitations
3️⃣ Quant-Ready System – Includes full backtesting
📌 Master your market edge with precision – SEMA JMA | QuantEdgeB
🔹 Disclaimer: Past performance is not indicative of future results.
🔹 Strategic Advice: Always backtest, optimize, and align parameters with your trading objectives and risk tolerance before live trading.
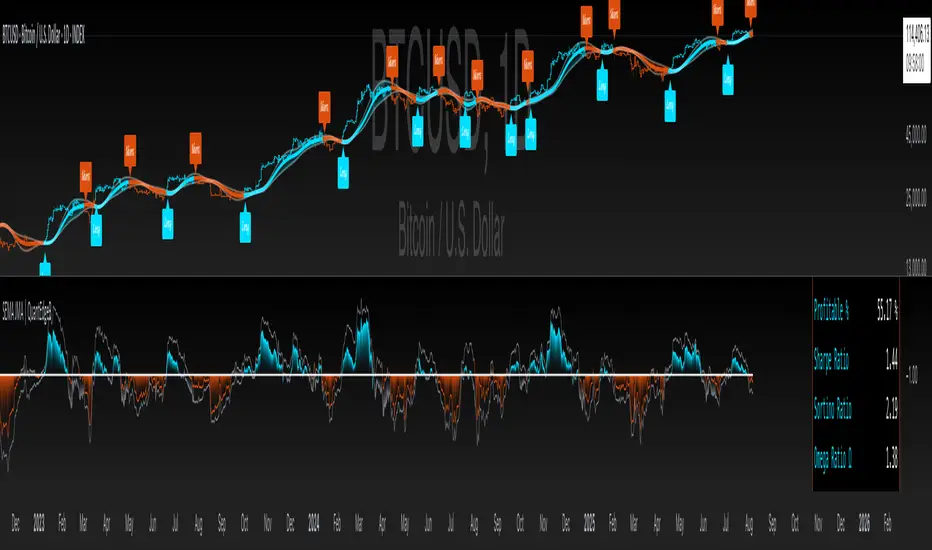
Mxwll OptAlgoIntroducing the Mxwll OptAlgo
Mxwll OptAlgo is a sophisticated algorithmic trading tool designed to identify potential long and short signals. It leverages an optimized combination of the M-Swift average, M-Smooth average, and M-RSI to fine-tune custom lengths and improve signal accuracy. The Mxwll OptAlgo provides long and short signals across various trading assets and timeframes. Additionally, it features optimized Take Profit (TP) and Stop Loss (SL) settings to help traders manage risk.
Key Features
Step-by-Step Complete Optimization: A systematic approach to optimize trading parameters.
Buy/Sell Signals: Clear indicators for long and short positions.
Easy to Use: User-friendly interface for seamless trading.
Predictive counter trend channels
Integrated trend following system and counter trend trading system
3-optimized strategies working cooperatively
Alerts and auto trading capabilities
How It Works
The Mxwll OptAlgo is comprised of three strategies:
Trend following using the OptAlgo
AI Reversal counter trend trading
Market crash shorting
Mxwll OptAlgo can be used for market analysis and trading similarly to any moving average.
The Mxwll OptAlgo MA is composed of two distinct moving averages to be used for trend following strategies.
M-Swift Average: The M-Swift Average accounts for volume and weights current price movement heavier than older price movement - allowing for improved responsiveness to current price movement. Volume is additionally weighted to the average to determine the significance of the price move and the resulting response of the M-Swift average. The M-Swift average consists of an HVWMA with OBV weighting. The HVWMA is used to create a moving average that adapts to volume, attempting to respond to significant price moves with high volume quicker and significant price moves with low volume slower - which might not be indicative of the start of a strong trend. To further reduce the M-Swift average’s responsiveness to weak volume price moves, the average is weighted with a normalized OBV. With this, the M-Swift moving average uses these two indicators to create a responsive moving average to significant price moves with high volume.
M-Smooth Average: The M-Smooth average consists of a McGinley average.
The McGinley Average is designed to address some of the limitations of traditional moving averages, such as the Simple Moving Average (SMA) or Exponential Moving Average (EMA), by reducing their lag and more accurately reflecting the market's true movements, especially during periods of volatility.
The McGinley Dynamic automatically adjusts its smoothing factor based on market speed. This means it responds more quickly to fast-moving markets and slows down during periods of consolidation, reducing the likelihood of false signals.
Unlike traditional moving averages that have a fixed period and can lag significantly behind fast-moving prices, the McGinley Dynamic adjusts dynamically, which helps to reduce lag and keeps the moving average closer to the price action.
The M-Smooth average uses bar low prices as a series during an uptrend - bar high prices as a series during a downtrend. A cross above the M-Smooth average indicates an uptrend, while a cross below the M-Smooth average indicates a downtrend. When this cross event occurs the M-Smooth average will “flip” from calculating on lows to highs, or highs to lows, contingent on the direction of the trend. The expectation is that a cross event of the M-Smooth average requires a substantial price move and, subsequent to this cross, price will continue to trend in the direction of the cross.
OptAlgo: The OptAlgo is simply the average of the M-Swift average and the M-smooth average.
By combining the M-Swift average and the M-Smooth average, the final output results in an average that slows during ranging markets and quickly adjusts to high volume breakouts and high volume reversals that initiate a trend. Due to the combination, the average will keep up quickly with a trend but remain at an appropriate distance from the current price - requiring a significant counter trend price move to change the direction of the OptAlgo average.
How does the OptAlgo follow trends?
The OptAlgo, comprising the two moving averages above, considers a cross event of the OptAlgo as a change in trend indication. The OptAlgo can be thought of as a moving average that significantly deviates from price. For price to cross the OptAlgo, a substantial price move must occur, and this event is treated as a "strong trend" or "new trend" indication.
M-RSI: The M-RSI is a fundamental component of the trend following strategy. Prior to a trend following “long” or “short” signal, the M-RSI must generate a signal in confluence with an OptAlgo cross event. When price crosses over the opt algo its color will change to green, indicating an uptrend. A buy signal will generate should the M-RSI provide a similar indication. The M-RSI portion of the trend following strategy is explained below. When price crosses under the opt algo its color will change to green, indicating a downtrend, and a sell signal becomes eligible. The foundational logic for using the Opt Algo as a trend following strategy is to treat crossovers/crossunders of the Opt Algo as strong trend indications, and trade them.
Steps to generate a trend following long signal:
1: M-RSI extends into oversold territory
2: Price crosses over the OptAlgo
Steps to generate a trend following short signal:
1: M-RSI extends into overbought territory
2: Price crosses under the OptAlgo
Our trend following strategy considers crossovers/crossunders at key market turning points as buy/sell opportunities. This strategy integrates the Mxwll RSI and Mxwll OptAlgo MA to determine entry points in anticipation of trend continuation.
The Mxwll RSI must move below/above the optimized OB/OS level prior to a cross event for a long/short signal to be considered. Entry points for this strategy are marked as "Long" or "Short".
At its core, the OptAlgo trend following strategy tries to enter a trend as close to the origin point as possible. As with any trend following strategy, price may not continue to move in the expected direction following entry, resulting in a losing trade.
AI Reversal Predictions
Our AI reversals strategy uses AI suggested turning points to capitalize on price reversions back towards the OptAlgo. These levels are considered by the AI on the selected days, and entry points at these levels are marked as "LLO" or "SLO".
How AI reversals work
Our AI reversals strategy attempts to trade price reversions back toward the Opt Algo.
These levels are calculated on specific days of the week, but can be traded any day. The internal algorithm determines which HTF highs/lows are most likely to function as tradable support/resistance levels. For instance, if Friday consists of heavy trading activity and high/low prices are tracked/recorded as causing significant support / resistance when tested in the future, the algorithm will consider support and resistance levels created on Friday as future tradable levels.
Additionally, if support/resistance levels created on Wednesday are recorded as weak or unpredictable when traded at in the future, the algorithm will not consider support/resistance levels generated on Thursday as tradable, and will not generate long or shit signals for these levels.
In the background, the AI reversals strategy is tracking success rates at multiple support and resistance levels. The best performers, if there are any, will be considered tradable. A “best performer” is calculated as the raw price move up to a threshold (i.e. 0.5%) that occurs subsequent to a test of the level.
Crash Short
The "Crash Short" strategy prioritizes short positions during retracements of a sell off. A simple yet effective strategy.
How Crash Short Works
The Crash Short strategy uses a customized momentum indicator (similar to ROC, MOM, etc.) to identify strong downside price moves. When our customized momentum indicator gives strong sell indications, the RSI is then referenced to identify an upside retracement. When the RSI exceeds a user-inputted level, a “Crash Short” signal is generated.
What is the customized momentum indicator?
The customized momentum indicator is the RoCR (Rate of Change Ratio). Instead of classic ROC, which is close - close , the RoCR divides the current close by a previous close. This formula creates a ratio that is more normalized than a simple price difference. This ratio is used to determine upside/downside momentum, with values greater than 1 indicating bullish momentum and values less than 1 indicating bearish momentum. The RoCR looks for deviating values to the downside (less than 1) to identify strong selling. From there, once the RSI crosses over an optimized level (such as 35), the indicator will print a sell signal titled "Crash Short".
Predictive Countertrend Channels
Our Predictive Countertrend Channel applies a two-stage recursive filter to smooth data using exponential decay and periodic adjustments for trend extraction. Our counter trend channels aren't directly used for signal processing; however, these channels provide useful visual cues for extended market moves.
Instructions for Optimization
Step 1: Optimize Mxwll OptAlgo
Begin by optimizing the M-Swift and M-Smooth averages for better signal accuracy.
This step simply finds better performing M-Swift and M-Smooth lookbacks. Again, if the strategy is unprofitable you will be notified and from there decide not to use the strategy.
Step 2: Optimize Mxwll RSI
Refine the Mxwll RSI settings to explore potential adjustments in smoothness and signal output. This step aims to evaluate whether these adjustments could improve the accuracy of the signals generated by Mxwll OptAlgo, while being mindful of any potential impacts.
Step 3: Optimize TP/SL
Consider adjusting the Take Profit and Stop Loss settings to potentially manage risk.
Step 4: Optimize Bars Between Trades
Set the number of bars between trades to regulate the frequency of trade executions. This adjustment may help in reducing the risk of overtrading and support a more disciplined trading strategy.
Step 5: Optimize Trade Flip
Adjust the trade flip parameters to potentially improve the management of transitions between long and short positions. This adjustment is intended to help achieve smoother trade executions, though outcomes may vary.
Step 6: Optimize RSI OB/OB Levels
Consider adjusting the overbought (OB) and oversold (OS) RSI levels to explore potential improvements in signal sensitivity. Careful calibration of these levels may help refine the accuracy of trend reversal signals, although results may depend on market conditions.
Finished!
From this point, consider setting alerts to make the most of the Mxwll Opt Algo's potential accuracy.
The effectiveness of the Opt Algo signal output can be evaluated using the "PF" table, which indicates the profit factor score for the strategy. A profit factor (PF) of less than or equal to 1 suggests that the strategy may not be profitable.
Disclaimer
No strategy works on any timeframe on any asset, so, if the Opt Algo underperforms for the asset/timeframe you're analyzing, the Opt Algo PF table lets you know it hasn't been generating accurate signals, in which case you can decide not to use it!
Optimization Disclaimer
Optimization can be tricky. It's helpful to test numerous strategies in aggregate to see if a strategy has potential. Despite this, optimization can cause overfitting. Overfitting occurs when a strategy is too closely fit to the data it's trading. Overfit backtests are deceptively phenomenal. While the historical performance looks great, the future expectancy of the strategy remains unpredictable - an overfit strategy will profit from periods of random price movement which, being random, are irreproducible and cannot be profited from other than their initial occurrence. When a strategy trades random price movement profitably, any and all profit earned can be reduced to chance. Keep this in mind when using the in-built optimization system. Optimization should be kept to a minimum, a tool to point you in the right direction, whether confirming potential or signifying a useless system.

FFT Strategy Bi-Directional Stop/Profit/Trailing + VMA + AroonThis strategy uses the Fast Fourier Transform inspired from the source code of @tbiktag for the Fast Fourier Transform & @lazybear for the VMA filter.
If you are not familiar with the Fast Fourier transform it is a variation of the Discrete Fourier Transform. Veritasium on youtube has a great video on it with a follow up recommendation from 3brown1blue. In short it will extract all the frequencies from a set of data. @tbiktag laid the groundwork for creating the indicator which will allow you to isolate only those signals which are the most relevant and remove the noise. I recommend having @tbiktag's FFT Transform indicator side by side with this to understand what my variation is doing by setting similar settings .
Using this idea, you can then optimize a strategy to the frequencies that are best. The main entry signal is when the FFT Signal crosses above or below the 0 line .
Included with this strategy is the ability to optionally bi-directionally set:
Stop Loss
Trailing Stop Loss
Take Profit
Trailing Take Profit
Entries are optionally further filtered by use of the VMA using the algorithm from LazyBear which allows you to adjust a variable moving average with 3 market trend detections. Green represents upwards momentum; Blue sideways trading and Red downwards momentum. The idea being to filter out buy or sell entries unless the market is moving in that direction, and this makes a big difference as you can see for yourself when you turn it off or on. Turning it off will change the color of the FFT signal to orange instead of the green, blue, red colors .
I have added 2 custom stop loss types as well for experimentation:
1. VMA Filter stop loss to exit the trade if the VMA detects a market trend direction change matching the rules you have set. I have set this to off by default, but it is there so you can see what affect it may have on other tickers. It can increase the profit factor but usually at a cost of net profit.
2. The Aroon Filter stop loss with different lengths for the short or long direction. For the Aroon strategy (which is a trend change detector) it is considered bullish if the upper line (green in my code) is above 70 and the lower line (red in my code) is below 30 and the opposite for the bearish case. With this in mind, I have set it to filter by default only the extreme ends (99 and 1) to increase profit factor and net profit but I encourage you to try different settings and see how it affects things. Turning this off yields much higher net profit but at the cost of the profit factor and drawdown . To disable this just uncheck the 'Use Aroon Filter Long' (or short) and it will also hide the aroon graphics and crosses on the plot.
I will be adding more features in an attempt to lower the drawdown on this strategy but I hope you enjoy what I have so far!

Smoothed Heikin Ashi Trend on Chart - TraderHalai BACKTESTSmoothed Heikin Ashi Trend on chart - Backtest
This is a backtest of the Smoothed Heikin Ashi Trend indicator, which computes the reverse candle close price required to flip a Heikin Ashi trend from red to green and vice versa. The original indicator can be found in the scripts section of my profile.
This particular back test uses this indicator with a Trend following paradigm with a percentage-based stop loss.
Note, that backtesting performance is not always indicative of future performance, but it does provide some basis for further development and walk-forward / live testing.
Testing was performed on Bitcoin , as this is a primary target market for me to use this kind of strategy.
Sample Backtesting results as of 10th June 2022:
Backtesting parameters:
Position size: 10% of equity
Long stop: 1% below entry
Short stop: 1% above entry
Repainting: Off
Smoothing: SMA
Period: 10
8 Hour:
Number of Trades: 1046
Gross Return: 249.27 %
CAGR Return: 14.04 %
Max Drawdown: 7.9 %
Win percentage: 28.01 %
Profit Factor (Expectancy): 2.019
Average Loss: 0.33 %
Average Win: 1.69 %
Average Time for Loss: 1 day
Average Time for Win: 5.33 days
1 Day:
Number of Trades: 429
Gross Return: 458.4 %
CAGR Return: 15.76 %
Max Drawdown: 6.37 %
Profit Factor (Expectancy): 2.804
Average Loss: 0.8 %
Average Win: 7.2 %
Average Time for Loss: 3 days
Average Time for Win: 16 days
5 Day:
Number of Trades: 69
Gross Return: 1614.9 %
CAGR Return: 26.7 %
Max Drawdown: 5.7 %
Profit Factor (Expectancy): 10.451
Average Loss: 3.64 %
Average Win: 81.17 %
Average Time for Loss: 15 days
Average Time for Win: 85 days
Analysis:
The strategy is typical amongst trend following strategies with a less regular win rate, but where profits are more significant than losses. Most of the losses are in sideways, low volatility markets. This strategy performs better on higher timeframes, where it shows a positive expectancy of the strategy.
The average win was positively impacted by Bitcoin’s earlier smaller market cap, as the percentage wins earlier were higher.
Overall the strategy shows potential for further development and may be suitable for walk-forward testing and out of sample analysis to be considered for a demo trading account.
Note in an actual trading setup, you may wish to use this with volatility filters, combined with support resistance zones for a better setup.
As always, this post/indicator/strategy is not financial advice, and please do your due diligence before trading this live.
Original indicator links:
On chart version -
Oscillator version -
Update - 27/06/2022
Unfortunately, It appears that the original script had been taken down due to auto-moderation because of concerns with no slippage / commission. I have since adjusted the backtest, and re-uploaded to include the following to address these concerns, and show that I am genuinely trying to give back to the community and not mislead anyone:
1) Include commission of 0.1% - to match Binance's maker fees prior to moving to a fee-less model.
2) Include slippage of 10 ticks (This is a realistic slippage figure from searching online for most crypto exchanges)
3) Adjust account balance to 10,000 - since most of us are not millionaires.
The rest of the backtesting parameters are comparable to previous results:
Backtesting parameters:
Initial capital: 10000 dollars
Position size: 10% of equity
Long stop: 2% below entry
Short stop: 2% above entry
Repainting: Off
Smoothing: SMA
Period: 10
Slippage: 10 ticks
Commission: 0.1%
This script still remains to shows viability / profitablity on higher term timeframes (with slightly higher drawdown), and I have included the backtest report below to document my findings:
8 Hour:
Number of Trades: 1082
Gross Return: 233.02%
CAGR Return: 14.04 %
Max Drawdown: 7.9 %
Win percentage: 25.6%
Profit Factor (Expectancy): 1.627
Average Loss: 0.46 %
Average Win: 2.18 %
Average Time for Loss: 1.33 day
Average Time for Win: 7.33 days
Once again, please do your own research and due dillegence before trading this live. This post is for education and information purposes only, and should not be taken as financial advice.

Best Strategy on TradingView? (Maybe)Best is quite a broad adjective and can be interpreted in many ways.
Does this strategy produce the best net profit on everything it trades compared to every other strategy? Probably not.
Does this strategy have the highest profit factor compared to every other strategy? Probably not.
However, in terms of all in one packages that are easy to implement and understand, while providing great results on most assets on most time frames... Is this the best strategy on TradingView? Maybe!
This strategy provides enough flexibility to be completely customised to each users trading needs, while being based on strategy logic that is so broad, so time tested and not overfitted - that it can be used by everyone on anything.
The strategy is fairly simple, MA ribbons, and the ATR. Seriously that's pretty much it. For momentum and trend based trading what more do you need! I've tried adding multitudes of other indicators, fundamental factors, technical tools etc. But after all that, this simple combo provides the best and most rounded results across the board.
I've tried to make the UI simple and intuitive so all users can load up and go and feel like they understand everything that is happening - but if anyone has any questions please do not hesitate to ask!
Also, if you find some great settings on something, share your results in the comments!
Have any ideas how this can be improved? Again, just let me know!
I hope you enjoy and I hope this helps with your trading & investing.

STRATEGY TESTER ENGINE - ON CHART DISPLAY - PLUG & PLAYSo i had this idea while ago when @alexgrover published a script and dropped a nugget in between which replicates the result of strategy tester on chart as an indicator.
So it seemed fair to use one of his strategy to display the results.
This strategy tester can now be used in replay mode like an indicator and you can see what happen at a particular section of the chart which was is not possible in default strategy tester results of TV.
Please read how each result is calculated so you will know what you are using.
This engine shows most common results of strategy tester in a single screen, which are as follows:
1. Starting Capital
2. Current Profit Percentage
3. Max Profit Percentage
4. Gross Profit
5. Gross Loss
6. Total Closed Trades
7. Total Trades Won
8. Total Trades Lost
9. Percentage Profitable
10. Profit Factor
11. Current Drawdown
12. Max Drawdown
13. Liquidation
So elaborating on what is what:
1. Starting Capital - This stays 0, which signifies your starting balance as 0%. It is set to 0 so we can compare all other results without any change in variables. If set to 100, then all the results will be increased by 100. Some users might find it useful to set it to 100, then they can change code on line 41 from to and it should show starting balance as 100%.
2. Current Profit Percentage - This shows your current profit adjusted to current price of the candle, not like TV which shows after candle is close. There is a comment on the line 38 which can be removed and your can see unrealized profit as well in this section. Please note that this will affect Draw-down calculations later in this section.
3. Max Profit Percentage - This will show you your max profit achieved during your strategy run, which was not possible yet to see via strategy tester. So, now you can see how much profit was achieved by your strategy during the run and you can compare it with chart to see what happens during bull-run or bear-run, so you can further optimize your strategy to best suit your desired results.
4. Gross Profit - This is total percentage of profit your strategy achieved during entire run as if you never had any losses.
5. Gross Loss - This is total percentage of loss your strategy achieved during entire run as if you never had any profits.
6. Total Closed Trades - This is total number of trades that your strategy has executed so far.
7. Total Trades Won - This is the total number of trades that your strategy has executed that resulted in positive increase in equity.
8. Totals Trades Lost - This is the total number of trades that your strategy has executed that resulted in decrease in equity.
9. Percentage Profitable - This is the ratio between your current total winning trades divided by total closed trades, and finally multiplied by 100 to get percentage results.
10. Profit Factor - This is the ratio between Gross Profit and Gross Loss, so if profit factor is 2, then it indicates that you are set to gain 2 times per your risk per trade on average when total trades are executed.
11. Current Drawdown - This is important section and i want you to read this carefully. Here draw-down is calculated very differently than what TV shows. TV has access to candle data and calculates draw-down accordingly as per number of trades closed, but here DD is calculated as difference between max profit achieved and current profit. This way you can see how much percentage you are down from max peak of equity at current point in time. You can do back-test of the data and see when peak was achieved and how much your strategy did a draw-down candle by candle.
12. Max Drawdown - This is also calculated differently same as above, current draw-down. Here you can see how much max DD your strategy did from a peak profit of equity. This is not set as max profit percentage is set because you will see single number on display, while idea is to keep it custom. I will explain.
So lets say, your max DD on TV is 30%. Here this is of no use to see Max DD , as some people might want to see what was there max DD 1000 candles back or 10 candle back. So this will show you your max DD from the data you select. TV shows 25000 candle data in a chart if you go back, you can set the counter to 24999 and it will show you max DD as shown on TV, but if you want custom section to show max DD , it is now possible which was not possible before.
Also, now let's say you put DD as 24999 and open a chart of an asset that was listed 1 week ago, now on 1H chart max DD will never show up until you reach 24999 candle in data history, but with this you can now enter a manual number and see the data.
13. Liquidation - This is an interesting feature, so now when your equity balance is less than 0 and your draw-down goes to -100, it will show you where and at what point in time you got liquidated by adding a red background color in the entire section. This is the most fun part of this script, while you can only see max DD on TV.
------------------------------------------------------------------------------
How to Use -
1 word, plug and play. Yes. Actual codes start from line 33.
select overlay=false or remove it from the title in your strategy on first line,
Just copy the codes from line 33 to 103,
then go to end section of your strategy and paste the entire code from line 33 to line 103,
see if you have any duplicate variable, edit it,
Add to chart.
What you see above is very contracted view. Here is how it looks when zoomed in.
imgur.com
----------------------------------------------------------------------------------
Feel free to edit and share and use. If you use it in your scripts, drop me tag. Cheers.

Amrullah Deep Liquidity for S&P 500Amrullah Deep Liquidity (ADL)
Amrullah Deep Liquidity (ADL) is a high profit factor strategy based on models designed by Muhd Amrullah.
Choosing your trading pair that you are planning to backtest
Check that you have been given access to Amrullah Deep Liquidity (ADL). Select SPX500USD with the default 4H time frame. Once done, open Indicators > Invite-Only Scripts > Amrullah Deep Liquidity %.
Choosing your initial capital that you want to begin backtesting
Go to Settings > Properties > Initial Capital and type in the amount of capital you're starting with. For the SPX500USD trading pair, the initial capital is denominated in USD.
Adjusting your equity at risk until the trades match your risk profile and comfort level
Go to Inputs > Equity Risk and adjust the value you are comfortable with. To analyse performance, you also want to choose the Start Year, Start Month and Start Date. Select lower equity risk for trades that you intend to take without the use of leverage. You can select an equity risk from 0.001 to 0.05 or all the way to 1.
Finding the time frame with the highest profit factor
Profit factor is defined as the gross profit a strategy makes across a defined period of time divided by its gross loss. You may choose to scroll through other time frames to find better models. You can select a different time frame from 1 min to 1H or all the way to 1M. Once you find the model you desire, you are encouraged to check that the model has a backtested profit factor of >3.5. You can then begin looking through the Performance Summary to find other detailed statistics.
Analysing the equity curve from the Amrullah Deep Liquidity (ADL) strategy
A green equity curve indicates that the trades are accumulating profits. A red equity curve indicates that the trades are accumulating losses. A healthy equity curve is one that is green and grows steadily to the right and upward direction.
Analysing the display arrows on the chart
Amrullah Deep Liquidity (ADL) tells you when to take a trade and how much to put in a trade. ADL can do this as the model identifies inventory risk in traders and market makers in the chosen market. On your Tradingview chart, ADL will display an arrow that tells you when to enter a trade. You can also see the amount to trade beside the arrow.
Opting for a trial
Yes you may opt for a trial which has limited availability.
The author's background and experience
My career in software and deep learning development spans across more than 5 years. At work, I lead a team to solve core computer vision tasks for large companies. I continually read all kinds of computer science books and papers, and follows progress on tools used in financial markets.
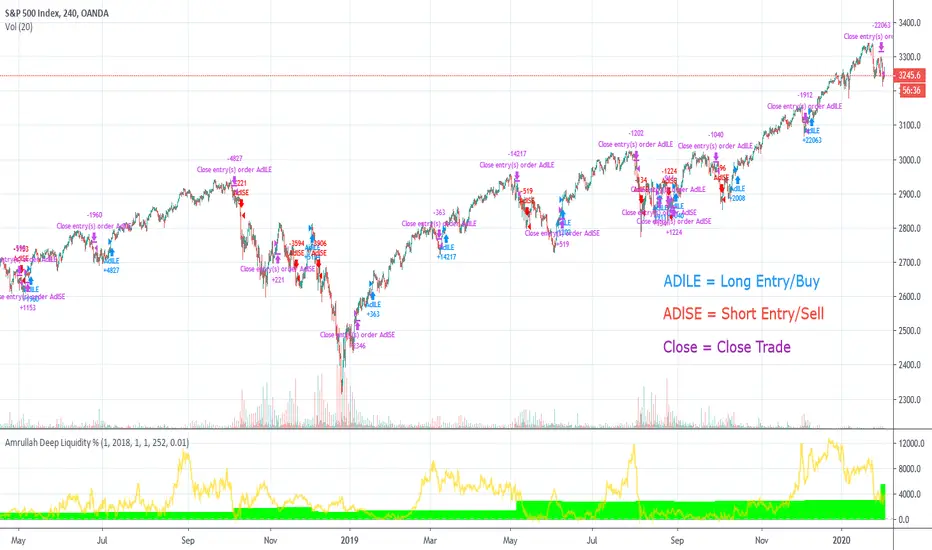
Amrullah Deep Liquidity for ETHUSDAmrullah Deep Liquidity (ADL)
Amrullah Deep Liquidity (ADL) is a high profit factor strategy based on models designed by Muhd Amrullah.
Choosing your trading pair that you are planning to backtest
Check that you have been given access to Amrullah Deep Liquidity (ADL). Select ETHUSD with the default 4H time frame. Once done, open Indicators > Invite-Only Scripts > Amrullah Deep Liquidity %.
Choosing your initial capital that you want to begin backtesting
Go to Settings > Properties > Initial Capital and type in the amount of capital you're starting with. For the ETHUSD trading pair, the initial capital is denominated in USD.
Adjusting your equity at risk until the trades match your risk profile and comfort level
Go to Inputs > Equity Risk and adjust the value you are comfortable with. To analyse performance, you also want to choose the Start Year, Start Month and Start Date. Select lower equity risk for trades that you intend to take without the use of leverage. You can select an equity risk from 0.001 to 0.05 or all the way to 1.
Finding the time frame with the highest profit factor
Profit factor is defined as the gross profit a strategy makes across a defined period of time divided by its gross loss. You may choose to scroll through other time frames to find better models. You can select a different time frame from 1 min to 1H or all the way to 1M. Once you find the model you desire, you are encouraged to check that the model has a backtested profit factor of >3.5. You can then begin looking through the Performance Summary to find other detailed statistics.
Analysing the equity curve from the Amrullah Deep Liquidity (ADL) strategy
A green equity curve indicates that the trades are accumulating profits. A red equity curve indicates that the trades are accumulating losses. A healthy equity curve is one that is green and grows steadily to the right and upward direction.
Analysing the display arrows on the chart
Amrullah Deep Liquidity (ADL) tells you when to take a trade and how much to put in a trade. ADL can do this as the model identifies inventory risk in traders and market makers in the chosen market. On your Tradingview chart, ADL will display an arrow that tells you when to enter a trade. You can also see the amount to trade beside the arrow.
Opting for a trial
Yes you may opt for a trial which has limited availability.
The author's background and experience
My career in software and deep learning development spans across more than 5 years. At work, I lead a team to solve core computer vision tasks for large companies. I continually read all kinds of computer science books and papers, and follows progress on tools used in financial markets.